Abstract
Objectives
The aim was to assess the accuracy and reproducibility of measurements of chemically created periapical lesions using limited cone beam CT.
Methods
Periapical lesions were chemically created in 18 mandibular cadaver teeth. Mandibles were dissected buccolingually using a bone-cutting burr. Diameters and depths were measured directly in the cross-sectional slices using a precision digital caliper. The cross-sectional slices were then embedded in wax, and cone beam CT images were acquired using a NewTom® 3G Plus scanner with both 6 inch and 9 inch fields of view (FOVs). Two oral radiologists measured the diameter and depth of periapical lesions on the cross-sectional images using the built-in measurement tools. Measurements were repeated after a 1 week interval. Inter- and intraobserver agreement was calculated by ANOVA. Regression analysis was used to test the correlation between the cone beam CT and digital caliper measurements.
Results
No significant differences were found in diameter or depth measurements between or within observers or between 6 inch and 9 inch FOV images. Regression analysis of diameter and depth measurements made by direct caliper versus 6 inch or 9 inch FOV images revealed a high regression coefficient (for diameter: 6 inch FOV, R2 _ 94.6%; 9 inch FOV, R2 _ 94.8%; P<0.001; for depth: 6 inch FOV, R2 _ 99.3%; 9 inch FOV, R2 _ 99.3%; P<0.001) showing a strong linear relationship. For the diameter, the mean deviation from direct caliper measurements was 0.0625 mm and 0.08958 mm, respectively; for the 6 inch FOV and 9 inch FOV images, and for depth, the mean deviation was, respectively, −0.1001 mm and 0.09875 mm.
Conclusions
Cone beam CT yielded highly accurate and reproducible results in the quantitative assessment of periapical lesions.
Keywords: cone beam computed tomography, periapical lesion, quantitative measurement
Introduction
The clinical features of periapical lesions are constantly changing, and quantitative evaluation of these lesions can provide useful information for the diagnosis, differentiation, treatment and monitoring of periapical disease. However, two-dimensional radiographic systems can provide only limited information about lesion dimensions.1, 2 Moreover, interobserver3 and intraobserver4 variability in the interpretation of intraoral radiographs is high. Experimental studies have shown that extensive bone destruction may be present without radiographic evidence.5, 6 Not only are two-dimensional radiographs incapable of detecting early stages of bone disease,5, 6 but the actual size of bony lesions is larger than their appearance in radiographic images.7 Bender8 has reported that cortical bone loss of less than 12.5% and mineral bone loss of less than 6.6% in local resorptive bone lesions do not produce radiolucent areas. In view of these shortcomings, objective and quantitative methods are essential for diagnosis, treatment and follow-up.
In recent years, a series of cone beam CT units have been developed for the three-dimensional assessment of dental tissue. Whereas conventional CT scanners require stacking of multiple slices to obtain a complete image,9–11 cone beam CT units centre a cone-shaped X-ray beam on an area or panel detector, allowing them to generate a scan of the entire head with a single rotation of the gantry. The cone beam CT is also superior to the multidetector CT in its ability to display dental hard tissue,12 and its high isotropic spatial resolution, undistorted images, compact size, low exposure times and relatively low cost make it a perfect candidate for a dedicated dentomaxillofacial modality.11
Previous studies of cone beam CT units have focused on their ability to accurately measure actual distances between reference points or the dimensions of holes created using drills with known sizes. The aim of the present study was to assess the accuracy and reproducibility of cone beam CT measurements, of chemically created periapical lesions, using two different fields of view (FOVs), by comparing them with direct digital caliper measurements.
Materials and methods
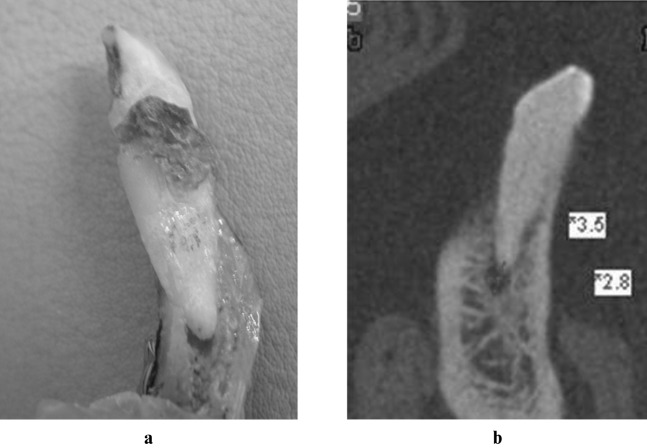
The study sample comprised 18 mandibular cadaver teeth with radiographically intact roots obtained from 2 human cadavers. All skin and soft tissue were carefully removed to expose the body of the mandibles. Periapical lesions were created by extracting each tooth with minimal force, placing a cotton pellet at the apex of the tooth socket, saturating the pellet with 0.10 ml 70% perchloric acid for 12–24 h and cleaning the socket with a cotton pellet and distilled water. The mandibles were then dissected buccolingually using a bone-cutting Lindeman burr to obtain cross-sections similar to those evaluated on the CT reconstructions (Figure 1a,b). The diameters and depths of the periradicular lesions were directly measured in each cross-section from the widest and deepest part of the lesion by one researcher using a precision digital caliper (Shinwa Co., Osaka, Japan) with an accuracy of up to 0.01 mm. Each distance was measured twice, and the average of the two measurements was taken as the gold standard for the cone beam CT measurements. To eliminate observer bias, digital caliper measurements were performed by an anatomist, whereas the cone beam CT measurements were performed by two oral radiologists.
Figure 1.
(a) A tooth after cross-sectional dissection using a bone-cutting burr. (b) Measurement of diameter and depth by using the built-in measurement tool
Following manual measurement, the cross-sectional slices (n _ 18) were embedded in wax and divided into four groups for imaging. To obtain identical cross-sectional data for the 6 inch and 9 inch FOV images, two needles were inserted perpendicularly into the wax bases at the mesial and distal aspects of the teeth and were used as standardized reference points. The cross-sectional slices were reconstructed according to a reference line drawn between these two points. Each group of sections was placed in a water chamber (Teknodent, İstanbul, Turkey) made of Plexiglas® filled with distilled water designed specifically to simulate soft tissue. Cone beam CT images were acquired using a NewTom® 3G Plus scanner (Quantitative Radiology, Verona, Italy) at both 6 inch and 9 inch FOVs, 110 kVp, a 36 s scanning time and 3.6 s exposure time. The NewTom® system uses a “smart beam” technology that automatically adjusts the radiation dosage according to the size of the patient. It has a 1000 × 1000 pixel brilliance amplifier and offers multiple FOVs (6 inch, 9 inch and 12 inch), allowing the dentist to select the optimum scan on a case-by-case basis. Viewing specifications for the FOVs used are as follows: 6 inch FOV: pixel size, 0.11 × 0.11 mm, maximum diameter 100 mm, voxel size 0.19 mm3; 9 inch FOV: pixel size 0.15 × 0.15 mm, maximum diameter 140 mm, voxel size 0.29 mm3.
For the two different FOVs chosen and different groups of teeth examined, mA ranged from 1.5 to 5.8, mAs ranged from 4.96 to 21.07 and the doses ranged from 1.77 to 3.21 mGy. Axial scans of 0.2 mm thickness were taken and reformatted using the NewTom® 3G software version 2.11 on a local workstation to obtain cross-sectional images of 0.30 mm thickness with intervals of 0.5 mm, for a total of 30–48 reconstructed cross-sectional images per tooth. All images were viewed on 17 inch LG Flatron monitors (LG, Seoul, Korea) with 2000:1 contrast, 1280 × 1024 pixel screen resolution and 32 bit colour depth. Each lesion was viewed separately in a darkened room by two calibrated oral radiologists experienced in the use of the software. Prior to measurement, the exact anatomical correlation between the cross-sections of the specimen and the cross-sectional CT reconstructions was established by the anatomist who had performed the direct digital caliper measurements and the two oral radiologists. The largest dimensions of the diameter and depth of the periapical lesions as viewed on the cross-sectional images were measured independently using the built-in measurement tools. The operators could adjust the image contrast and brightness, as necessary. Diameter and depth measurements were taken twice by each observer, and the average of the two measurements for each observer was recorded. Measurements were repeated 1 week later.
Differences between digital caliper and cone beam CT image measurements were assessed by exporting data to the Minitab Release 15-US software package for statistical analysis. ANOVA was used to calculate intra- and interobserver agreement. The correlation between the quantitative measurements obtained from cone beam CT and the digital caliper was tested by regression analysis with a null hypothesis (correlation coefficient equal to zero). Results were assessed according to R2 values, with an R2 > 64% and P < 0.05 considered to indicate a strong relationship between the two methods of measurement.
Results
ANOVA showed no significant differences between or within observers in the diameter and depth measurements obtained from 6 inch FOV and 9 inch FOV images. For the diameter, the Gage Repeatability and Reproducibility (R&R) value was less than 30% for both 6 inch FOV (22.49%) and 9 inch FOV (21.89%) measurements. For depth, the Gage R&R value was also less than 30% for both 6 inch FOV (12.41%) and 9 inch FOV (13.29%) measurements. In view of the similarities among measurements, the average of all diameter and depth measurements by both observers was used in analysis. High regression coefficients indicated a strong linear relationship between direct caliper measurements and 6 inch and 9 inch FOV image measurements (for diameter: 6 inch FOV, R2 _ 94.6%; 9 inch FOV, R2 _ 94.8%; for depth: 6 inch FOV, R2 _ 99.3%; 9 inch FOV, R2 _ 99.3%) (P < 0.001) (Figures 2–5). For the diameter, mean deviations from direct caliper measurements were 0.0625 mm (2.27%) and 0.08958 mm (2.78%), respectively, for the 6 inch FOV and 9 inch FOV image measurements. At a 6 inch FOV, diameter measurements differed from direct caliper diameter measurements by between −0.6845 mm and 0.8095 mm with 95% probability, whereas at a 9 inch FOV the difference was between −0.64042 mm and 0.81958 mm. The ratio of diameter measurements at a 6 inch FOV differed from those of direct caliper measurements between −12.41% and 16.95% with 95% probability, whereas the difference was between −11.46% and 17.03% for a 9 inch FOV. For depth, mean deviations from direct caliper measurements were −0.1001 mm (−1.34%) and 0.09875 mm (−1.44%), respectively, for the 6 inch FOV and 9 inch FOV image measurements. At a 6 inch FOV, depth measurements differed from direct caliper depth measurements by between −0.7315 mm and 0.5313 mm with 95% probability, whereas at a 9 inch FOV the difference was between −0.72515 mm and 0.52765 mm. The ratio of depth measurements at a 6 inch FOV differed from those of direct caliper measurements by between −13.51% and 10.82% with 95% probability, whereas the difference was between −13.50% and 10.63% for a 9 inch FOV.
Figure 2.
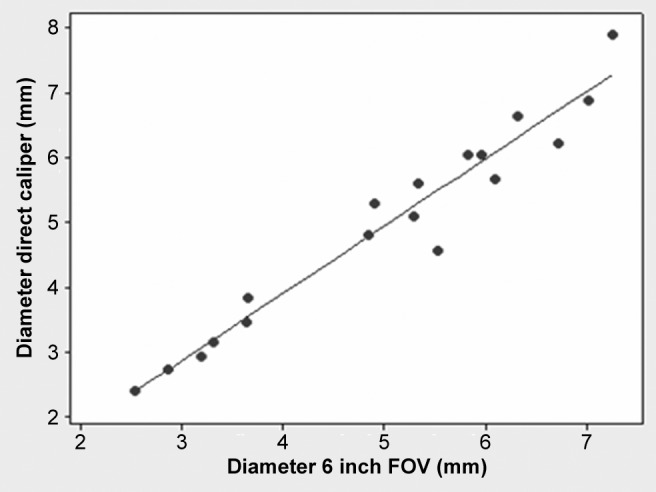
Regression analysis of caliper and 6 inch field of view (FOV) image diameter measurements. The high regression coefficient (R2 _ 94.6%) shows that there is a strong linear relationship between direct caliper and 6 inch FOV image diameter measurements
Figure 5.
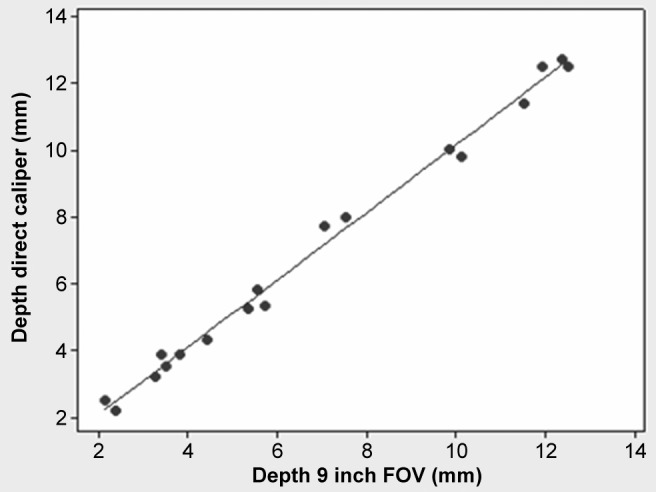
Regression analysis of direct caliper and 9 inch field of view (FOV) image depth measurements. The high regression coefficient (R2 _ 99.3%) shows that there is a strong linear relationship between direct caliper and 9 inch FOV image depth measurements
Figure 3.
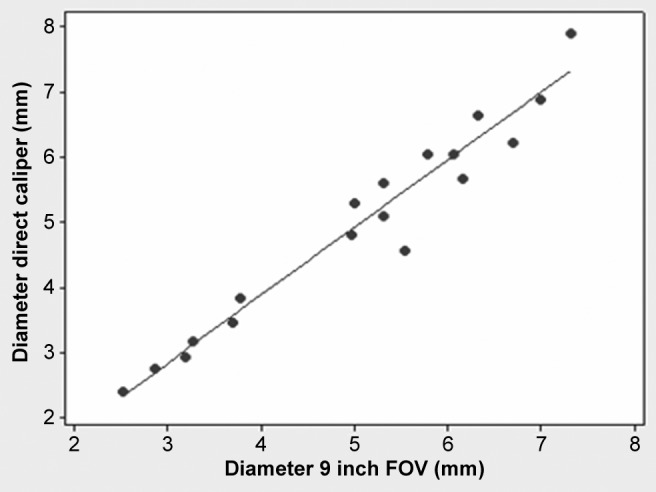
Regression analysis of caliper and 9 inch field of view (FOV) image diameter measurements. The high regression coefficient (R2 _ 94.8%) shows that there is a strong linear relationship between direct caliper and 9 inch FOV image diameter measurements
Figure 4.
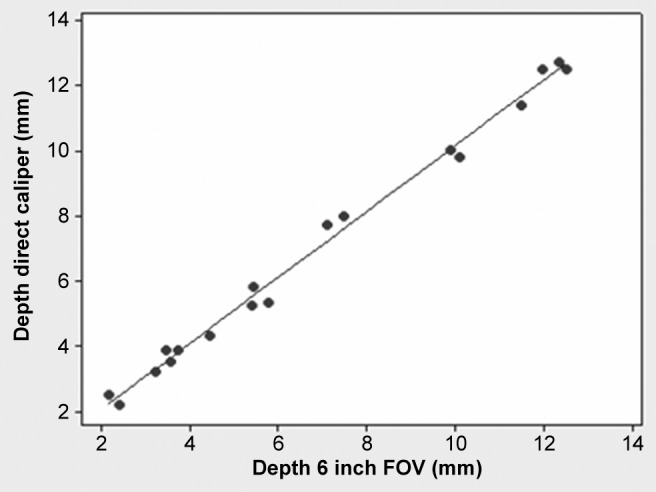
Regression analysis of direct caliper and 6 inch field of view (FOV) image depth measurements. The high regression coefficient (R2 _ 99.3%) shows that there is a strong linear relationship between direct caliper and 6 inch FOV image depth measurements
Discussion
The aim of this study was to assess the accuracy and reproducibility of measurements of chemically created periapical lesions using cone beam CT. The findings showed both high accuracy and reproducibility, with no significant differences between observers or FOVs. The chemically created lesions measured in this study had obscure borders similar to those of clinical periapical lesions. Observer performance, selection of reference points, mouse sensitivity and software capabilities are all important factors in the measurement of lesion dimensions. In this study, experienced and calibrated oral radiologists equally familiar with the software used acted as operators.
Data analysis found a random increase and decrease with a strong linear relationship and correlation in the 6 inch and 9 inch FOV cone beam CT and direct digital caliper measurements for diameter and depth. The regression coefficient for depth measurements was slightly higher than for diameter measurements; however, this difference was statistically insignificant. Compared with diameter measurements, depth measurements showed a slightly smaller mean difference and slightly narrower range of deviation; however, these differences were also statistically insignificant.
In one study,13 the depth and diameter of simulated bone defects in an acrylic block and a human mandible were measured using cone beam CT, and the linear measurements were compared with the predetermined machined dimensions. As with the present study, high intra- and interclass reliability was found. Mean height and width accuracies were −0.03 mm (±0.01 SE) and −0.01 mm (±0.02 SE), respectively, (P > 0.05), for the acrylic block measurements and −0.27 mm (±0.02 SE) and −0.07 mm (±0.02 SE), respectively, for the human mandible measurements (P < 0.01).13 The relatively lower accuracy obtained in the present study can be attributed to the obscure borders of the chemically created lesions, which made it more difficult to determine the correct reference points for measurements.
Another recent study14 comparing the performance of a cone beam CT scanner and a multidetector row CT scanner in measuring the distance and volume of holes created using burrs with known diameters found both systems to be satisfactory. Linear distance measurements made by a single observer showed an average absolute measurement error of 0.26 mm (±0.18 mm) and an average absolute percentage error of 0.98% (±0.73%) for the cone beam CT. Cronbach's alpha indicated high intraobserver consistency.14 The current study found similar results in terms of intraobserver consistency; however, the methodologies of the two studies differed in that, rather than having a single observer perform all measurements as in the previous study,14 in the current study caliper measurement was performed by an anatomist and cone beam CT measurement by two independent oral radiologists.
Various measurements from the cone beam CT and multislice CT scanner have been compared when the mandible is in both a dry state and immersed in sucrose solution to simulate soft tissues.15 The cone beam CT measurements obtained from a cadaver mandible embedded in sucrose solution were found to be the most accurate, with a 2.3% mean measurement error.15 In the present study, mandibular sections were embedded in wax and placed in a soft tissue equivalent to mimic the clinical situation and to obtain high-contrast images.
Only slight deviations in measurements of artificial periodontal defects created by drills were found between conventional CT and cone beam CT scans and histological specimens.16 Mean deviations were 0.16 ± 0.10 mm for the CT scans and 0.19 ± 0.11 mm for the cone beam CT scans. The best imaging quality was provided by the dental cone beam CT.16
Radiation doses from cone beam CT scans vary substantially between devices, FOVs and other technical factors.17 Compared with the NewTom® 3G, radiation doses from full FOV examinations have been found to be 3.3 times greater using the i-CAT® and 9.5 times greater using the Mercuray®. The effective radiation dose from a NewTom® 3G (56.5 μSv) is four times higher than that of panoramic radiography (13 μSv).17 The present study was not designed to measure the effective doses derived for the different FOVs on the equipment. However, a recent study,18 which found that smaller FOVs resulted in less effective doses, suggested that a smaller FOV should be used for dental images and that a larger FOV should be restricted to cases in which a wider view is required.18
The NewTom® 3G system used in the present study has the ability to automatically adjust radiation dosage based on patient size, making it possible to apply different radiation levels for each patient. The use of newer, “smart beam” and “smart sensor” technologies should be encouraged to provide proper radiation protection to patients.
Conclusion
Cone beam CT imaging provides highly accurate and reproducible measurements of periapical lesions. Changes in FOV did not affect measurement accuracy. There were no significant differences in diameter and depth measurements obtained from 6 inch FOV and 9 inch FOV images or between or within observers.
Acknowledgments
The authors are grateful to Asım Horasan for his technical assistance and to Tümer Arıtürk for the statistical analysis.
References
- 1.Rozylo-Kalinowska I. Digital radiography density measurements in differentiation between periapical granulomas and radicular cysts. Med Sci Monit 2007;13:129–136 [PubMed] [Google Scholar]
- 2.Farman AG, Avant SL, Scarfe WC, Farman TT, Green DB. In vivo comparison of Visualix-2 and Ektaspeed Plus in the assessment of periradicular lesion dimension. Oral Surg Oral Med Oral Pathol Oral Radiol Endod 1998;85:203–209 [DOI] [PubMed] [Google Scholar]
- 3.Goldman M, Pearson AH, Darzenta N. Endodontic success. Who's reading the radiograph? Oral Surg Oral Med Oral Pathol 1972;33:432–437 [DOI] [PubMed] [Google Scholar]
- 4.Goldman M, Pearson AH, Darzenta N. Reliability of radiographic interpretations. Oral Surg Oral Med Oral Pathol 1974;38:287–293 [DOI] [PubMed] [Google Scholar]
- 5.Bender IB, Seltzer S. Roentgenographic and direct observation of experimental lesions in bone: I. J Am Dent Assoc 1961;62:152–160 [Google Scholar]
- 6.Bender IB, Seltzer S. Roentgenographic and direct observation of experimental lesions in bone: II. J Am Dent Assoc 1961;62:708–716 [Google Scholar]
- 7.Shoha RR, Dowson J, Richards AG. Radiographic interpretation of experimentally produced bony lesions. Oral Surg Oral Med Oral Pathol 1974;38:294–303 [DOI] [PubMed] [Google Scholar]
- 8.Bender IB. Factors influencing the radiographic appearance of bony lesions. J Endod 1982;8:161–170 [DOI] [PubMed] [Google Scholar]
- 9.Liu D, Zhang W, Zhang Z, Wu Y, Ma X. Localization of impacted maxillary canines and observation of adjacent incisor resorption with cone-beam computed tomography. Oral Surg Oral Med Oral Pathol Oral Radiol Endod 2008;105:91–98 [DOI] [PubMed] [Google Scholar]
- 10.Mozzo P, Procacci C, Tacconi A, Martini PT, Andreis IAB. A new volumetric CT machine for dental imaging based on the cone-beam technique: preliminary results. Eur Radiol 1998;8:1558–1564 [DOI] [PubMed] [Google Scholar]
- 11.Sukovic P. Cone beam computed tomography in craniofacial imaging. Orthod Craniofacial Res 2003;6:31–36 [DOI] [PubMed] [Google Scholar]
- 12.Hashimoto K, Arai Y, Iwai K, Araki M, Kawashima S, Terakado M. A comparison of a new limited cone beam tomography for dental use with a multidetector row helical CT machine. Oral Surg Oral Med Oral Pathol Oral Radiol Endod 2003;95:371–377 [DOI] [PubMed] [Google Scholar]
- 13.Pinsky HM, Dyda S, Pinsky RW, Misch KA, Sarment DP. Accuracy of three-dimensional measurements using cone-beam CT. Dentomaxillofac Radiol 2006;35:410–416 [DOI] [PubMed] [Google Scholar]
- 14.Mischkowski RA, Pulsfort R, Ritter L, Neugebauer J, Brochhagen HG, Keeve E, et al. Geometric accuracy of a newly developed cone-beam device for maxillofacial imaging. Oral Surg Oral Med Oral Pathol Oral Radiol Endod 2007;104:551–559 [DOI] [PubMed] [Google Scholar]
- 15.Suomalainen A, Vehmas T, Kortesniemi M, Robinson S, Peltola J. Accuracy of linear measurements using dental cone beam and conventional multislice computed tomography. Dentomaxillofac Radiol 2008;37:10–17 [DOI] [PubMed] [Google Scholar]
- 16.Mengel R, Candır M, Shiratori K, Flores deJacoby L. Digital volume tomography in the diagnosis of periodontal defects: an in vitro study on native pig and human mandibles. J Periodontol 2005;76:665–673 [DOI] [PubMed] [Google Scholar]
- 17.Ludlow JB, Ludlow LED, Brooks SL, Howerton WB. Dosimetry of 3 CBCT devices for oral and maxillofacial radiology: CB Mercuray, NewTom 3G and i-CAT. Dentomaxillofac Radiol 2006;35:219–226 [DOI] [PubMed] [Google Scholar]
- 18.Hirsch E, Wolf U, Heinicke F, Silva MA. Dosimetry of the cone beam computed tomography Veraviewepocs 3D compared with the 3D Accuitomo in different field of views. Dentomaxillofac Radiol 2008;37:268–273 [DOI] [PubMed] [Google Scholar]


