

Abstract
Objectives
This study describes an improved method for examining and diagnosing temporomandibular joint (TMJ) dynamics by 3.0 T pseudodynamic MRI.
Methods
Clinical observation and conventional static MRI of volunteers (one without and eight with TMJ arthrosis) were followed by 3.0 T pseudodynamic MRI in positions ranging from the mouth closed to mouth fully opened. Condylar head (Cd), articular disc anterior border (Da) and articular disc posterior border (Dp) were digitized on sagittal images to determine trajectory and velocity patterns.
Results
Patients were divided into three groups based on the presence or absence of dysfunction: Group 1, no dysfunction on the right or left side of the TMJ; Group 2, dysfunction on the right or left side of the TMJ; and Group 3, dysfunction on both the right and left sides of the TMJs. In 75% of patients (12 of 16 joints), pseudodynamic TMJ analysis was useful for determining a functional abnormality. Using a points system based on three trajectory and seven velocity patterns, discs with adhesion and perforation had significantly fewer points than discs with anterior displacement (with and without reduction) and discs with no abnormality (P = 0.019 < 0.05).
Conclusions
Trajectory and velocity patterns based on 3.0 T pseudodynamic MRI identified the affected side and determined the extent of morbidity in the Cd as well as the Da and Dp. The typical abnormal movement pattern of discs with anterior displacement (with and without reduction) and pathological structural changes of the articular disc (such as adhesion and perforation) could be identified.
Keywords: temporomandibular joint, magnetic resonance imaging, kinematics, biomechanics
Introduction
Pseudodynamic 1.5 T MRI is not used as a routine MRI examination technique for assessment of temporomandibular joint (TMJ) disorders, but such imaging can help to assess movement of the condylar head (Cd)1 and articular disc.2,3 Cine-MRI diagnosis is useful for post-therapeutic evaluation of an adherent TMJ disc.4 The movement of the Cd and articular disc in TMJs with adhesion and perforation abnormalities is not well understood. Static MRI cannot effectively determine the border between the posterior band of the articular disc and its posterior attachment.5 Some studies have used the central, thin part of the articular disc as a measurement marker;3 however, there is a lack of detailed research on the movement of Cd together with the movement of the anterior (Da) and posterior (Dp) borders of the articular disc.
Pseudodynamic MRI differs from the natural opening of the TMJ.6 Studies using pseudodynamic MRI have reported that condylar velocity patterns of normal subjects move synchronously with bilateral Cds.7,8 Cineradiography9 and videofluorography10 can capture physiological mouth opening and show that Cd velocity patterns peak relatively near the articular eminence.
3.0 T MRI with a super-high magnetic field provides imaging of the human body and head, but the equipment used lacks a specialized dual surface coil for clear TMJ images. Although some studies have used a surface coil for TMJ imaging,11 the efficacy of 3.0 T TMJ pseudodynamic imaging is unclear. This paper describes an improved method for examining and diagnosing TMJ abnormalities using 3.0 T pseudodynamic MRI.
Materials and methods
Clinical findings
Database images of nine volunteers (six males and three females; between 24 and 35 years of age, median 26.5 years) were used in the study. Ethical approval was obtained from the ethics committee of the University of Tokushima Medical and Dental Hospital in Japan. Volunteers received information about the study and informed written consent was obtained. One volunteer had no symptoms of TMJ dysfunction, whereas the other eight had clinically diagnosed abnormalities related to TMJ arthrosis as defined by the Japanese Society for TMJ criteria.11
Clinical examination revealed the presence of TMJ pain and sounds (clicking or crepitus) with jaw movement. It also revealed the side of the TMJ affected by pain or sounds as well as limitation and deviation during mouth opening. Clinical findings that could not be differentiated between the right and left sides of the TMJ (e.g. limitation and deviation during mouth opening) were categorized as bilateral.
Static MRI
Reports on 3.0 T imaging methods for the TMJ served as a reference.12 Images were taken with 3.0 T MRI equipment (Signa 3.0 T, GE Yokogawa Medical Systems, Ltd., Tokyo, Japan) using a 3 inch dual surface coil (GE Yokogawa Medical Systems). Scan parameters of the 3.0 T static MRI sequences are shown in Table 1. MR images were selected from a database of 3.0 T TMJ images. Digital Imaging and Communications in Medicine (DICOM) database images (512 pixels × 512 pixels × 16 bit) were converted to tagged image file format (TIFF) images with OSIRIS (Version 4.19, University of Geneva, Switzerland) and used for measurements.
Table 1. Scan parameters of 3.0 T MRI sequences.
| Static MR |
Pseudodynamic MR | |||||
| Three-plane localizer | Proton density Sagittal | T2 weighted Sagittal | Proton density Coronal | T2 weighted Coronal | ||
| Flip (degrees) | 30 | 90 | 90 | 90 | 90 | 90 |
| Echo | 1/1 | 1/1 | 1/1 | 1/1 | 1/1 | 1/1 |
| TE | 1.348 | 12.86 | 85.2 | 12.91 | 85.72 | 10.01 |
| TR (ms) | 4.992 | 2800 | 5900 | 2100 | 4800 | 1800 |
| Thick/space | 8.0/2.0 | 2.0/0.2 | 2.0/0.2 | 2.0/0.2 | 2.0/0.2 | 2.0/1.0 |
| FOV (cm) | 24×24 | 14×14 | 14×14 | 14×14 | 14×14 | 14×14 |
| Matrix | 256×128 | 448×256 | 512×320 | 448×256 | 512×320 | 448×224 |
| NEX | 1.0 | 2.0 | 2.0 | 2.0 | 2.0 | 1.0 |
| Time (s) | 17 | 180 | 240 | 180 | 240 | 40 |
TE, echo time; TR, repetition time; FOV, field of view; NEX, number of excitations
The volunteers were instructed to lie supine and their heads were positioned perpendicular to the scanning table in the Frankfort horizontal plane. The median sagittal plane of the head was also perpendicular to the scanning table. The Cd was palpated and 21 3-plane localizer static MR images (7 axial, 7 sagittal and 7 coronal; thickness 8 mm; interval 1 mm) were taken. The largest and clearest axial image was used as a measurement localizer image to set individual planes for cutting the Cd.
Seven individualized proton density images and seven T2 weighted sagittal images were obtained for the right and left sides of the TMJ (thickness 2 mm; interval 0.2 mm) in the mouth closed and mouth fully opened position. The fourth image provided the midpoint of the Cd long axis.
Static MRI findings indicated the presence or absence of a TMJ abnormality and its location. Joint effusion, osteoarthrosis, disc displacement and disc shape were all considered when determining the TMJ status. More than one high-signal line (e.g. spot intensity) in the upper or lower joint space was considered to be joint effusion. Osteoarthrosis was indicated by the presence of pathological bone changes such as eburnation (subchondral sclerosis) or erosive bone change with or without deformity of Cd and osteophytes. Articular disc position (disc displacement with or without reduction) was assessed in the mouth closed and mouth fully opened positions. Disc abnormalities such as folding were identified.
Pseudodynamic MRI
Scan parameters of the 3.0 T pseudodynamic MRI sequences are shown in Table 1. Pseudodynamic images were taken parallel to sagittal sections of the head in the mouth closed position to avoid different cross-sections of Cd, articular eminence and glenoid fossa from the mouth closed position to mouth fully opened positions. Seven sagittal images of the right and left sides of the TMJ (thickness 2 mm; interval 1 mm) were taken, and the fourth image coincided with the midpoint of the Cd long axis. Flaps (FL.400 L, Hanshin Technical Laboratory, Ltd., Hyogo, Japan) were added from mouth closed position to mouth fully opened positions. Serial images were taken for 40 s per flap.
Measurement points
Co-ordinate points for the pseudodynamic measurements are shown in Figure 1. Image J software13 was used for the measurements. The average of the pixel co-ordinate values at three time measurements was converted to 0.2734 mm/pixel. Co-ordinate values were determined for the lowest articular eminence (Em) and corrected for head rotation.
Figure 1.
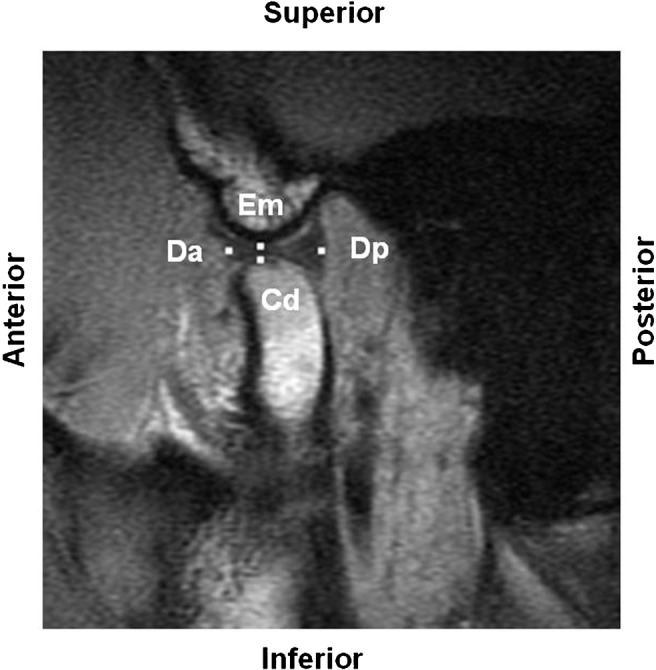
Co-ordinate points for pseudodynamic measurement. Em, lowest articular eminence; Cd, highest protrusion of the condylar head, where the perpendicular line from the posterior mandibular ramus meets the condylar head; Da, articular disc anterior border, where the posterior border of the anterior attachment showing low signal intensity is separated from the surrounding area in the anterior band of the articular disc; Dp, articular disc posterior border, where a bow tie configuration is derived from a temporal part of posterior attachment and a condylar part of posterior attachment
Analysis by trajectory and velocity patterns
We studied trajectory patterns connecting the Cd, Da and Dp measurement points for each flap insertion, and velocity patterns were measured at these points (Figure 1). Some volunteers could insert no more than four flaps because of limited jaw movement. Normal and abnormal trajectory and velocity patterns were compared and categorized.
Results
Normal TMJ trajectory and velocity patterns
Figure 2 shows (a) trajectory and (b) velocity patterns at Cd, Da and Dp measurement points on the left side of a normal TMJ (case 1).
Figure 2.

Normal (a) trajectory and (b) velocity patterns (Case 1, left temporomandibular joint)
Abnormal TMJ trajectory patterns
Based on the measurement of points Cd, Da and Dp in the mouth closed position and during flap insertion, trajectory patterns of abnormal TMJs were divided according to the degree of positive or negative trajectory and length of the trajectory (Figure 3). There were three basic patterns: Type I (relatively curved), Type II (relatively short and straight) and Type III (zigzag). Type I was subdivided according to whether or not there was positive trajectory from flap 0 to 1 to create subtype I-a (downward trajectory from flap 0 to 1) and subtype I-b (upward trajectory from flap 0 to 1).
Figure 3.
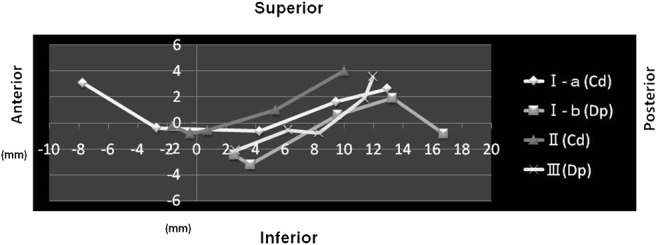
Trajectory patterns I-a, I-b, II and III; Cd, condylar head; Dp, posterior border of the articular disc; Type I, relatively curved; subtype I-a, downward trajectory at flap 0 to 1; subtype I-b, upward trajectory at flap 0 to 1; Type II, relatively short and straight; Type III, zigzag
Abnormal TMJ velocity patterns
Based on the measurement of points Cd, Da and Dp in the mouth closed position and during flap insertion, velocity patterns of abnormal TMJs were divided according to peaks, troughs and velocity duration (Figure 4).
Figure 4.

Velocity patterns 1A/2A/3A, 1B/2B/3B, 4A/5A/6A/7 and 4B/5B/6B/7. Type 1, chevron shape with one peak; Type 2, U-shape with one trough; Type 3, convexo-concave shape with one peak and one trough; Type 4, convexo-concave shape with a total of three asperities of velocity; Type 5, without peak or trough in velocity and move or stop gradually; Type 6, without peak or trough in velocity and becomes temporally stable; Type 7, without peak or trough in velocity and stable; 0–1 flap, initial step; 1–2 flaps, early steps; 2–3 flaps, intermediate steps; 3–4 flaps, late steps; 4–5 flaps, final steps
Normal and abnormal trajectory and velocity patterns for all volunteers were compared (Table 2). TMJ morbidity was graded based on the movement of Cd, Da and Dp. A point system was devised to determine the extent of TMJ morbidity.
Table 2. Correlation between normal and abnormal trajectory patterns and velocity patterns (all cases, right and left temporomandibular joints).

TMJ, temporomandibular joint; Cd, condylar head; Da, anterior border of the articular disc; Dp posterior border of the articular disc. Trajectory patterns: I, relatively curved; I-a, downward trajectory at flap 0 to 1; I-b, upward trajectory at flap 0 to 1; II, relatively short and straight; III, zigzag; Velocity patterns: Type 1, chevron shape with one peak; Type 2, U-shape with one trough; Type 3, convexo-concave shape with one peak and one trough; Type 4, convexo-concave shape with a total of three asperities of velocity; Type 5, without peak or trough in velocity and move or stop gradually; Type 6, without peak or trough in velocity and becomes temporally stable; Type 7, without peak or trough in velocity and stable
Grades were based on the following scientific weighting:
Grade 1, 3 points: normal, Cd and Da, trajectory (I-a) and velocity (1A);
Grade 2, 2 points: normal, Dp, trajectory (I-b) and velocity (1A, 2A or 3A);
Grade 3, 1 point: abnormal, Cd, Da and Dp, trajectory (I) and velocity (except 1A, 2A, or 3A); and
Grade 4, 0 points: abnormal, Cd, Da, and Dp; trajectory (II or III).
Pseudodynamic MRI analysis was not considered to be effective (meshed area) if a joint scored ≥ 6. Because only one case with no symptoms scored ≥ 6 (black area), pseudodynamic MRI analysis was considered to be effective if a joint scored ≤ 5. The extreme right column shows the scored values from the pseudodynamic analysis.
Trajectory and velocity patterns for Cd, Da and Dp were analysed, and the TMJs of eight volunteers with TMJ arthrosis were divided based on the presence or absence of dysfunction. Group 1: no dysfunction on the right or left side of TMJs; Group 2: dysfunction on the right or left side of TMJs; and Group 3: dysfunction on the right and left sides of TMJs.
Clinical, static MRI and pseudodynamic MRI in abnormal TMJ
Table 3 shows the clinical, static MRI and pseudodynamic MRI findings in all volunteers. In the six TMJs marked with an “*”, the relationship between pseudodynamic and clinical findings was revealed not by morphological analysis alone, but by functional analysis. In the six other TMJs marked with a “†”, the pathology was clearer and the relationship between the pseudodynamic and clinical findings could be explained better by combining functional with morphological analysis. In the four TMJs marked with a “**” and “×”, including two “**” in which morphological analysis showed abnormalities not detected by functional analysis, the latter “×” could not explain the relationship between pseudodynamic and clinical findings. In the present experiment, functional analysis by MRI was effective in 12 of 16 (75%) TMJs.
Table 3. Relationship between clinical, static and pseudodynamic MRI for all volunteers.

Disc adhesion and perforation (four temporomandibular joints (TMJs)) < ADDwR + ADDwoR (five TMJs) < disc with no abnormality (four TMJs); Kruskall–Wallis test; P = 0.019 < 0.05; ADDwR, anterior disc displacement with reduction; ADDwoR, anterior disc displacement without reduction. *relationship between pseudodynamic and clinical findings not revealed by morphological analysis alone; †relationship between pseudodynamic and clinical findings can be explained better by combining functional and morphological analysis; ×functional analysis cannot explain the relationship between pseudodynamic and clinical findings; **morphological analysis shows abnormalities not detected by functional analysis
The Kruskal–Wallis test revealed that discs with adhesion and perforation (four TMJs) had significantly fewer points than discs with anterior displacement with and without reduction (five TMJs) and discs with no abnormality (four TMJs) (P = 0.019 < 0.05).
Discussion
Analyzing TMJ dynamics by trajectory and velocity patterns
Normal TMJ dynamics
In normal TMJs, Cd and Da showed the subtype I-a trajectory pattern (relatively curved, without a downward trajectory between flap 0 and 1) that moved synchronously on the right and left sides. Cd and Da showed the subtype 1A velocity pattern (chevron shape, one intermediate peak) with the peak of Cd passing through the articular eminence. This pattern seemed to capture the natural opening pattern of the temporomandibular joint the same as cineradiography9 and videofluorography.10
In the pseudodynamic MR images in our study, the border between the posterior band of the articular disc and its posterior attachment at flap 0 was obscured. This posteroinferior limit of the articular disc and posterior attachment was used as the Dp measurement point. As a result, between flaps 0 and 1 there was an upward trajectory (subtype I-b) and acceleration (subtypes 2A and 3A). Subtypes 2A and 3A of the velocity pattern were treated as normal patterns resembling the subtype 1A velocity pattern.
Another factor influencing this upward trajectory of Dp and acceleration of Cd, Da and Dp may have been the addition of flaps to insertion steps 0 and 1 because of the overbite and overjet (vertical and horizontal distance between upper and lower anterior incisal teeth in the mouth closed position) of the volunteers.
The articular disc cannot be regarded as a single rigid body because of differences in movement between the anterior and posterior borders.
Abnormal TMJ dynamics
Significant changes in TMJ dynamics could not be analysed in abnormal TMJs using only Cd trajectory patterns. Many abnormal TMJs showed abnormal velocity patterns that were useful for analysing their articular disc dynamics. There were more abnormal Da and Dp velocity patterns than trajectory patterns; hence, velocity patterns were more useful for analysing these dynamics. After evaluation, eight cases with TMJ disorder could be divided into three dysfunctional groups (see Results section).
Comparison of the clinical, static and pseudodynamic MRI findings showed that pseudodynamic MRI analysis was useful in 12 of the 16 (75%) joints. Analysis of morphological and functional findings by static and pseudodynamic MRI explained the clinical findings and roughly described the pathology.
Significance of TMJ pseudodynamic analysis
Typical anterior disc displacement with reduction was suspected following pseudodynamic MRI analysis in cases 3 (left side), 4 (left side), 5 (right side) and 9 (left side). The trajectory pattern was normal in case 4 (Figure 5). A sudden decrease in movement of the condyle and disc and the ensuing sudden increase in velocity (a deceleration and acceleration pattern) were observed hemilaterally. When there was a sudden deceleration of the condyle and disc on one side, the contralateral condyle and disc showed sudden acceleration, especially at the Da. We could distinguish hemilateral anterior disc displacement with reduction that did or did not affect the opposite side. In cases 4 (left side) and 9 (left side), disc displacement with reduction was observed only by pseudodynamic MRI.
Figure 5.

Anterior disc displacement with reduction (ADDwR) (Case 4): (a) trajectory pattern and (b) velocity pattern
On the right side of case 6 (Figure 6), typical anterior disc displacement without reduction (with folded articular disc) was suspected based on the pseudodynamic MR images, and the right Cd trajectory patterns were subtype II (relatively short and straight, not passing through Em). “Folded” Da and Dp remained anterior to Em. Cd, Da and Dp velocity patterns on both right and left sides showed all deceleration patterns that appeared in Cd (subtypes 5B and 2B), Da (subtypes 3B and 3B) and Dp (subtypes 3B and 6B). The trajectory pattern on the left side appeared normal. Deceleration on the one side was caused by movement of the other side. Other types of displacement (medial, lateral, posterior, rotational and sideways)14 were not observed in this study.
Figure 6.

Anterior disc displacement without reduction (ADDwR) (Case 6): (a) trajectory pattern and (b) velocity paltern
MRI diagnosis has been used for post-therapeutic evaluation of an adherent TMJ disc,4 but the presence of a characteristic movement of the condyle or articular disc with disc adhesion before treatment has not been reported. In our study, disc adhesion was suspected in Cases 7 (right and left side) and 9 (right side) following pseudodynamic MRI analysis.
In Case 7, the trajectory patterns were almost normal, but the Cd, Da and Dp velocity patterns were subtype 5A (acceleration) in which the condyle “dragged” the articular disc, because Cd, Da and Dp moved nearly the same distance, accelerating as the mouth opened. Static MR images showed joint effusion on the right and left sides of Case 7.
In Figure 7 (Case 9), the trajectory patterns were abnormal subtype II (relatively short and straight). The right Cd did not exceed Em, and the Dp trajectory pattern was relatively short and straight. However, the velocity patterns of the right Dp were subtype 7 (stable) in which Dp moved independently from Cd, and Da moved nearly the same distance without accelerating as the mouth opened. Co-ordination between the condyle and articular disc was lost; the condyle could not “drag” the Dp, with the latter behaving as if there was disc adhesion between the posterior attachment and posterior slope of the articular eminence. In Case 9, the left Cd did not exceed Em and the trajectory pattern of Dp was relatively short and straight. The velocity pattern on the left side in Case 9 showed a typical deceleration and acceleration pattern of anterior disc displacement with reduction. Da disc adhesion was not considered for this velocity pattern.
Figure 7.

Disc adhesion (Case 9): (a) trajectory pattern and (b) velocity pattern
Obscurity of the temporal posterior attachment has been reported as a characteristic MRI finding in patients with disc perforation.15–17 In over half of perforation or disruption cases mouth opening is not restricted.15 Disc adhesion could be associated with obscurity of the temporal posterior attachment, and in such cases mouth opening would be restricted. It was difficult to distinguish adhesion and perforation only by the latitude of anterior condylar movement. Obscurity of the temporal posterior attachment was rare in 3.0 T pseudodynamic MRI analysis (only one abnormal TMJ in this study, i.e. the right side of Case 8).
In Figure 8 (Case 8), the right Cd trajectory pattern was relatively curved and exceeded Em, with no recognizable abnormality. The velocity pattern of the right Cd and Da temporarily decelerated (subtypes 3B and 4B) compared with the chevron pattern (subtype 1A) of the opposite left Cd and Da. The right and left Da may have been “dragged” by the movement of Cd. The right and left Dp trajectory patterns were subtype II (relatively short and straight), and their velocity patterns were subtype 6A (stable, acceleration and then stable). Because Dp moved independently of Cd and Da remained in the same position from mouth closed to mouth half-opened, disc adhesion in Case 8 was thought to be more advanced than in Cases 7 and 9, with possible perforation. The left side of Case 8 showed a relatively high number of points (4 points) even though Dp was subtype 6A, similar to the opposite right side Dp. The left side of this TMJ may not have been severely damaged. Instead, movement on the left side of the TMJ may have been restricted by stable acceleration and movement of Dp on the right side.
Figure 8.

Disc perforation (Case 8): (a) trajectory pattern and (b) velocity pattern
Discs with adhesion and perforation had significantly fewer points than discs with anterior displacement (with and without reduction) and discs with no abnormality (P = 0.019 < 0.05), which may constitute the rationale of this point system. Pathological conditions of the articular disc other than disc displacement were evaluated by pseudodynamic MRI analysis. In particular, stable or acceleration Dp patterns (subtypes 7, 6A and 5A) may be associated with pathological conditions in the temporal posterior attachment such as adhesion and perforation of the articular disc.
3.0 T static MRI permits clearer imaging than 1.5 T imaging, including the contour of subtle changes such as anterior and posterior borders of the articular disc. It also allows for a slightly improved diagnosis of disc displacement. Although 3.0 T static MRI does not significantly reduce the examination time, it may produce clearer images that make 1.5 T static images unnecessary. T2 static images were necessary for diagnosing joint effusion. As with static images, movement images were necessary for diagnosing lateral or rotational disc displacement in cases where the mediolateral border contour of the disc was obscured. Supplementary images of the long axis of the condyle and anteroposterior frontal sections were also necessary.
In conclusion, analysis of morphology and function using MRI revealed the relationship of an abnormality with clinical findings. Patients were divided into three TMJ functional diagnosis patterns: no dysfunction, dysfunction on one side and dysfunction on both sides. In 75% (12 of 16 joints) of cases, pseudodynamic TMJ analysis was useful for determining functional abnormality. Using a point system that combined trajectory and velocity patterns, discs with adhesion and perforation had significantly fewer points than discs with anterior displacement (with and without reduction) and discs with no abnormality (P = 0.019 < 0.05). 3.0 T pseudodynamic MRI analysis of trajectory and velocity patterns helped identify the affected side and determine the extent of morbidity in Da, Dp and Cd that could not be revealed using previous methods, thereby showing potential clinical application. Pseudodynamic MRI analysis indicated typical anterior disc displacement with and without reduction and revealed pathological structural changes in the articular disc (adhesion and perforation).
Further investigation is required to distinguish articular disc adhesion and perforation based on trajectory and velocity patterns. The pathology shown by Cd, Da and Dp in TMJs and determining whether the true pathology lies in the articular disc or in surrounding tissues such as the joint capsule, ligament and masticatory muscles require further evaluation.
Acknowledgments
We would like to thank all the volunteers who participated in our study.
This study was approved by the ethics committee of Medical and Dental Hospital of the University of Tokushima, Research Number: 432. The study was supported, in part, by a Grant-in-Aid for Science Research of the Ministry of Education, Culture, Sports, Science, and Technology (Scientific Research (C), 2008–2010, Research Number 20592203).
This study was presented in the 7th Asian Congress of Oral and Maxillofacial Radiology in Nara, Japan, Nov 20–22 2008 (ACOMFR 2008).
References
- 1.Chen J, Buckwalter K. Displacement analysis of the temporomandibular condyle from magnetic resonance images. J Biomech 1993;26:1455–1462 [DOI] [PubMed] [Google Scholar]
- 2.Eberhard D, Bantleon HP, Steger W. Functional magnetic resonance imaging of temporomandibular joint disorders. Eur J Orthod 2000;22:489–497 [DOI] [PubMed] [Google Scholar]
- 3.Liu ZJ, Yamagata K, Kuroe K, Suenaga S, Noikura T, Ito G. Morphological and positional assessments of TMJ components and lateral pterygoid muscle in relation to symptoms and occlusion of patients with temporomandibular disorders. J Oral Rehabil 2000;27:860–874 [DOI] [PubMed] [Google Scholar]
- 4.Dorsay TA, Youngberg RA, Orr FE. Cine MRI diagnosis and posttherapeutic evaluation of an adherent TMJ disc: a case report. J Oral Maxillofac Surg 1994;52:1220–1222 [DOI] [PubMed] [Google Scholar]
- 5.Katzberg RW, Tallents RH. Normal and abnormal temporomandibular joint disc and posterior attachment as depicted by magnetic resonance imaging in symptomatic and asymptomatic subjects. J Oral Maxillofac Surg 2005;63:1155–1161 [DOI] [PubMed] [Google Scholar]
- 6.Seemann R, Czerny C, Schicho K, Undt G, Piehslinger E, Ewers R, et al. Pseudodynamic MRI differs from natural opening of the temporomandibular joint. Oral Surg Oral Med Oral Pathol Oral Radiol Endod 2008;105:371–378 [DOI] [PubMed] [Google Scholar]
- 7.Benbelaid R, Fleiter B, Zouaoui A, Gaudy JF. Proposed graphic system of evaluating disc-condyle displacement of the temporomandibular joint in MRI. Surg Radio Anat 2005;27:361–367 [DOI] [PubMed] [Google Scholar]
- 8.Benbelaid R, Fleiter B. Sensitivity and specificity of a new MRI method evaluating temporomandibular joint disc-condyle relationships: an in vivo study. Surg Radio Anat 2006;28:71–75 [DOI] [PubMed] [Google Scholar]
- 9.Iwasaki H. A cineradiographic study on functional diagnosis of the temporomandibular arthrosis. Dental Radiol 1982;22:51–81 [Google Scholar]
- 10.Bandai N, Sanada S, Ueki K, Funabasama S, Matsui T, Tuduki S. Kinetic radiography and functional analysis of the temporomandibular joint (TMJ). Nippon Hosyasen Gijutsu Gakkai Zasshi 2003;59:416–422 [DOI] [PubMed] [Google Scholar]
- 11.Iizuka T. Guideline for the treatment of temporomandibular joint arthrosis. In: Japanese Society for Temporomandibular Joint Temporomandibular arthrosis Tokyo: Nagasue,2003:8–14 [Google Scholar]
- 12.Stehling C, Vieth V, Bachmann R, Nassenstein I, Kugel H, Kooijman H, et al. High-resolution magnetic resonance imaging of the temporomandibular joint: image quality at 1.5 and 3.0 Tesla in volunteers. Invest Radiol 2007;42:428–434 [DOI] [PubMed] [Google Scholar]
- 13.ImageJ [homepageontheInternet] Bethesda, Maryland:National Institutes of Health; [updatedJul82009;citedJul92009] Available from http://rsb.info.nih.gov/ij/ [Google Scholar]
- 14.Katzberg RW, Westesson PL, Tallents RH, Anderson R, Kurita K, Manzione JV, Jr, et al. Temporomandibular joint: MR assessment of rotational and sideways disk displacements. Radiology 1988;169:741–748 [DOI] [PubMed] [Google Scholar]
- 15.Kuribayashi A, Okochi K, Kobayashi K, Kurabayashi T. MRI findings of temporomandibular joints with disc perforation. Oral Surg Oral Med Oral Pathol Oral Radiol Endod 2008;106:419–425 [DOI] [PubMed] [Google Scholar]
- 16.Nitzan DW, Etsion I. Adhesive force: The underlying cause of the disc anchorage to the fossa and/or eminence in the temporomandibular joint - A new concept. Int J Oral Maxillofac Surg 2002;31:94–99 [DOI] [PubMed] [Google Scholar]
- 17.Campos PSF, Sobrinho JBM, Crusoe-Rebello IMR, Pena N, Dantas JA, Mariz ACR, et al. Temporomandibular joint disc adhesion without mouth-opening limitation. J Oral Maxillofac Surg 2008;66:551–554 [DOI] [PubMed] [Google Scholar]