

Abstract
Objectives
An in vitro study was performed to investigate the relationship between grey levels in dental cone beam CT (CBCT) and Hounsfield units (HU) in CBCT scanners.
Methods
A phantom containing 8 different materials of known composition and density was imaged with 11 different dental CBCT scanners and 2 medical CT scanners. The phantom was scanned under three conditions: phantom alone and phantom in a small and large water container. The reconstructed data were exported as Digital Imaging and Communications in Medicine (DICOM) and analysed with On Demand 3D® by Cybermed, Seoul, Korea. The relationship between grey levels and linear attenuation coefficients was investigated.
Results
It was demonstrated that a linear relationship between the grey levels and the attenuation coefficients of each of the materials exists at some “effective” energy. From the linear regression equation of the reference materials, attenuation coefficients were obtained for each of the materials and CT numbers in HU were derived using the standard equation.
Conclusions
HU can be derived from the grey levels in dental CBCT scanners using linear attenuation coefficients as an intermediate step.
Keywords: Hounsfield units, cone beam computed tomography, grey levels
Introduction
Cone beam CT (CBCT) systems offer many advantages over medical CT for dental treatment and planning, including a lower radiation dose to the patient in most instances, shorter acquisition times for the resolution desired in dentistry, an affordable cost alternative to medical CT, better resolution and greater detail.1–9 The disadvantages associated with CBCT scanners are: increased scatter radiation, the limited dynamic range of X-ray area detectors, beam hardening artefacts and the inability to display actual Hounsfield units (HU) as in medical CT.10–14
For successful implant planning, it is important to be able to assess the bone quality in addition to the height and width of bone and the distance to other anatomical structures such as the mandibular canal or sinus region.21 HU provide a quantitative assessment of bone density as measured by its ability to attenuate an X-ray beam. The displayed grey levels in CBCT systems are arbitrary and do not allow for the assessment of bone quality, which can be performed with HU in medical CT.13
HU provide a standard scheme for scaling the reconstructed attenuation coefficients in medical CT systems. To date, the manufacturers of dental CBCT systems have not used a standard system for scaling the grey levels representing the reconstructed values. In the absence of such a system, it is difficult to interpret the grey levels or to compare the values resulting from different machines. A review of the literature has found that while there is an acknowledgment that a deficiency exists with CBCT systems, they do not correctly display HU, there has been little research conducted to correct this deficiency.
In a study by Katsumata et al,10 the authors found that calculated density (HU) on a CBCT scan varied widely from a range of −1500 to over +3000 for different types of bone. The researchers concluded that the ability to assess the density or quality of bone is limited and, in regions where it is clearly soft tissue, the HU vary greatly and provide little or no meaningful data. The researchers stated “The HU is the standard scale for the measurement of conventional CT values. Without HU, it can be difficult to analyse bone quality and to process and scan through two-dimensional (2D) and three-dimensional (3D) images using various standard DICOM software products with default settings for conventional CT images”.10
In a presentation by Armstrong3 entitled “Acceptability of cone beam CT vs. multi-detector CT for 3D anatomic model construction”, the author concluded that “Hounsfield units sampled from identical anatomic areas with CBCT and MDCT are not identical. Data from CBCT studies is difficult to threshold for anatomic model output since automatic thresholding algorithms are less successful. The result is generally reliance on more manual methods which can be more time consuming and subjective.”
Miles and Danforth16 concluded that CBCT grey levels are inaccurate to rely upon for decisions on implant placement: “Though CBVI machines also display gray scale units, they are not ‘true’ Hounsfield units. The values assigned to the voxels (volume elements) are relative HU and cannot be used as precisely to estimate bone density. In fact, there is no good data to relate HU to the quality of bone for a desired implant site, although clinicians place great faith in the HU in an attempt to determine whether or not their implant fixture will be placed in ‘good bone’.”
In the earlier article by Katsumata et al,10 the researchers criticize CBCT imaging for being unable to provide readouts in actual HU as the HU is the standard of measurement for conventional CT machines to analyse bone quality and process 2D and 3D images with the standard Digital Imaging and Communications in Medicine (DICOM) software, which has default settings for conventional CT imaging.
The current data on HU in CBCT volumes are limited; however, there appears to be some agreement that the grey levels displayed are not representative of HU as one would expect from a medical CT scan. However, little has been proposed or published on how to resolve this apparent discrepancy in HU between medical CT and CBCT data sets.
The purpose of this study was to investigate the relationship between grey levels and linear attenuation coefficients in CBCT systems in order to determine if HU can be calculated from the computed grey levels.
Materials and methods
Radiographic phantom
A radiographic phantom consisting of two detachable pieces was used for 3D imaging. This 3D dental phantom contains eight standard materials: air, adipose equivalent material, water equivalent material, polymethyl methacrylate (PMMA), muscle equivalent material, inner (cancellous) bone equivalent material, hard (cortical) bone equivalent material and aluminium alloy 1100. A series of epoxy resin-based tissue radiological substitutes simulating the five tissue equivalent substances (Gammex rmi®, Middleton, WI) was used in the construction of the phantom.
The top and bottom portions of the phantom are 50 mm in diameter and 50 mm in length (Figure 1). They are made of clear PMMA, a thermoplastic and transparent plastic sold by various manufacturers with and without tinting. Lucite® is one manufacturer's specific brand of clear acrylic plastic material, which was used to construct the 3D dental phantom. This material was obtained from McMaster-Carr (Atlanta, GA).
Figure 1.
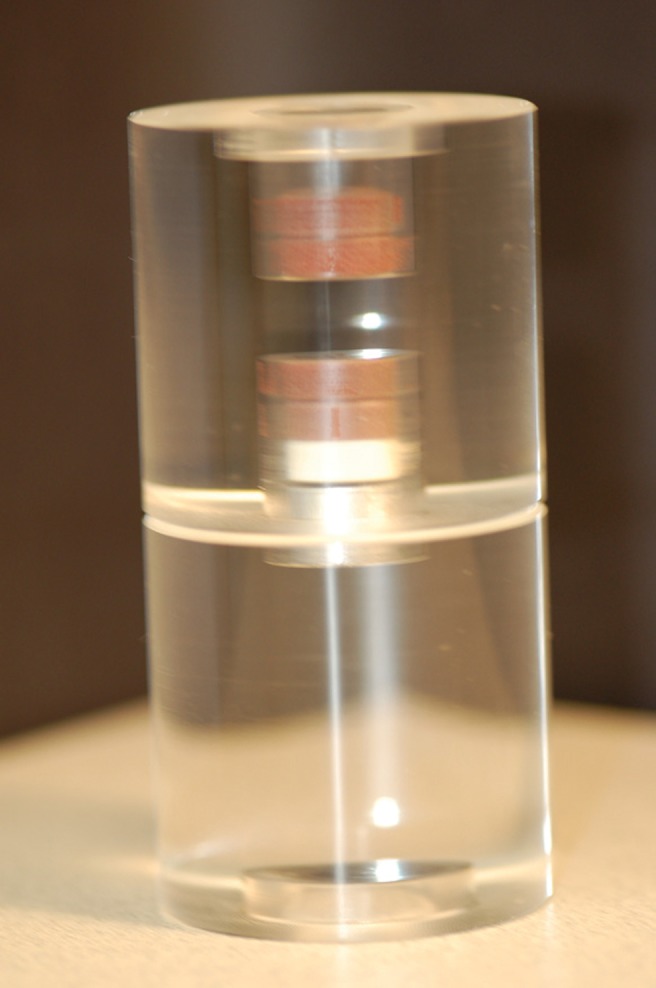
Three-dimensional eight-tissue radiographic phantom
The eight standard reference materials are placed in the centre of the round clear acrylic phantom along the vertical dimension of the 3D dental phantom in the following order: air, adipose equivalent material, water equivalent material, PMMA, muscle equivalent material, inner (cancellous) bone equivalent material, hard bone (cortical) equivalent material and an empty cavity in which the aluminium alloy 1100 material from the lower portion of the 3D dental phantom can be inserted. Each material compartment measures 5 mm in height and 14 mm in diameter except PMMA and the aluminium alloy 1100 materials, which are 10 mm in height. The next material is adipose equivalent material. This plasticized material, which measures 5 mm in height, is visually indistinguishable from the remainder of the radiological equivalent materials in the test phantom.
At the bottom of the lower portion of the 3D dental phantom is an empty air cavity measuring 5 mm in height and 20 mm in diameter.
Radiographic scans
The 3D dental phantom was scanned with each machine under three situations: the 3D dental phantom alone, the 3D dental phantom in a small container of distilled water to simulate a child's head and the 3D dental phantom in a large container of distilled water to simulate an adult's head. Placing an object in a container of water to provide some level of soft tissue equivalent attenuation has been used in other studies.17
A 2.2 l, 14 cm diameter watertight clear food container (Model 2025) was used to simulate a child's head and a 3.4 l, 16.9 cm diameter watertight clear food container (Model 2030) both made by Click Clack (Palmerston North, New Zealand) was used to simulate an adult's head.
The 3D dental phantom was placed in the centre of the water container, in each case with distilled water completely covering the 3D dental phantom and then placed in the centre of the field of view (FOV).
A scout was obtained of the phantom, and its position within the FOV was adjusted such that it was as closely centred within the FOV as possible. In each instance the acquired data set was reconstructed with the manufacturer's proprietary software and exported as a DICOM data set for analysis using third-party software to standardize the method of analysis.
Viewing software
The software used to analyse the DICOM data was On Demand 3D® version 1.0 (CyberMed International, Seoul, Korea). The manufacturer's software indicates that a rescaling process occurs with the data imported into the program with a grey level range of 0 to 4096 and these data are rescaled from −1024 to 3072.
Different versions of the 3D viewing software are marketed by CyberMed International. It is marketed as CB Works® with Hitachi MercuRay from Hitachi Medical Corporation, Kashiwa-Shi Chiba, Japan; Enlighten® with Planmeca Promax 3D from Planmeca Oy, Helsinki, Finland; IlumaVision® with Iluma from Imtec Corporation, Ardmore, OK and Accurex® to other users. The DICOM volumes of each scan were viewed in On Demand 3D® software with the 3D imaging mode.
The images were read on an IBM T43p laptop IBM, Armonk, NY with Intel Pentium® M processor 2.13 GHz using Microsoft Windows XP® Microsoft, Redmond, WA (5.1.2600) Service Pack 2 operating system.
For analysis, On Demand 3D® viewing software was used to obtain a mean grey level using the region of interest (ROI) tool in the images of each of the eight materials in the 3D test phantom. All ROI measurements were made in the sagittal view to provide consistency throughout. The images of each CBCT scan were captured using the image capture function in the On Demand 3D® software and exported into a Microsoft Word document for record keeping.
The mean grey level for each of the materials in the 3D dental phantom was recorded for the ROI within each of the eight materials as well as the standard deviation. In each instance, the ROI was selected in a central region within each of the test materials in the 3D phantom.
Attenuation coefficients
The mass attenuation coefficients used were derived from National Institute of Standards and Technology (NIST) tables of X-ray mass attenuation coefficients and mass energy absorption coefficients from 1 keV to 20 MeV for elements Z = 1–92 (NISTIR 5632 Version) from JH Hubbell and SM Seltzer of the Physics Laboratory NIST, Gaithersburg, MD. The data as supplied by NIST are tabulated from 1 keV to 20 MeV. It was necessary to interpolate the data in the range from 30 keV to 150 keV, which is found in dental CBCT X-ray machines.
The interpolated mass attenuation coefficients were derived using the NIST XCOM interpolation method for each chemical element on the NIST website. Mass attenuation coefficients are expressed in cm2/g.
The elemental compositions and specific gravities of the five epoxy resin-based tissue substitutes simulating adipose tissue, water, muscle and bone are shown in the table of tissue equivalent materials (Table 1).
Table 1. Gammex tissue equivalent materials.
| Material | Product number | Density (g ml−1) | % H | % C | % N | % O | % P | % Cl | % Ca | Total |
| Adipose | 453154351 | 0.940 | 9.06 | 72.30 | 2.25 | 16.27 | 0.13 | 100.01 | ||
| Inner bone | 453154361 | 1.147 | 6.67 | 55.64 | 1.96 | 23.52 | 3.23 | 0.11 | 8.86 | 99.99 |
| Solid water | 457154332 | 1.045 | 8.02 | 67.23 | 2.41 | 19.91 | 0.14 | 2.31 | 100.02 | |
| Muscle | 452154781 | 1.050 | 8.10 | 67.17 | 2.42 | 19.85 | 0.14 | 2.32 | 100.00 | |
| Hard bone | 450155041 | 1.825 | 3.41 | 31.41 | 1.84 | 36.5 | 0.04 | 26.81 | 100.01 |
The inner (cancellous) bone formula for elemental constituents and percentage weights was calculated with the average composition of a mixture of hard bone and red marrow found in trabecular bone structure and was based on the ratio of 22.4% bone to 77.6% soft tissue.16 It was noted that artificial bones made with this particular mixture needed only an outer (cortical) layer of hard bone substitute to simulate real bones on a macroscopic level. Since the time of the study by White,18 the formula for inner (cancellous) bone has changed slightly; however, the manufacturer, Gammex rmi®, claims it to be equivalent to that in the article in terms of attenuation of photon energy in the 0.01–100 MeV range.
The linear attenuation values were derived for each of the materials found in the 3D dental phantom using the elemental composition of the tissue equivalent radiographic materials from Gammex and their densities, as well as aluminium alloy 1100, PMMA and air for the energy range 30–120 keV. The references for the elemental composition of aluminium alloy 1100, PMMA and air were also obtained from the NIST website of X-Ray Mass Attenuation Coefficients for Materials.
This procedure was used to calculate the attenuation coefficient for each material at each energy level from 30 keV to 150 keV in steps of 1 keV. The units of expression for linear attenuation coefficients are reciprical centimetres.
Analysis
To study the relationship between grey levels and attenuation properties of the various materials in the 3D dental phantom, air was excluded and the grey levels of the remaining seven materials in the 3D dental phantom were plotted against the corresponding linear attenuation coefficients over the relevant range of photon energies.
CBCT and medical CT scanners
Data were obtained from 11 dental CBCT and 2 medical CT scanners in this study. The dental CBCT scanners included in this study were the Asahi Alphard 3030 from Belmont Takara, Kyoto, Japan; Hitachi CB MercuRay from Hitachi Medical Systems, Kashiwa-Shi, Chiba, Japan; the i-Cat Classic from Imaging Sciences International, Hatfield, PA; the i-Cat Next Generation from Imaging Sciences International, Hatfield, PA; Iluma from Imtec, Ardmore, OK; Morita Accuitomo FPD from J Morita Corporation, Kyoto, Japan; Morita Veraview Epochs from J Morita Corporation, Kyoto, Japan; NewTom VG from AFP Imaging Corporation, Verona, Italy; Planmeca ProMax 3D from Planmeca, Helsinki, Finland; Galileos from Sirona Dental, Bensheim Germany; and Scanora 3D from Soredex, Tuusula, Finland. In addition, the data of the two medical CT scanners, the Aquilon 64 slice CT (Toshiba, Toyko, Japan) and Briliance 64 CT (Philips, Andover, MA) are also shown in the tables.
Results
To demonstrate this procedure a CBCT scan from the Newtom VG scanner is used. The data from other CBCT scanners currently on the dental market are presented in table form only. Note that in Table 2 the grey levels resemble HU since they span a similar range. A careful examination, however, shows that the resemblance is only superficial since the water equivalent material has values that differ greatly from the zero value expected for water on the Hounsfield scale. Plotting linear attenuation coefficients against grey levels reveals an approximately linear relationship.
Table 2. Original grey levels for three-dimensional (3D) eight-tissue phantom using the NewTom VG.
| Air | Adipose equivalent | Water equivalent | PMMA | Muscle equivalent | Inner bone equivalent | Outer bone equivalent | Aluminium alloy 1100 | |
| Newtom VG 3D dental phantom only | ||||||||
| 110 kV, 1.0 mA, patient mode | −839.5 | −620.4 | −461.7 | −367.7 | −419.1 | −129.5 | 1495.8 | 2430.2 |
| Newtom VG 3D dental phantom in small water container | ||||||||
| 110 kV, 1.0 mA, patient mode | −818.0 | −286.5 | −168.7 | −107.2 | −142.5 | 38.3 | 959.9 | 1521.1 |
| Newtom VG 3D dental phantom in large water container | ||||||||
| 110 kV, 1.0 mA, patient mode | −298.6 | 110.9 | 207.2 | 264.6 | 248.9 | 365.7 | 1002.7 | 1380.7 |
Consequently, a linear regression was performed for each energy in the relevant range until the best linear fit was obtained. With increasing energy, the R2 value climbs to a maximum at some particular energy and then decreases as the energy continues to rise (see Figure 2). It seems logical to select the energy resulting in the best linear fit as the “effective energy” of the beam. Figure 3 shows the best fit at the selected effective energy, which in this case is 63 keV.
Figure 2.

NewTom VG three-dimensional dental phantom only, 110 kVp 1.0 mA, 63 effective keV using seven reference materials. ♦, Series 1
Figure 3.
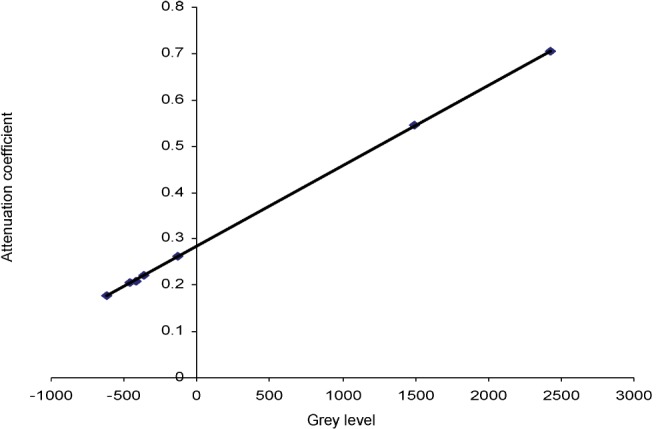
NewTom VG three-dimensional dental phantom only, 110 kVp 1.0 mA, 63 effective keV using seven reference materials. y = 0.0001734x + 0.2844124; R2 = 0.9999033
Given the linearity between the attenuation coefficients and the grey levels, the linear regression equation provides a convenient means of transforming all the grey levels into linear attenuation coefficients and subsequently into CT numbers or HU using the standard definition:
Table 3 shows the attenuation coefficients and Hounsfield numbers at 63 keV for each of the materials in the 3D dental phantom as well as the attenuation coefficients and Hounsfield numbers calculated from the grey levels given by the NewTom VG CBCT. The errors for each material are expressed as the percentage of the entire scale (air to aluminium alloy). For comparison, the original grey levels are once again shown.
Table 3. NewTom VG eight-tissue phantom-only Hounsfield unit HU calculations using seven reference materials.
| Grey level | Attenuation coefficient | Actual HU | Calculated coefficient | Calculated HU | % Difference | ||
| 110 kV, 1.0 mA | Aluminium | 2430.2 | 0.705 | 2500.2 | 0.705774163 | 2505.6 | −0.15 |
| Patient mode | Outer bone equivalent | 1495.8 | 0.545 | 1709.4 | 0.543762615 | 1700.9 | 0.24 |
| 63 effective keV | Inner bone equivalent | −129.5 | 0.262 | 299.8 | 0.261958924 | 301.1 | −0.04 |
| PMMA | −367.7 | 0.222 | 103.4 | 0.220658463 | 96.0 | 0.21 | |
| Muscle equivalent | −419.1 | 0.208 | 31.8 | 0.211746441 | 51.7 | −0.57 | |
| Water equivalent | −461.7 | 0.206 | 21.0 | 0.204360212 | 15.1 | 0.17 | |
| Adipose equivalent | −620.4 | 0.178 | −117.0 | 0.176843910 | −121.6 | 0.13 | |
| Air | −839.5 | 0.000 | −998.9 | 0.138855115 | −310.3 | −19.68 |
PMMA, polymethyl methacrylate
The applicability of the present method to the data acquired from all the machines and technique factors was verified. A regression calculation was carried out using the seven reference materials in the 3D dental phantom for each CBCT acquisition on the various CBCT machines under the various conditions of 3D dental phantom alone and 3D dental phantom in a small and large water container. It was seen from the R2 values that in every case it was possible to achieve a satisfactory linear fit at some effective energy and to perform the subsequent scaling into Hounsfield numbers.
Application to clinical practice
A practical clinical situation may not permit the use of a phantom with seven or eight individual reference materials. It was therefore decided to determine if a satisfactory regression equation could be determined by utilizing only three of the materials in the 3D dental Phantom. Aluminium alloy, PMMA and water equivalent material were chosen for this purpose since they are inexpensive and their physical properties are easily characterized.
Figure 4 shows the R2 values at various energies using the three materials. A similar shaped curve is obtained using only three reference materials as with using the seven materials in the 3D dental phantom. Here, the effective energy selected was 63 keV, which is the same keV energy chosen when seven reference materials in the 3D dental phantom were used.
Figure 4.

NewTom VG 3D dental phantom only, 110 kVp, 1.0 mA, 63 effective keV using three reference materials. ♦, Series 1
Figure 5 shows the linear fit for the attenuation coefficients for the three reference materials: aluminium alloy, PMMA and water equivalent material.
Figure 5.
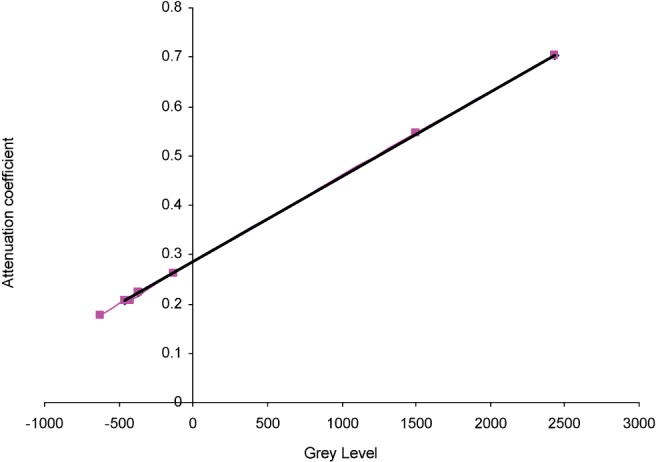
NewTom VG 3D dental phantom only 110 kVp, 1.0 mA, 63 effective keV using three reference materials. y = 0.0001725x + 0.2854034; R2 = 0.9999996
A sample calculation is illustrated with the data from the NewTom VG CBCT scanner (Table 4).
Table 4. Hounsfield units (HU) using three reference materials for NewTom VG 8 tissue phantom only.
| Grey level | Attenuation coefficient | Actual HU | Calculated coefficient | Calculated HU | % Difference | ||
| 110 kV, 1.0 mA | Aluminium | 2430.2 | 0.705 | 2500.2 | 0.704706087 | 2500.3 | 0.00 |
| Patient mode | Outer bone equivalent | 1495.8 | 0.545 | 1709.4 | 0.543486241 | 1699.5 | 0.28 |
| 63 effective keV | Inner bone equivalent | −129.5 | 0.262 | 299.8 | 0.26305964 | 306.6 | −0.19 |
| PMMA | −367.7 | 0.222 | 103.4 | 0.221961002 | 102.5 | 0.03 | |
| Muscle equivalent | −419.1 | 0.208 | 31.8 | 0.21309253 | 58.4 | −0.76 | |
| Water equivalent | −461.7 | 0.206 | 21.0 | 0.205742396 | 21.9 | −0.03 | |
| Adipose equivalent | −620.4 | 0.178 | −117.0 | 0.178360557 | −114.1 | −0.08 | |
| Air | −839.5 | 0.000 | −998.9 | 0.140557402 | −301.9 | −19.92 |
PMMA, polymethyl methacrylate
Tables 5 and 6 show the predicted Hounsfield numbers for each situation in small and large water containers at the selected effective energy and the Hounsfield numbers predicted from the grey levels.
Table 5. Hounsfield units (HU) using three reference materials for NewTom VG eight-tissue phantom in small water container.
| Grey level | Attenuation coefficient | Actual HU | Calculated coefficient | Calculated HU | % Difference | ||
| 110 kV, 1.0 mA | Aluminium | 1521.1 | 0.678 | 2413.2 | 0.677702469 | 2413.2 | 0.00 |
| Patient mode | Outer bone equivalent | 959.9 | 0.523 | 1633.1 | 0.519883298 | 1618.3 | 0.43 |
| 65 effective keV | Inner bone equivalent | 38.3 | 0.255 | 284.0 | 0.260713397 | 313.1 | −0.85 |
| PMMA | −107.2 | 0.220 | 107.3 | 0.219796274 | 107.0 | 0.01 | |
| Muscle equivalent | −142.5 | 0.205 | 30.4 | 0.209869302 | 57.0 | −0.78 | |
| Water equivalent | −168.7 | 0.202 | 19.6 | 0.202501408 | 19.9 | −0.01 | |
| Adipose equivalent | −286.5 | 0.176 | −114.5 | 0.169374005 | −147.0 | 0.95 | |
| Air | −818 | 0.000 | −998.9 | 0.019906989 | −899.7 | −2.91 |
PMMA, polymethyl methacrylate
Table 6. Hounsfield units (HU) using three reference materials for NewTom VG eight-tissue phantom in a large water container.
| Grey level | Attenuation coefficient | Actual HU | Calculated coefficient | Calculated HU | % Difference | ||
| 110 kV, 1.0 mA | Aluminium | 1380.7 | 0.594 | 2400.8 | 0.593997845 | 2400.8 | 0.00 |
| Patient mode | Outer bone equivalent | 1002.7 | 0.454 | 1602.0 | 0.464721962 | 1660.6 | −1.72 |
| 73 effective keV | Inner bone equivalent | 365.7 | 0.234 | 341.2 | 0.246868161 | 413.4 | −2.12 |
| PMMA | 264.6 | 0.212 | 215.2 | 0.212291992 | 215.4 | −0.01 | |
| Muscle equivalent | 248.9 | 0.195 | 115.0 | 0.206922597 | 184.7 | −2.05 | |
| Water equivalent | 207.2 | 0.193 | 103.3 | 0.19266121 | 103.0 | 0.01 | |
| Adipose equivalent | 110.9 | 0.170 | −29.4 | 0.15972664 | −85.5 | 1.65 | |
| Air | −298.6 | 0.000 | −998.7 | 0.019677768 | −887.3 | −3.28 |
PMMA, polymethyl methacrylate
The sample calculations were performed at 110 kVp and 1.0 mA using the patient mode but the same general principles would apply for any CBCT scan. The calculations for the NewTom VG CBCT scanner using the denture mode would be the same, and since other CBCT scanners did not use a denture mode the results were only analysed for the patient mode.
This method was applied for each CBCT volume using all the available technique factors on all of the CBCT machines under the conditions of phantom only, phantom in a small water container and phantom in a large water container. Results from the other dental CBCT scanners included in this study using three reference materials are shown in Tables 7-9. In situations where the calculated attenuation coefficient for air was a negative value, the attenuation coefficient was adjusted to a value of zero since it is impossible to have a negative attenuation coefficient.
Table 7. Comparison of derived Hounsfield unit (HU) three-dimensional phantom only with cone beam CT (CBCT) scanners.
| Asahi Alphard 3030 80 kV 5 mA | Hitachi CB MercuRay 120 kV 10 mA | Imaging Sciences i-Cat 120 kV 10s, 12 mA 0.4 mm voxel | Imaging Sciences i-Cat Next Generation 120 kV 5 mA | Imtec Iluma 120 kV 3.8 mA 0.3 mm voxel | Morita Accuitomo FPD 60 kV 9 mA | Morita Veraview Epochs 70 kV 3 mA | NewTom VG 110 kV 1 mA | Planmeca ProMax 3D 82 kV 10 mA | Sirona Galileos 85 kV 35 mAs | Soredex Scanora 3D 85 kV 15 mA | Philips Briliance 64 CT 120 kV 300 mA | Toshiba Aquilion CT 120 kV 300 mA | |
| Original grey levels | |||||||||||||
| Aluminium | 2864 | 1453.6 | 3913.3 | 862.9 | 2138.5 | 2408.8 | 2335.2 | 2402 | 1751.7 | 1958.9 | 1288 | 2178 | 2595.4 |
| Outer bone equivalent | 2425.4 | 1001.8 | 2698.3 | 363.4 | 1324 | 1660.4 | 1733.1 | 1389.2 | 1165.8 | 1504.9 | 897.2 | 1212.6 | 1698.9 |
| Inner bone equivalent | 723.5 | 148.4 | 868.7 | −374.5 | 217.9 | −66.5 | 403 | −86.5 | −86 | 657.6 | 98.5 | 257.7 | 328.2 |
| PMMA | 213.3 | −40.2 | 587.7 | −489 | 96.6 | −511 | 49 | −362.1 | −368.2 | 522.2 | −72.5 | 123.9 | 126.5 |
| Muscle equivalent | 185.5 | −81.9 | 477.8 | −527.2 | 12.3 | −498.3 | 45.8 | −404.8 | −380.9 | 479.3 | −101.5 | 8.7 | 40.2 |
| Water equivalent | 161.5 | −115.2 | 462 | −533.3 | 6.2 | −515.8 | 27.7 | −456.7 | −394.2 | 464.6 | −144.1 | 26.6 | 48 |
| Adipose equivalent | −89.1 | −239.2 | 242.8 | −611.6 | −123.6 | −701.8 | −147.1 | −643.9 | −532.5 | 362.6 | −266.7 | −115.2 | −120.5 |
| Air | −991.9 | −906.1 | −979.7 | −1000.5 | −957.8 | −999.5 | −723.6 | −839.5 | −840.4 | −32.3 | −746.3 | −805.5 | −1073.1 |
| Corrected HU | |||||||||||||
| Aluminium | 2962.1 | 2436.0 | 2413.2 | 2534.1 | 2262.3 | 3960.4 | 3381.7 | 2500.2 | 3285.3 | 2402.9 | 2103.6 | 2197.8 | 2534.2 |
| Outer bone equivalent | 2441.3 | 1735.4 | 1570.6 | 1633.3 | 1405.4 | 2955.7 | 2507.2 | 1621.9 | 2395.9 | 1677.2 | 1534.4 | 1220.4 | 1648.4 |
| Inner bone equivalent | 616.8 | 411.8 | 301.9 | 302.5 | 241.6 | 637.3 | 575.3 | 342.2 | 495.7 | 322.8 | 371.0 | 253.7 | 294.1 |
| PMMA | 69.9 | 119.3 | 107.0 | 96.0 | 114.0 | 40.6 | 61.1 | 103.2 | 67.3 | 106.3 | 121.9 | 118.2 | 94.8 |
| Muscle equivalent | 40.1 | 54.6 | 30.8 | 27.1 | 25.3 | 57.6 | 56.5 | 66.2 | 48.1 | 37.8 | 79.7 | 1.6 | 9.6 |
| Water equivalent | 14.3 | 3.0 | 19.9 | 16.1 | 18.9 | 34.2 | 30.2 | 21.2 | 27.9 | 14.3 | 17.6 | 19.7 | 17.3 |
| Adipose equivalent | −254.3 | −189.3 | −132.2 | −125.1 | −117.7 | −215.5 | −223.7 | −141.1 | −182.1 | −148.8 | −161.0 | −123.8 | −149.2 |
| Air | −998.9 | −998.9 | −979.9 | −826.4 | −995.4 | −615.2 | −1061.1 | −310.8 | −649.4 | −780.0 | −859.6 | −822.7 | −1090.4 |
3D, three dimensional; PMMA, polymethyl methacrylate
Table 9. Comparison of derived Hounsfield unit (HU) phantom in large water container with cone beam CT (CBCT) scanners.
| Asahi Alphard 3030 80 kV 5 mA | Hitachi CB MercuRay 120 kV 10 mA | Imaging Sciences i-Cat 120 kV 10s, 12 mA 0.4 mm voxel | Imaging Sciences i-Cat Next Generation 120 kV 5 mA | Imtec Iluma 120 kV 3.8 mA 0.3 mm voxel | Morita Accuitomo FPD 70 kV 7 mA | Morita Veraview Epochs 80 kV 9 mA | NewTom VG 110 kV 1 mA | Planmeca ProMax 3D 82 kV 10 mA | Sirona Galileos 85 kV 35 mAs | Soredex Scanora 3D 85 kV 15 mA | Philips Briliance 64 CT 120 kV 300 mA | Toshiba Aquilion CT 120 kV 300 mA | |
| Original grey levels | |||||||||||||
| Aluminium | 1015.7 | 197 | 639.2 | 226.8 | 1241.1 | 2129.5 | 2213.4 | 1380.7 | 750.8 | 1068.2 | 1291.6 | 2294 | 2368.3 |
| Outer bone equivalent | 705.3 | −19.6 | 374.8 | −54.7 | 789.8 | 1655.9 | 1713.5 | 1002.7 | 465 | 829.9 | 896.4 | 1452.4 | 1463.7 |
| Inner bone equivalent | 75.4 | −443.1 | −31.7 | −520.6 | 64.4 | 85.8 | 525.3 | 365.7 | −84.3 | 413.3 | 92 | 275 | 311.1 |
| PMMA | −95.4 | −491.4 | −106.6 | −598.3 | −28.3 | −339.6 | 200.4 | 264.6 | −224.5 | 329.5 | −72.3 | 136.7 | 139.4 |
| Muscle equivalent | −97.8 | −547.6 | −122.2 | −621.9 | −80.3 | −394.4 | 166 | 248.9 | −253 | 316.4 | −110.2 | 19.2 | 67.8 |
| Water equivalent | −125.8 | −518 | −134 | −625 | −112.9 | −409.1 | 142 | 207.2 | −250.8 | 315.4 | −157.4 | 30.8 | 39.8 |
| Adipose equivalent | −207.6 | −597.4 | −232.1 | −694.1 | −208.9 | −608.5 | −23.8 | 110.9 | −318.3 | 244.9 | −267 | −103.5 | −106.9 |
| Air | −617.3 | −963.5 | −662.4 | −1000.4 | −890.7 | −999.5 | −836.7 | −298.6 | −642.6 | −59.6 | −756.9 | −979.2 | −1025.6 |
| Corrected HU | |||||||||||||
| Aluminium | 2702.5 | 2827.4 | 2436.8 | 2534.1 | 2155.0 | 2702.4 | 2641.8 | 2400.8 | 2702.5 | 2953.6 | 1954.4 | 2197.9 | 2262.3 |
| Outer bone equivalent | 1973.7 | 1971.7 | 1609.7 | 1702.2 | 1437.1 | 2202.3 | 2008.9 | 1660.6 | 1937.9 | 2026.9 | 1424.7 | 1390.4 | 1390.6 |
| Inner bone equivalent | 494.8 | 298.6 | 338.0 | 325.2 | 283.2 | 544.1 | 504.6 | 413.4 | 468.3 | 406.6 | 346.5 | 260.6 | 279.9 |
| PMMA | 93.8 | 107.8 | 103.6 | 95.5 | 135.7 | 94.8 | 93.3 | 215.4 | 93.3 | 80.7 | 126.3 | 127.9 | 114.4 |
| Muscle equivalent | 88.1 | −114.2 | 54.8 | 25.8 | 53.0 | 36.9 | 49.7 | 184.7 | 17.0 | 29.8 | 75.5 | 15.1 | 45.4 |
| Water equivalent | 22.4 | 2.7 | 17.9 | 16.6 | 1.1 | 21.4 | 19.3 | 103.0 | 22.9 | 25.9 | 12.2 | 26.3 | 18.5 |
| Adipose equivalent | −169.7 | −310.9 | −289.0 | −187.6 | −151.6 | −189.2 | −190.6 | −85.5 | −157.7 | −248.3 | −134.7 | −102.6 | −122.9 |
| Air | −1000.0 | −998.9 | −1000.0 | −998.9 | −998.9 | −1000.0 | −1219.8 | −1000.0 | −1000.0 | −1000.0 | −791.3 | −942.9 | −1008.2 |
Discussion
Significance of this study
The present study illustrates a comprehensive method whereby HU can be derived from the grey levels of any CBCT machine possessing sufficient linearity. Overall, the corrected Hounsfield numbers in each of the CBCT acquisitions appear to be within a few per cent of the predicted HU obtained by inserting the attenuation coefficient for each material into Equation (1) at the effective energy derived by the linear regression of the three reference materials (aluminium alloy, PMMA and water equivalent material). In most cases, the difference between the predicted or actual HU and the corrected or calculated HU was very small. When the difference between the actual HU and calculated HU was large, it generally occurred for the value of air, a material which was excluded from the curve fit.
After a correction has been applied to the grey levels with the CBCT data, the HU values are much similar to those one would expect in a medical CT device than to the original grey levels obtained from the CBCT scanner.
Although there still exists some differences in the rescaled HU values, owing to differences in kilovoltage and filtration, they do provide a much more meaningful result than the original CBCT grey levels. Furthermore, rescaling of the grey levels in the CBCT to derive corrected HU allows the comparison of densities of materials from different CBCT machines, which would otherwise not be possible.
The ability to derive HU from grey levels opens new opportunities to use fully all the information garnered in a CBCT scan. Currently most computer monitors are unable to display all the grey levels in a 12 or 14 bit information set and as a result interpolation occurs with a loss of information. This is problematic when the viewer is relying upon the visualized grey levels on the computer monitor to perform windowing and level functions and masking as in the case of 2D and 3D renderings for stereolithography and production of surgical guides. The operator may be removing the thin bony aspects of an image not displayed correctly on the image screen if the windowing and thresholding function is based on the displayed image on a computer monitor. An incorrect thresholding by simple visual adjustment may lead to an assumption of more bone than actually exists. The ability to remove the visualization aspect from the thresholding function can be enormous. Human eyesight is variable and subject to a host of factors, including lighting conditions, rest, eyesight and other issues.
If the thresholding function could be performed using the corrected HU, then there would be minimal or no loss of information and one would expect to see more accurate stereolithographic models and surgical guides than presently. This may lead to a better fitting surgical stent or more accurate stereolithographic model produced from the 3D rendering. Often stereolithographic models are produced for complex surgical procedures to minimize surgery times and improve patient outcomes. Even if 2D or 3D rendering is used for illustrative purposes, it would provide a more accurate representation of the imaged object.
Another benefit of a corrected HU is with implant site selection. A proper assessment of implant site selection involves evaluating the quality of bone at the site. HU can provide a measure of the bone density at an implant site. One possible outcome of this study is to evaluate variations of the bone density in designated endosseous implant sites using CBCT imaging and Hounsfield numbers.
Some studies have found that the variable quality of bone is more important to treatment outcome than the quantity of bone in the region of a dental implant.19 A corrected HU in CBCT data is useful for determining the bone density of ROI prior to implant placement, and this valuable information about bone quality enables better treatment planning by dental practitioners regarding implant positions.
CT data have often been relied upon for implant site selection as it has been found to be reliable as a non-invasive indicator of bone quality. Many other methods of bone quality determination have been tried with limited success; however, a CT scan with HU has been the standard which most dental practitioners have relied upon. With a corrected HU in CBCT, this role of providing reliable assessment of bone quality can be performed with CBCT scanners. CBCT has much to offer in terms of oral-maxillofacial imaging for bone quality assessment for dental implants as the radiation dose delivered to a patient by CBCT imaging is a fraction of that delivered by a comparable medical CT scan. Other benefits are the affordability of a CBCT scan vs a medical CT, accessibility to CBCT is much easier for patients than conventional CT, which are typically located in hospitals and CBCT offers much greater detail in terms of image quality than dental practitioners demand.
A corrected HU can also aid in the determination of the volume of cortical bone available for dental implants. Current CBCT software allows the user to measure quantitatively the bone height but the volume of cortical bone available is not readily accessible. In order to assess the volume of bone in the ROI, the boundary between the cortical bone and other structures must be delineated. This can be accomplished using HU that are based on the attenuation of X-ray beam and expressed as grey levels.
Further, a corrected HU can be used to assess the success of a bone graft in a region prior to implant placement. This is beneficial as there are no other non-invasive methods currently available to determine the success or failure of a bone graft. Other techniques such as ultrasound are being investigated, but they do not provide the same amount of information as a CBCT scan.
A single CBCT in the ROI has a higher diagnostic yield than any other implant assessment technique at present. Currently, a CBCT scan provides information on the bone height, presence of any foreign materials, surrounding anatomy such as the inferior alveolar nerve or maxillary sinus, direction of implant placement and other surgical planning decisions such as buccal or lingual approach as well as possibly an extraoral approach. In addition to the current diagnostic information that is available from a CBCT acquisition, a corrected HU would be able to provide additional information on the type of bone in the area, the success of a previous bone graft and the volume of bone in the region, all without increasing patient radiation dose. With an increased diagnostic yield from a single CBCT scan, there will be better patient and clinician acceptance of this new CBCT technology. It offers an affordable and increasingly valuable diagnostic tool not only in dental implant placements but also in other dental procedures.
A corrected HU may also be a useful aid in the diagnosis of a potential pathological lesion. The corrected HU can be used to differentiate between a fluid-filled cavity and an air cavity. As it currently stands, the grey levels from the CBCT data set cannot be relied upon to make this determination. Through this process of correcting the grey levels in CBCT scans, a greater amount of information can be extracted from the acquired data.
A corrected HU may also be beneficial in airway assessment to determine the boundaries of the airway and thus obtain a more accurate airway volume as well as determine areas of potential constriction in the airway and the level of constriction.
Limitations of the present study
When the HU values for all the materials in the phantom were determined, it was noted that the values corresponding to common materials were somewhat different from those commonly encountered in medical CT systems. This is to be expected because of the significantly lower effective energy (typically 50 keV) of dental CBCT machines than medical CT machines (typically 70 keV).
The results obtained in this study were obtained in an ideal situation in which the location, size of each material in the 3D dental phantom and the subsequent size ROI to sample were known. However, if the size and location of a material of interest is unknown or if the boundary between different structures is not well differentiated, then how would a ROI be selected and what size of ROI should be used? These are questions that need further investigation.
The results of this study are based upon the information supplied by Gammex rmi® with regards to the density and composition of each of the tissue equivalent materials. If an error exists in these data, it may result in inaccuracies.
The mass attenuation coefficients were interpolated using Form X on the NIST website to obtain the mass attenuation values for each of the elements; however, there is an error factor in this interpolation, as described on the website. Consequently, the mass attenuation values for each element used in calculating the attenuation coefficients are subject to a degree of uncertainty because of this factor.
One assumption of this study is that the photon beam in CBCT machines obeys the laws of narrow beam attenuation. However, we know that CBCT machines operate with an area detector which is not collimated like fan beam medical CT. The increased scatter which results may compromise the accuracy of the present method, although we have shown that satisfactory curve fits can be obtained using narrow beam coefficients.
In this study and most other radiographic studies, to simplify and make the mathematical computations more manageable, a single monochromatic energy level was derived for each CBCT acquisition. The linear attenuation coefficients for each material at the selected effective energy were then used to calculate the Hounsfield number. However, this ignores the fact the X-ray beams are polychromatic in nature and accordingly introduce a potential source of error.
Since each X-ray beam contains a spectrum of energies, the phenomenon called beam hardening occurs as a result of preferential absorption of the lower energy X-rays by the material being scanned. This shifts the relative energy distribution of the X-rays traversing the material to higher energies than that of the incident beam. This causes an artefact in the resulting image called “cupping”. Cupping is a tendency for the image of a homogeneous material to show decreased apparent density as the X-ray beam passes through a thicker portion of the uniform cylindrical 3D dental phantom.20 This effect is generally not corrected in CBCT machines. Inaccuracies in the grey level values resulting from uncorrected beam hardening are unavoidably passed along to the transformed values.
At low kV and mA settings on CBCT machines, quantum noise may be sufficient to interfere with estimation of the actual grey level. This would contribute to possible inaccuracies in the calculation of HU from the resulting grey levels. It was found that at low dose levels the noise was significant enough that the image was degraded to a point where demarcation between the various reference materials was not detectable and as a result the investigator could not obtain a grey level value.
It is possible that the three reference standards (aluminium alloy 1100, PMMA and water equivalent material) were not the best reference standards for establishing a linear fit. This would create a source of error or uncertainty in the resulting calculations. It may be advantageous to choose three reference materials with attenuation values that are more spread out, because PMMA and water equivalent material have very similar attenuation values. Having a more diverse group of attenuation coefficients might possibly result in a more refined selection of effective energy for each CBCT acquisition and linear regression equation and thus a more precisely “corrected” HU.
It should also be noted that the materials imaged presented with homogeneous densities whereas physiological structures in a patient such as trabecular bone and soft tissue do not. The physiological make-up of the patient in a clinical situation has not been replicated, so there may be a certain degree of scatter radiation that is not accounted for in this study. Further, this study did not involve metal streak artefacts, which may be caused in clinical situations by metallic restorations, dental implants, surgical hardware, orthodontic hardware, jewellery and others.
Another potential source of error may be the ROI used to determine the grey level for each of the materials within the 3D dental phantom. As much as possible, the central core portion of each material in the 3D dental phantom was used to determine the grey level; however, because of geometric differences in CBCT machines the size of the ROI was not consistent from one CBCT machine to another. To maintain a level of consistency, a consistent sample size was used for the area in the ROI for any particular CBCT machine under all three conditions—phantom alone, phantom in small water container, phantom in large water container—and always in the sagittal plane.
It is nearly impossible to eliminate the human error factor in selection of the ROI in which the data are analysed. Inherent in the selection of a representative ROI for analysis, the investigator must select a site on a 2D screen depiction of a 3D object.
Extension of the present methodology to clinical situations
The results obtained in this study are encouraging but need to be replicated in a clinical situation to determine the accuracy and to evaluate potential shortcomings of this technique in clinical situations. For this purpose, a small intraoral radiology phantom containing as few as three reference tissue-mimicking materials can be used since we have demonstrated that corrected HU can be derived using three reference standard materials: aluminium, PMMA and water equivalent materials.
Such a study is presently being conducted by the investigators to demonstrate the applicability of this method to derive HU in patients on multiple CBCT scanners. The Institutional Review Board at our institution has granted human studies approval under IRB Protocol #HSC20090033H. If this clinical study is successful, the proposed methodology should make it possible to better use the data contained within a CBCT acquisition. This should aid in implant site selection, diagnosis of pathology and the assessment of bone graft procedures.
In conclusion this study presented a method to convert grey levels in CBCT imaging into meaningful HU. The process was demonstrated with several CBCT scanners available on the dental market and the results were as accurate as those with medical CT HU.
Further, this study has demonstrated that corrected HU can be derived for each CBCT acquisition regardless of the CBCT unit used to acquire the acquisition and furthermore allow for a relative comparison of data obtained on 12 different CBCT scanners in terms of densities. Although there is no exact figure that can be attributed to a particular type of material, there is a range of values within which one would expect to find a certain type of material. In this sense, this is exactly what the HU scale purports to do with different CT machines.
Further, this study has validated the process of converting grey levels to HU with several CBCT scanners as well as conventional CT. There is no reason to think that this method cannot be applied to laboratory research CT machines such as a micro-CT unit, which operates at energy levels outside of the normal kVp range of medical CT scanners.
Conversion factors can be determined for any given CBCT machine to derive an attenuation coefficient by using reference materials with known chemical compositions and density (specific gravity). Establishment of meaningful HU for CBCT will open new possibilities for clinicians in implant planning, diagnosis, surgical interventions, treatment planning, 2D and 3D reconstruction of images.
As CBCT scanning improves with developments, such as this method to convert grey levels to HU, it may serve as the impetus to push for more 3D imaging with other dental procedures. The result will be better patient outcomes and acceptance in implant dentistry, cosmetic reconstruction, complex surgical procedures and other dental treatments.
Table 8. Comparison of derived Hounsfield unit (HU) phantom in small water container with cone beam CT (CBCT) scanners.
| Asahi Alphard 3030 80 kV 5 mA | Hitachi CB MercuRay 120 kV 10 mA | Imaging Sciences i-Cat 120 kV 10s, 12 mA 0.4 mm voxel | Imaging Sciences i-Cat Next Generation 120 kV 5 mA | Imtec Iluma 120 kV 3.8 mA 0.3 mm voxel | Morita Accuitomo FPD 70 kV 7 mA | Morita Veraview Epochs 80 kV 5 mA | NewTom VG 110 kV 1 mA | Planmeca ProMax 3D 82 kV 10 mA | Sirona Galileos 85 kV 35 mAs | Soredex Scanora 3D 85 kV 15 mA | Philips Briliance 64 CT 120 kV 300 mA | Toshiba Aquilion CT 120 kV 300 mA | |
| Original grey levels | |||||||||||||
| Aluminium | 1595.7 | 565.6 | 2134.4 | 215.1 | 1713.7 | 2255.6 | 2342.5 | 1525.7 | 922.5 | 1053.9 | 1672 | 2339 | 2409.1 |
| Outer bone equivalent | 1167.4 | 377.9 | 1371.9 | −99.4 | 1111.4 | 1514.3 | 1750.5 | 972.7 | 537.6 | 819.8 | 1127 | 1479.5 | 1492.3 |
| Inner bone equivalent | 216.5 | −165.2 | 255.2 | −517.7 | 192.1 | −178.6 | 490.7 | 63.3 | 152.5 | 386.6 | 184 | 252 | 310.1 |
| PMMA | −27 | −245.8 | 63.5 | −597.6 | 64.7 | −538.5 | 120 | −110.1 | −300.2 | 342.4 | −49 | 130 | 139.9 |
| Muscle equivalent | −32 | −286.5 | −4.6 | −625 | −1.4 | −590.1 | 119.5 | −154.6 | −320 | 328.9 | −58.4 | 15.7 | 61.4 |
| Water equivalent | 56.9 | −310.3 | −26.9 | −637.9 | −19.6 | −593.6 | 74.1 | −171.4 | −323.5 | 310.1 | −96 | 33.7 | 41.7 |
| Adipose equivalent | −159.7 | −403.6 | −169.8 | −699.5 | −145.2 | −775.7 | −96.9 | −280.5 | −395.9 | 251.2 | −214.7 | −97.1 | −106.6 |
| Air | −707.7 | −852.5 | −995.1 | −999.7 | −956.7 | −999.5 | −918.6 | −818 | −771.7 | −52.7 | −801.7 | −1009.1 | −1025 |
| Corrected HU | |||||||||||||
| Aluminium | 3017.7 | 1868.8 | 2301.0 | 2156.0 | 2130.0 | 2962.1 | 2962.1 | 2366.1 | 2953.6 | 2223.2 | 2636.2 | 2301.0 | 2499.8 |
| Outer bone equivalent | 2214.4 | 1469.8 | 1496.2 | 1367.5 | 1395.2 | 2157.7 | 2195.8 | 1597.1 | 2049.2 | 1529.0 | 1824.8 | 1450.6 | 1535.9 |
| Inner bone equivalent | 431.0 | 315.3 | 317.6 | 318.7 | 273.7 | 436.1 | 565.1 | 332.5 | 1144.4 | 244.3 | 421.0 | 236.0 | 293 |
| PMMA | −25.6 | 144.0 | 115.3 | 118.4 | 118.3 | 70.1 | 85.3 | 91.4 | 80.7 | 113.2 | 74.1 | 115.2 | 114.1 |
| Muscle equivalent | −35.0 | 57.5 | 43.4 | 49.7 | 37.7 | 17.6 | 84.7 | 29.5 | 34.2 | 73.2 | 60.1 | 2.1 | 31.5 |
| Water equivalent | 131.7 | 6.9 | 19.9 | 17.3 | 15.5 | 14.1 | 25.9 | 6.1 | 25.9 | 17.4 | 4.1 | 20.0 | 10.8 |
| Adipose equivalent | −274.5 | −191.4 | −130.9 | −137.1 | −137.7 | −171.1 | −195.5 | −145.6 | −144.2 | −157.2 | −172.6 | −109.5 | −145.1 |
| Air | −998.9 | −998.9 | −1000.0 | −889.8 | −998.9 | −398.7 | −1259.1 | −893.0 | −998.9 | −998.9 | −1046.4 | −1011.9 | −1110.7 |
Conflict of interest
The views expressed in this research article are those of the authors and do not reflect the official policy of the United States Air Force, the Department of Defense or the United States Government. The authors do not have any financial interest in the companies whose materials are discussed in this article.
Acknowledgments
The authors wish to acknowledge the support and assistance of Dr Roberto Molteni at AFP Imaging/QR Verona for assisting in the construction of our eight-tissue 3D dental phantom and John Smithson at Sirona Dental for funding travel and the opportunity to gather the data for the Sirona Galileos CBCT machine.
References
- 1.Almog DM, Romano PR. CT-based dental imaging for implant planning and surgical guidance. NY State Dent J 2007;73:57. [PubMed] [Google Scholar]
- 2.Andriole KP. MDCT: a disruptive technology evolves. Imaging Economics 2004:October: www.imagingeconomics.com/ [Google Scholar]
- 3.Armstrong RT. Acceptability of cone beam ct vs. multi-detector CT for 3D Anatomic model construction. AAOMS 2006;64:37 [Google Scholar]
- 4.Mah JK, Hatcher D. Three-dimensional craniofacial imaging. Am J Orthod Dentofac Orthop 2004;126:308–309 [DOI] [PubMed] [Google Scholar]
- 5.Quereshy FA, Savell TA, Palomo JM. Applications of cone beam computed tomography in the practice of oral and maxillofacial surgery. J Oral Maxillofac Surg 2008;66:791–796 [DOI] [PubMed] [Google Scholar]
- 6.Suomalainen AK, Salo A, Robinson S, Peltola JS. The 3DX multi-image micro-CT device in clinical dental practice. Dentomaxillofac Radiol 2007;36:80–85 [DOI] [PubMed] [Google Scholar]
- 7.Tantanapornkul W, Okouchi K, Fujiwara Y, Yamashiro M, Maruoka Y, Ohbayashi N, et al. A comparative study of cone-beam computed tomography and conventional panoramic radiography in assessing the topographic relationship between the mandibular canal and impacted third molars. Oral Surg Oral Med Oral Pathol Oral Radiol Endod 2007;103:253–259 [DOI] [PubMed] [Google Scholar]
- 8.Ogawa T, Enciso R, Shintaku WH, Clark GT. Evaluation of cross-section airway configuration of obstructive sleep apnea. Oral Surg Oral Med Oral Pathol Oral Radiol Endod 2007;103:102–108 [DOI] [PMC free article] [PubMed] [Google Scholar]
- 9.Osorio F, Perilla M, Doyle DJ, Palomo JM. Cone beam computed tomography: an innovative tool for airway assessment. Anesth Analg 2008;106:1803–1807 [DOI] [PubMed] [Google Scholar]
- 10.Katsumata A, Hirukawa A, Okumura S, Naitoh M, Fujishita M, Ariji E, et al. Effects of image artifacts on gray-value density in limited-volume cone-beam computerized tomography. Oral Surg Oral Med Oral Pathol Oral Radiol Endod 2007;104:829–836 [DOI] [PubMed] [Google Scholar]
- 11.Katsumata A, Hirukawa A, Noujeim M, Okumura S, Naitoh M, Fujishita M, et al. Image artifact in dental cone-beam CT. Oral Surg Oral Med Oral Pathol Oral Radiol Endod 2006;101:652–657 [DOI] [PubMed] [Google Scholar]
- 12.Ning R, Chen B, Yu R, Conover D, Tang X, Ning Y. Flat panel detector-based cone beam volume CT angiography imaging: system evaluation. IEEE Trans Med Im 2000;19:949–963 [DOI] [PubMed] [Google Scholar]
- 13.Norton MR, Gamble C. Bone classification: an objective scale of bone density using the computerized tomography scan. Clin Oral Implants Res 2001;12:228–234 [DOI] [PubMed] [Google Scholar]
- 14.Siewerdsen JH, Jaffray DA. A ghost story: spatio-temporal response characteristics of an indirect-detection flat-panel imager. Medical Physics 1999;26:1624–1641 [DOI] [PubMed] [Google Scholar]
- 15.Lagravère MO, Fang Y, Carey J, Toogood RW, Packota GV, Major PW. Density conversion factor determined using a cone-beam computed tomography unit NewTom QR-DVT 9000. Dentomaxillofac Radiol 2006;35:407–409 [DOI] [PubMed] [Google Scholar]
- 16.Miles DA, Danforth RA. A clinician's guide to understanding cone beam volumetric imaging (CBVI). 2007. Available from: www.ineedce.com/ [Google Scholar]
- 17.Periago D, Scarfe WC, Moshiri M, Scheetz JP, Silveira AM, Farman AG. Linear accuracy and reliability of cone beam CT derived 3-Dimensional images constructed using an orthodontic volumetric rendering program. Angle Orthodontist 2008;78:387–395 [DOI] [PubMed] [Google Scholar]
- 18.White DR, Martin RF, Darlison R. Epoxy resin based tissue substitutes. Br J Radiol 1977;50:814–821 [DOI] [PubMed] [Google Scholar]
- 19.Turkyilmaz I, Tozum TF, Tumer C. Bone density assessments of oral implant sites using computerized tomography. J Oral Rehabil 2007;34:267–272 [DOI] [PubMed] [Google Scholar]
- 20.Barrett JF, Keat N. Artifacts in CT: recognition and avoidance. Radiographics 2004;24:1679–1691 [DOI] [PubMed] [Google Scholar]
- 21.Shapurian T, Damoulis PD, Reiser GM, Griffin TJ, Rand WM. Quantitative evaluation of bone density using the Hounsfield index. Int J Oral Maxillofac Implants 2006;21:290–297 [PubMed] [Google Scholar]