Abstract
Objectives
Minimal density variations of mineralized tissues can be reliably detected with quantitative image subtraction analysis. The aim of this study was to evaluate quantitative variations of in vitro mineral density by varying the exposure time of direct digital radiographs using a computer assisted densitometric image analysis (CADIA) program.
Methods
In a human mandibular segment a three-wall periodontal defect was created mesial to a molar. Bone chips were created from the marrowbone of the same mandible with masses of 1 to 5 mg. A triplicate radiograph of the defect was taken as a baseline for seven different exposure times. The bone chips were inserted into the defect and another triplicate series of radiographs for the seven exposure times were taken as follow-up images. The images were analysed using CADIA software to detect variations in bone density.
Results
The results of CADIA revealed increased density when the size of the inserted bone chip increased. The 2 mg chip was underestimated owing to mass reduction during insertion. The regression line of the CADIA values was consistent with the weight of the bone chips of 1, 3, 4 and 5 mg. The exposure time f6 (0.178 s) showed the best correlation with the bone chip weight. Loss of information in the images occurred when the exposure time exceeded the sensor's latitude.
Conclusions
CADIA analysis is a reliable and sensitive tool for detecting subtle bone density variations. More reliable results are obtained with increased exposure time; however, excessive exposure should be avoided.
Keywords: computed assisted image interpretation, bone mineral density, subtraction technique, dental digital radiography
Introduction
Clinical parameters, such as plaque index, clinical attachment level, bleeding on gentle probing and probing pocket depth, are routinely used for diagnosing and monitoring periodontal disease. However, they have insufficient sensitivity and specificity to accurately diagnose and formulate a treatment plan; therefore, additional information is required for a more complete clinical evaluation.1–3 The use of conventional radiographic techniques before lesions become evident also has a low specificity and sensitivity for detecting initial periodontal lesions.4,5 Therefore, especially for clinical research purposes, radiographic techniques such as image subtraction1 have been used because they allow detection of minimal variations of the mineralized tissue density6 allowing early and non-invasive diagnosis7 of periodontal lesions, of peri-implantitis8 or of the outcome of regenerative surgery.4
In the image subtraction technique two standardized radiographs taken at different times are subtracted from each other in order to measure subtle changes in the mineralized tissues.9,10 The sensitivity of subtraction radiography varies between 82% and 88% and the specificity between 85% and 88%, showing a diagnostic precision of 87%.1,5,11 The quantitative analysis of radiographic images using image subtraction is called computerized assisted densitometric image analysis (CADIA).12 This technique has been used reliably to detect subtle variations in periodontal tissues in longitudinal studies.12 Several authors have conducted reliable and non-invasive studies with CADIA analysis of minimal variations of mineralized tissues, such as bone remodelling after flap surgery,13 peri-implant tissue variations after flap surgery,8,14 the healing process in the furcation area after regenerative procedures,2 the effect of non-steroidal anti-inflammatory drugs15 and chlorhexidine rinsing.16
The objective of this paper was to test the ability of a digital sensor of periapical radiographs and CADIA analysis to detect minimal variations of in vitro bone density with varying exposure times.
Materials and methods
The experimental model was based on the model used by Fourmousis et al17 using a digital RVG–ui system composed of an Elitys® X-ray tube, 70 kVp and 7 mA (Trophy, France); a digital sensor 45 × 31.6 mm with an active area of 36 × 26.5 mm in the 20 lp mm−1 hi-res modality), (Trophy 2000 v 4.1j software, Trophy, France).
A segment of dry human mandible was used to create a three wall bony defect mesial to a molar. The marrowbone of the same mandible was used to create five non-sharp or feather-edged bone chips, ranging from 1 to 5 mg of dry weight. The weight of the specimens was accurately checked with a precision scale (Bel, Nova Técnica, San Paulo, Brazil) with less than 0.01 mg of error.
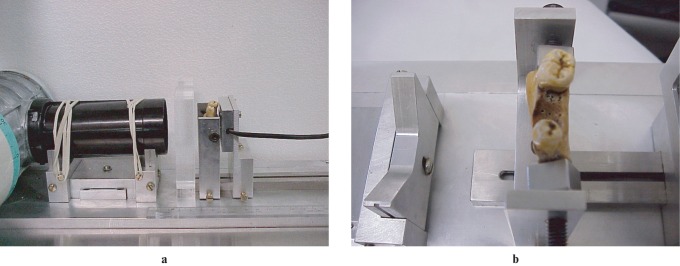
A novel paralleling device was fabricated to allow the geometry of the image to be kept consistent by means of rigid fixation of the different components: X-ray tube, soft tissue analogue,18 mandible segment and digital radiographic sensor (Figure 1a). The purpose was to keep the geometry of the images consistent to avoid geometry errors that could affect the CADIA analysis.11,17
Figure 1.
(a) Paralleling device with all the components rigidly fixed. (b) Human mandible with a three-wall defect created in the mesial aspect of the second molar
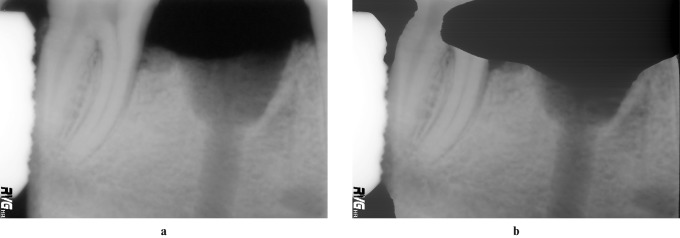
Increasing exposure times from 0.048 to 0.178 s (from f0 to f6 of the time selector of the Elytis equipment, Table 1) were used to acquire the radiographs. The images taken with the last three exposure times (f7, f8 and f9) were discarded because of ghost images produced due to the exposure time being beyond the sensor latitude (Figure 2b).
Table 1. Exposure times of the Elytis System.
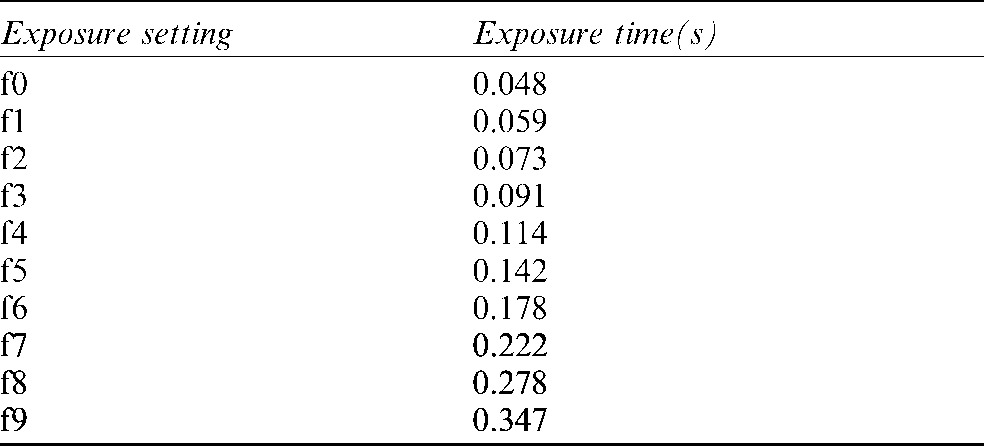
The images corresponding to times F7 to F9 (in gray) were discarded.
Figure 2.
(a) 1536 × 1024 *.TIFF LZW image taken with exposure time f4. (b) Radiograph with a ghost image taken with exposure time f8
A direct digital radiograph (DDR) of the empty bony defect was repeated 3 times and these were acquired and stored as the baseline images for the 7 exposure times (f0–f6, Table 1), resulting in 21 baseline images (Figure 2a). After each bony chip (1 to 5 mg) was inserted into the defect with cotton pliers, a triplicate DDR was acquired for each exposure time and stored as a follow-up image in the Elytis software.
The CADIA software used in the Dental School of the University of Berne requires 512 × 512 raw pixel data. It was, therefore, necessary to transform the exported images from the Elytis software, which has a 1536 × 1024 TIFF LZW format (Lempel, Ziv and Welsch compression for continuous grey-level images).
The transformation consisted of the following steps:
Decompress the image *.TIFF LZW to uncompressed tagged image format file (TIFF) using Image Tool® (v 2.00, The University of Texas Health Science Center, San Antonio, TX, 1995–1996) and save the image as *.BMP (bitmap).
Open the *.BMP image with Scion® software (Release β 2, Scion Corporation, MD, 1997) and save the image in Raw Pixel Data (RPD) format.
Crop the images to the same 512 × 512 area using a custom Matlab® routine (The MathWorks Inc, 1984–1999, v. 5.3.0.10183 R11, MA).
The 512 × 512 RPD images were, finally, stored on a removable optical disk for CADIA analysis.
CADIA analysis was performed according to the following procedure:13
The baseline and the follow-up image were superimposed and correct image alignment was achieved.
The grey level histograms of the two images were compared and corrected to compensate for the differences due to the capture process.
Subtraction of the images was performed and the result was displayed after adding an average background grey level of 128. Areas with grey level < 128 appeared dark against the background, indicating loss of density. Areas with a grey level > 128 appeared bright against the background indicating an increase in density (Figure 3).
A region of interest (ROI) was drawn on the baseline image and stored in the CADIA system for use on the subtracted image.
The size of the pixel was calculated based on known distances.
The average grey level of all 2 × 2 pixels in the ROI of the subtracted image was then calculated. The values in the subtraction picture were defined as the differences between the baseline image and the follow-up. Negative values indicated a decrease in radiographic density, whereas positive values indicated an increase.
To diminish the noise of the system a threshold was chosen. This is a procedure that would decrease false-positives and negatives.
A printout of the CADIA analysis was generated and the values stored in a Microsoft Excel 2000 spreadsheet (v 9.0.2812, Microsoft Corporation, WA, 1985–1999) for statistical analysis.
Figure 3.
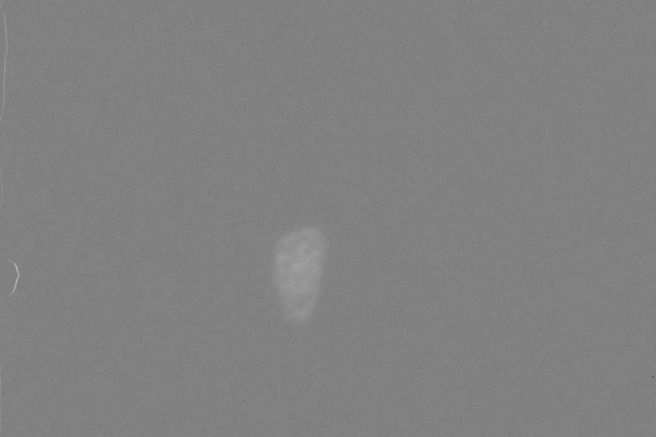
Subtraction image of a bone chip inserted into the mandibular defect
Approval for the study was obtained from the Ethics Committee of the Dental School of the University of Sao Paulo, number 160/01, on 9th October 2001.
Results
The results of the mean triplicate CADIA positive volume for each bone mass inserted into the defect and for each exposure time are presented in Table 2. Mean positive, negative and net volumes for each exposure time for the five bone chips are reported in Table 3.
Table 2. Mean positive computer assisted densitometric image analysis (CADIA) values for each exposure time and each bone chip.
| Exposure time |
||||||||
| Bone mg | f0 (0.048 s) | f1 (0.059 s) | f2 (0.073 s) | f3 (0.091 s) | f4 (0.114 s) | f5 (0.142 s) | f6 (0.178 s) | |
| 1 | 25.447 | 22.762 | 28.273 | 26.834 | 23.808 | 20.753 | 21.259 | |
| 2 | 19.463 | 14.342 | 21.147 | 24.898 | 25.211 | 27.062 | 25.395 | |
| 3 | 56.769 | 51.779 | 60.402 | 63.667 | 62.687 | 58.449 | 60.117 | |
| 4 | 80.081 | 71.161 | 87.333 | 83.253 | 80.274 | 80.690 | 81.592 | |
| 5 | 102.326 | 95.068 | 106.932 | 108.073 | 105.280 | 106.608 | 106.563 | |
Table 3. Mean positive, negative and net volume values for each exposure time for the five bone chips.
| Exposure time |
|||||||
| Mean values | f0 | f1 | f2 | f3 | f4 | f5 | f6 |
| Positive volume | 60.28 | 54.47 | 61.43 | 61.56 | 59.51 | 58.72 | 58.99 |
| Negative volume | −3.47 | −3.45 | −0.61 | −0.22 | −0.06 | −0.01 | 0.00 |
| Net volume | 56.82 | 51.02 | 60.82 | 61.34 | 59.45 | 58.71 | 58.99 |
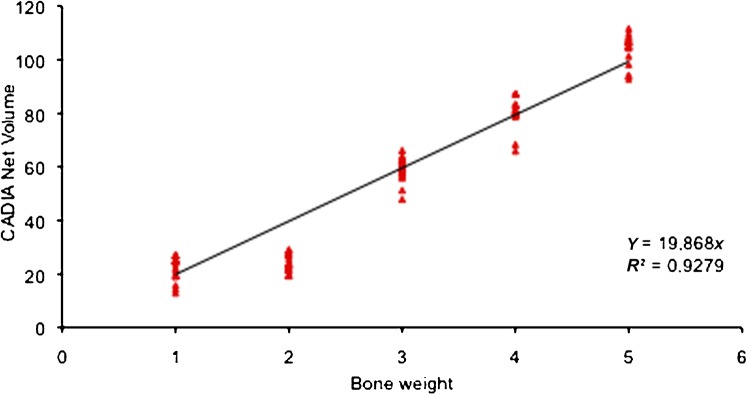
The mean values of the CADIA readings for net volume and the exposure time f6 (0.178 s) with their regression tendency (R2 = 0.9279) are plotted in Figure 4. The value of Y represents the reading for each mg of bone inserted into the defect.
Figure 4.
Plot of the regression tendency for the net volume for the f6 exposure time. Y, CADIA net volume for each mg of bone
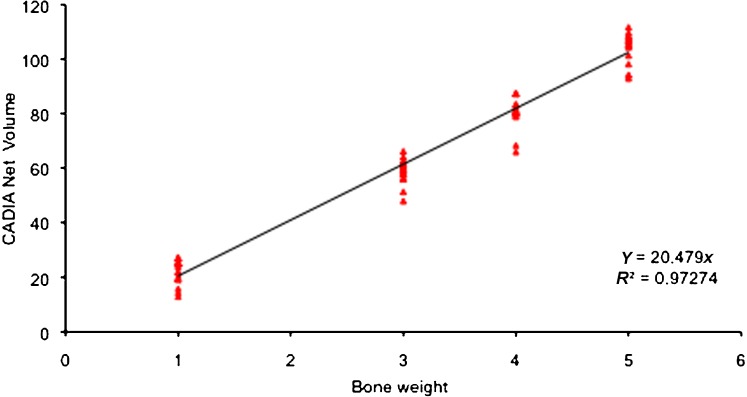
From the regression analysis, it was evident that the readings for the 2 mg bone chip were abnormal so a second regression was performed excluding its data. The mean values of the CADIA readings for the net volume and for the exposure time f6 (0.178 s) with their regression tendency excluding the 2 mg bone chip readings (R2 = 0.9727) are plotted in Figure 5. The value of Y represents the reading for each mg of bone inserted into the defect.
Figure 5.
Plot of the regression tendency for the net volume for the f6 exposure time excluding the readings for the 2 mg bone chip. Y, CADIA net volume for each mg of bone
The estimates of the bone chip volumes, based on the Y value of the regression line (intercept with the X-axis for 1 mg of bone), with the five bone chips (Y5) and with the exclusion of the 2 mg bone chip (Y4), and with their relative per cent errors based on the f6 exposure time readings are summarized in Table 4.
Table 4. Estimate of the bone chips volume based on the Y value with the five bone chips (Y5) and with the exclusion of the 2 mg bone chip (Y4) with their relative percent errors.
| Vol. | Y5 | Est. vol. (5) | Error (%) | Y4 | Est. vol. (4) | Error (%) |
| 1 | 19.87 | 1.07 | 6.5 | 20.48 | 1.04 | 3.7 |
| 2 | 39.74 | 1.28 | −56.5 | |||
| 3 | 59.60 | 3.03 | 0.9 | 61.44 | 2.94 | −2.2 |
| 4 | 79.47 | 4.11 | 2.6 | 81.92 | 3.98 | −0.4 |
| 5 | 99.34 | 5.36 | 6.8 | 102.40 | 5.20 | 3.9 |
(4), Four bone chips; (5), Five bone chips.
Discussion
The correct analysis of periapical radiographs is of paramount importance for the early detection of subtle changes in mineralized periodontal tissues. In this respect CADIA quantitative analysis has been fundamental to the understanding of reparative and regenerative processes4,8,11,12,16,17,19–21 through an exact and non-invasive procedure, allowing the evaluation of the effects of such complex treatments on periodontal mineralized tissues. CADIA analysis has been reported to be highly sensitive and specific, showing a diagnostic accuracy of 87%.5
The digital images used in this experiment are 8-bit TIFF format with 256 grey levels with a matrix of 1536 × 1024 pixels. The transformation of the original image into an RPD format was without loss of information because the LZW compression/decompression algorithm is symmetrical, adaptive and lossless. The spatial resolution of the images was excellent because the human eye is able to distinguish up to 17 lp mm−1, but the contrast resolution was low (the histogram of the subtracted image showed a narrow central peak (128 ± 30)). A better resolution was obtained through histogram equalization.
The amount of radiation needed to obtain the images was up to 78% less than that needed for conventional films.22
The mean readings for each exposure time and for each bone fragment showed a growing linear trend except for the 2 mg bone chip, the values of which were always below the 2 mg bone chip estimate. The regression line of the CADIA values of the five different bone chips showed values consistent with the mass inserted into the defect (R2 = 0.9279) with the exception of the 2 mg chip, which is under the regression line probably because it was partially broken during its insertion into the defect. The Y value corresponded to 19.868 CADIA values for each mg of bone. When the 2 mg bone chip was excluded from the regression analysis the correlation coefficient value increased to R2 = 0.97274 and the Y value was of 20.479 CADIA for each mg of bone. The error of the estimate with the exclusion of the 2 mg bone chip value ranged from 0.4% to 4%, which is acceptable as the data reported in the literature for non-calibrated systems can be up to 16% and show a range of 2–4% only for calibrated systems.23
The subtracted images showed an almost perfect control of the geometry of the image owing to the robust construction of the paralleling device that had a precision of 1/100° and allowed the necessary stability of all the components. Furthermore, the closest possible similarity was achieved to the clinical condition, with soft tissues present as an acrylic analogue,18 the focal length kept to 21 cm and the sensor located close to the tissues to be analysed.
Exposure times f0 and f1 did not show a contrast resolution good enough to accurately detect subtle mineralized tissue variations. Exposure times f2 and f3 were reasonably good for the detection of mineral density changes but underestimated the 2 mg mass.
The best results were from exposure times of f4 to f6, as shown by the lowest values of mean negative volume change.
In conclusion, CADIA analysis is a reliable, non-invasive diagnostic tool for detecting subtle changes in the mineralization of hard tissues provided that an appropriate exposure of the digital sensor is used. The highest exposure times should be used with caution because they can produce ghost images.
Acknowledgments
The CADIA analysis software was made available at the Dental School of the University of Berne (CH) courtesy of Professor NP Lang, Professor U Brägger and Dr Eng W Bürgin. Logistical support: Mrs B Frutig. The routine in Matlab® was written by Professor D Simões, University Braz-Cubas, Mogi das Cruzes, Sao Paulo, SP, Brazil. The RVG-ui system was generously made available from the Nordic Biotech, Sao Paulo, Brazil.
References
- 1.Bragger U. Digital imaging in periodontal radiography. A review. J Clin Periodontol 1988;15:551–557 [DOI] [PubMed] [Google Scholar]
- 2.Braegger U, Pasquali L, Weber H, Kornman KS. Computer-assisted densitometric image analysis (CADIA) for the assessment of alveolar bone density changes in furcations. J Clin Periodontol 1989;16:46–52 [DOI] [PubMed] [Google Scholar]
- 3.Janssen PT, van PalensteinHelderman WH, van Aken J. The detection of in vitro produced periodontal bone lesions by conventional radiography and photographic subtraction radiography using observers and quantitative digital subtraction radiography. J Clin Periodontol 1989;16:335–341 [DOI] [PubMed] [Google Scholar]
- 4.Bragger U, Hammerle CH, Mombelli A, Burgin W, Lang NP. Remodelling of periodontal tissues adjacent to sites treated according to the principles of guided tissue regeneration (GTR). J Clin Periodontol 1992;19:615–624 [DOI] [PubMed] [Google Scholar]
- 5.Dove SB, McDavid WD, Hamilton KE. Analysis of sensitivity and specificity of a new digital subtraction system: an in vitro study. Oral Surg Oral Med Oral Pathol Oral Radiol Endod 2000;89:771–776 [DOI] [PubMed] [Google Scholar]
- 6.Christgau M, Hiller KA, Schmalz G, Kolbeck C, Wenzel A. Accuracy of quantitative digital subtraction radiography for determining changes in calcium mass in mandibular bone: an in vitro study. J Periodontal Res 1998;33:138–149 [DOI] [PubMed] [Google Scholar]
- 7.Jeffcoat MK, Reddy MS, Magnusson I, Johnson B, Meredith MP, Cavanaugh PF, Jr, et al. Efficacy of quantitative digital subtraction radiography using radiographs exposed in a multicenter trial. J Periodontal Res 1996;31:157–160 [DOI] [PubMed] [Google Scholar]
- 8.Bragger U, Burgin W, Lang NP, Buser D. Digital subtraction radiography for the assessment of changes in peri-implant bone density. Int J Oral Maxillofac Implants 1991;6:160–166 [PubMed] [Google Scholar]
- 9.Zappa U, Simona C, Graf H, van Aken J.In vivo determination of radiographic projection errors produced by a novel filmholder and an X-ray beam manipulator. J Periodontol 1991;62:674–683 [DOI] [PubMed] [Google Scholar]
- 10.Morea C, Langlotz F, Scheer C, Burgin W, Nolte LP, Lang NP, et al. Development of an opto-electronic positioning device for serial direct digital images of oral structures. J Periodontal Res 2000;35:225–231 [DOI] [PubMed] [Google Scholar]
- 11.Reddy MS, Jeffcoat MK. Methods of assessing periodontal regeneration. Periodontol 2000 1999;19:87–103 [DOI] [PubMed] [Google Scholar]
- 12.Bragger U, Pasquali L, Kornman KS. Remodelling of interdental alveolar bone after periodontal flap procedures assessed by means of computer-assisted densitometric image analysis (CADIA). J Clin Periodontol 1988;15:558–564 [DOI] [PubMed] [Google Scholar]
- 13.Bragger U, Pasquali L, Rylander H, Carnes D, Kornman KS. Computer-assisted densitometric image analysis in periodontal radiography. A methodological study. J Clin Periodontol 1988;15:27–37 [DOI] [PubMed] [Google Scholar]
- 14.Bragger U, Burgin W, Fourmousis I, Lang NP. Image processing for the evaluation of dental implants. Dentomaxillofac Radiol 1992;21:208–212 [DOI] [PubMed] [Google Scholar]
- 15.Bragger U, Muhle T, Fourmousis I, Lang NP, Mombelli A. Effect of the NSAID flurbiprofen on remodelling after periodontal surgery. J Periodontal Res 1997;32:575–582 [DOI] [PubMed] [Google Scholar]
- 16.Bragger U, Schild U, Lang NP. Effect of chlorhexidine (0.12%) rinses on periodontal tissue healing after tooth extraction. (II). Radiographic parameters. J Clin Periodontol 1994;21:422–430 [DOI] [PubMed] [Google Scholar]
- 17.Fourmousis I, Bragger U, Burgin W, Tonetti M, Lang NP. Digital image processing. II. In vitro quantitative evaluation of soft and hard peri-implant tissue changes. Clin Oral Implants Res 1994;5:105–114 [DOI] [PubMed] [Google Scholar]
- 18.Scarfe WC, Fana CR, Jr, Farman AG. Radiographic detection of accessory/lateral canals: use of RadioVisioGraphy and Hypaque. J Endod 1995;21:185–190 [DOI] [PubMed] [Google Scholar]
- 19.Bragger U, Pasquali L. Color conversion of alveolar bone density changes in digital subtraction images. J Clin Periodontol 1989;16:209–214 [DOI] [PubMed] [Google Scholar]
- 20.Lehmann B, Bragger U, Hammerle CH, Fourmousis I, Lang NP. Treatment of an early implant failure according to the principles of guided tissue regeneration (GTR). Clin Oral Implants Res 1992;3:42–48 [DOI] [PubMed] [Google Scholar]
- 21.Bragger U. Radiographic parameters for the evaluation of peri-implant tissues. Periodontol 2000 1994;4:87–97 [DOI] [PubMed] [Google Scholar]
- 22.Kodak. Exposure guidelines for Kodak Ultra Speed Dental Filmes. [2003; cited]. Available from: http://sysdoc.doors.ch/KODAK/N-412.pdf. [Google Scholar]
- 23.Southard TE, Wunderle DM, Southard KA, Jakobsen JR. Geometric and densitometric standardization of intraoral radiography through use of a modified XCP system. Oral Surg Oral Med Oral Pathol Oral Radiol Endod 1999;87:253–257 [DOI] [PubMed] [Google Scholar]


