

Abstract
Objectives
The purpose of the study was to calculate the effective dose delivered to the patient undergoing cone beam (CB) CT of the jaws and maxillofacial complex using the i-CAT Next Generation CBCT scanner (Imaging Sciences International, Hatfield, PA).
Methods
A RANDO® phantom (The Phantom Laboratory, Salem, NY) containing thermoluminence dosemeters were scanned 10 times for each of the 6 imaging protocols. Effective doses for each protocol were calculated using the 1990 and approved 2007 International Commission on Radiological Protection (ICRP) recommended tissue weighting factors (E1990, E2007).
Results
The effective dose for E1990 and E2007, respectively, were: full field of view (FOV) of the head, 47 μSv and 78 μSv; 13 cm scan of the jaws, 44 μSv and 77 μSv; 6 cm standard mandible, 35 μSv and 58 μSv; 6 cm high resolution mandible, 69 μSv and 113 μSv; 6 cm standard maxilla, 18 μSv and 32 μSv; and 6 cm high resolution maxilla, 35 μSv and 60 μSv.
Conclusions
Using the new generation of CBCT scanner, the effective dose is lower than the original generation machine for a similar FOV using the ICRP 2007 tissue weighting factors.
Keywords: radiation dosimetry, cone beam computed tomography
Introduction
Cone beam CT (CBCT) is becoming increasingly advocated in the several fields of dentistry.1-11 The radiation doses from CBCT are significantly lower than medical CT, but generally higher than conventional dental radiography.12,13 Recently, the SEDENTEXCT working group proposed provisional evidence-based selection criteria with clinical indications as to when to perform CBCT.14 CBCT should only be used when the clinical question cannot be answered by conventional radiography and the field of view (FOV) should be limited to the region of interest (ROI).14,15 Ideally CBCT equipment should be able to offer a choice of volume sizes to reduce the radiation dose to the patient. A risk–benefit analysis must be performed on each individual patient when CBCT is being considered, and to assess the risk from CBCT the effective dose must first be calculated. Several authors have published work calculating the effective dose from CBCT,12,13,16-19 but few have looked at the different scan protocols available.20 In a previous study examining the effective doses obtained using the i-CAT Classic (Imaging Sciences International, Hatfield, PA), a range of imaging protocols were investigated.21 This showed that dose varied depending on the region examined as well as the exposure time. In 2007, the i-CAT Next Generation (Imaging Sciences International) was launched. This machine offers a choice of voxel sizes for imaging and is able to provide quicker CBCT scans than its predecessor. The machine has also been modified to provide a full FOV scan whereby the X-ray detector rotates into a portrait mode. By offsetting the centre of rotation, the machine is able to capture a larger FOV. The advantage when compared with the i-CAT Classic is that only one rotation of the X-ray detector and source around the patient is required rather than carrying out two scans. The disadvantage is that a smaller height but a larger diameter is imaged. A potential problem with the i-CAT Classic extended FOV scan is that the patient could move during the gantry repositioning for the second scan and therefore the data may not be “stitched” adequately together. The aim of this study was to calculate the effective doses to the patient undergoing CBCT examinations using i-CAT Next Generation and to compare them with previous studies involving the i-CAT Classic and the i-CAT Next Generation.
Materials and methods
The i-CAT Next Generation dental CBCT scanner used in this study consists of a standard high frequency, fixed anode X-ray tube (SXR 130-15-0.5, 120 kVp, 3–7 mA, focal spot size 0.5 mm and duty cycle 3%) and a 20×25 cm amorphous silicon (a-Si) flat panel detector. The performance of the X-ray tube and generator were evaluated before the study and they complied with test tolerances recommended by the Institute of Physics and Engineering in Medicine (IPEM) report 91.22 The unit had been calibrated as per the manufacturer's recommendation and the performance of the digital detector had been previously assessed and compared with those results obtained at commissioning.
The set-up of the phantom and the placement of the thermoluminescent dosemeters (TLDs) is similar to the study by Roberts et al.20 TLD-100H (LiF: Mg, P, Cu) chips (sourced from Qados UK, agent of ThermoScientific, Sandhurst, Berkshire, UK) calibrated for use in CBCT beam conditions (120 kV, 9.95 mmAl) were used. 3 calibrated TLD chips stacked vertically were positioned at 24 pre-determined locations within the head and neck region of an adult tissue-equivalent anthropomorphic RANDO® man phantom (The Phantom Laboratory, Salem, NY). RANDO phantoms contain a human tissue skeleton which makes each phantom unique. Each TLD location, anatomical position and the RANDO level in which the TLD chips were placed are displayed in Table 1 and Figure 1. The RANDO phantom was placed into the machine as per the recommended patient positioning protocols. A single scout view was undertaken prior to scanning to determine whether the FOV encompassed the whole anatomical ROI prior to undertaking a CBCT scan. Each scan was carried out 10 times with the same TLD chips in the same positions. The chips were then read using a calibrated hot gas reader. The pre-determined site for the location of the TLDs were similar to previous studies.12,13,16,20
Figure 1.
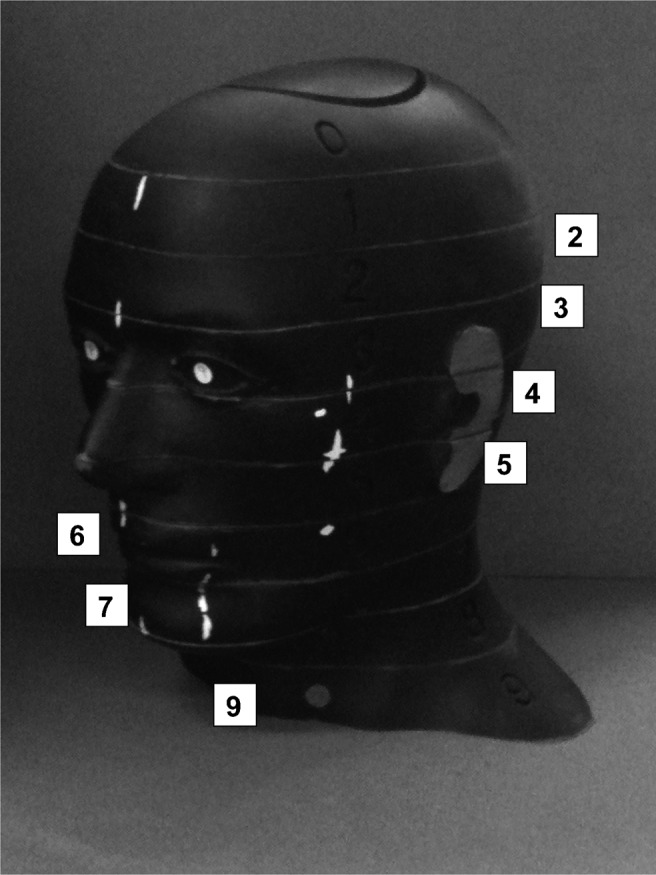
The RANDO® phantom used in the study showing the phantom levels used for locating the thermoluminescent dosemeters (TLD)
Table 1. Locations of thermoluminescent dosemeter chips within the RANDO® phantom.
| TLD ID | Phantom location | Phantom level |
| 1 | Calvarium anterior | 2 |
| 2 | Calvarium left | 2 |
| 3 | Calvarium posterior | 2 |
| 4 | Mid-brain | 2 |
| 5 | Pituitary | 3 |
| 6 | Right orbit | 4 |
| 7 | Left orbit | 4 |
| 8 | Right lens of eyea | 3 |
| 9 | Left lens of eyea | 3 |
| 10 | Right cheeka | 5 |
| 11 | Right parotid | 6 |
| 12 | Left parotid | 6 |
| 13 | Right ramus | 6 |
| 14 | Left ramus | 6 |
| 15 | Centre cervical spine | 6 |
| 16 | Left back of necka | 7 |
| 17 | Right mandible body | 7 |
| 18 | Left mandible body | 7 |
| 19 | Right submandibular gland | 7 |
| 20 | Left submandibular gland | 7 |
| 21 | Centre sublingual gland | 7 |
| 22 | Midline thyroid | 9 |
| 23 | Left thyroid surfacea | 9 |
| 24 | Oesophagus | 9 |
TLD, thermoluminescent dosemeter
aTLD positioned on the surface of the phantom
The fractions of organs irradiated in the scans are shown in Table 2. All organs identified by the International Commission on Radiological Protection (ICRP) within the head were considered. Where an organ is not fully contained within the head a partial volume is considered, as recommended by ICRP. The arrangement of TLDs within the phantom attempted to compensate for any intraorgan variation in the dose applied. This is particularly appropriate for the large organs (brain, bone and skin) where some of the organ exists in the high dose primary beam and some of it exists in the low dose scatter region. It was assumed the oral mucosa dose was the same as the submandibular gland dose for each scan and therefore a conservative estimate of 100% irradiation of the oral mucosa was made for all the scans carried out. Although not required for the effective dose calculation, the organ dose to the eye and pituitary gland was also considered as high-risk organs.
Table 2. Estimated fraction of organ irradiation for each scan type.
| Volume fraction irradiated (%) | |
| Bone marrow | 16.5 weighted as: |
| Mandible | 1.3 |
| Calvaria | 11.8 |
| Cervical spine | 3.4 |
| Thyroid | 100.0 |
| Oesophagus | 10.0 |
| Skin | 5.0 |
| Bone surface | 16.5 weighted as: |
| Mandible | 1.3 |
| Calvaria | 11.8 |
| Cervical spine | 3.4 |
| Salivary glands | 100.0 weighted as: |
| Parotid | 33.3 |
| Submandibular | 33.3 |
| Sublingual | 33.3 |
| Brain | 100.0 |
| Remainder | |
| Brain | 100.0 |
| Adipose | 5.0 |
| Connective tissue | 5.0 |
| Lymphatic nodes | 5.0 |
| Muscle | 5.0 |
| Extrathoracic airway | 100.0 |
| Pituitary | 100.0 |
| Eyes | 100.0 |
Effective dose was calculated for six commonly utilized scan volumes in dentistry, namely:
full head at 120 kV, 2.1 mA, 8.9 s, 0.4 mm voxel
13 cm scan of both mandible and maxilla at 120 kV, 2.1 mA, 8.9 s, 0.4 mm voxel
6 cm standard resolution mandible 120 kV, 2.1 mA, 8.9 s, 0.4 mm voxel
6 cm high resolution mandible 120 kV, 1.4 mA, 26.9 s, 0.2 mm voxel
6 cm standard resolution maxilla 120 kV, 2.1 mA, 8.9 s, 0.4 mm voxel
6 cm high resolution maxilla 120 kV, 1.4 mA, 26.9 s, 0.2 mm voxel.
Figure 2 shows the irradiated volumes for these scans. Effective dose was calculated using both the ICRP 1990 and ICRP 2007 weighting factors.23,24
Figure 2.

Three-dimensional reconstructions of the irradiated regions using i-CAT Next Generation. (a) Full head, (b) 13 cm scan of the jaws, (c) 6 cm maxilla, (d) 6 cm mandible (SimPlant; Materialise Dental NV, Leuven, Belgium)
The three dosemeter readings at each site were averaged and the radiation weighted dose was calculated by multiplying the background subtracted mean organ dose by the fraction of the organ or tissue in the irradiated field. Effective dose (E) was calculated using (E = ΣwT×HT). Both the ICRP 1990 and 2007 weighting factors were used in the final calculations.23,24
Results
The effective doses calculated for the various scan protocols are shown in Table 3. The highest dose was recorded using the full head scan and the lowest using the standard resolution scan of the maxilla. Using a high resolution scan protocol, the effective dose is approximately twice that of the standard resolution.
Table 3. Comparison of effective dose (μSv) for several scan protocols using the i-CAT Next Generation and i-CAT Classic13,16,19,20.
| Current study |
Ludlow and Ivanovic13 |
Ludlow and Ivanovic13 |
Ludlow et al16 |
Roberts et al20 |
Loubele et al19 |
||
| Program | Tissue weighting factor | i-CAT Next Generation | i-CAT Next Generation | i-CAT Classic | i-CAT Classic | i-CAT Classic | i-CAT Classic |
| Full head (0.4 voxel)a | ICRP 1990 | 47 | 37 | 134.4 | 92.8 | - | |
| ICRP 2007 | 78 | 74 | 193.4b | 182.1 | 82 | ||
| 13 cm (0.4 mm voxel) | ICRP 1990 | 44 | 36 | 29 | 68.7 | 39.5 | |
| ICRP 2007 | 77 | 87 | 69 | 104.5b | 110.5 | ||
| 6 cm mandible (0.4 mm voxel) | ICRP 1990 | 35 | 23.9 | - | |||
| ICRP 2007 | 58 | 75.3 | 34 | ||||
| 6 cm mandible (0.2 mm voxel) | ICRP 1990 | 69 | 47.2 | - | |||
| ICRP 2007 | 113 | 148.5 | 64 | ||||
| 6 cm maxilla (0.4 mm voxel) | ICRP 1990 | 18 | 9.7 | - | |||
| ICRP 2007 | 32 | 36.5 | 45 | ||||
| 6 cm maxilla (0.2 mm voxel) | ICRP 1990 | 35 | 18.5 | - | |||
| ICRP 2007 | 60 | 68.3 | 77 |
aHeight 17 cm for i-CAT Next Generation and 22 cm for i-CAT Classic
bBased on proposed ICRP 2005 tissue weighting factors
For the repeated scan protocols there was an 18% variation recorded overall, which may warrant further repeat investigation to decrease this error. Inter-TLD error was recorded at 10%, which should be sufficient for dosimetry calculation; however, the overall maximum error could be larger based on the use of 24 individual sites.
Table 3 also displays a comparison of this study with other studies using both generations of the i-CAT units using comparable limited FOVs.13,16,19,20
Discussion
ICRP recently published modified tissue weighting factors for the calculation of the effective dose24 to replace those published in 1990.23 The most relevant difference between these factors for this study has been the inclusion of the salivary glands as an individually weighted tissue and the addition of the oral mucosa to the remainder organs, both of which were not included in the previous recommendations. The tissue weighting factor for the remainder organs has also increased from 0.05 to 0.12. One aim of this study was to calculate the effective dose to patients using the current and previous ICRP factors.
The measurement of the effective dose for the i-CAT Next Generation CBCT scanner in portrait mode (full FOV) has been previously performed by Ludlow and Ivanovic13 as in this study. In the current study we recorded slightly higher effective doses for the full head scan and 13 cm mandible and maxillary when compared with findings made by Ludlow and Ivanovic,13 except for the 13 cm measurements when comparing the ICRP 2007 weighting factors.24 This could be explained by the different experimental set-up between groups and perhaps the wide variability we detected in our TLD set-up. There may be differences in the measurement of the absorbed dose using differing TLD readers and the experimental set-up of the phantom within the machine. As all the target organs within the volume of interest are small, it is likely that small variations in the positioning and placement of TLDs used to represent organs relative to the primary beam and other structures in the head result in large changes in effective dose as reflected by the non-negligible reproducibility error in this study. However, it would appear that we have a similar dose figure using the i-CAT Next Generation.
This study therefore raises the question of exactly how comparable data sets from different research teams actually are. Table 3 shows a wide variation in the effective dose from previous studies. All figures obtained and those recorded in this study are suggestive of a systematic difference; however, convincing reasons for this are unclear. The current study repeated the experimental set-up using the same RANDO phantom and a similar experimental protocol as mentioned by Roberts et al;20 however, differing TLD sets were used and read by different machines and different volume fractionations were applied to the various organs. The current study generally found a higher effective dose compared with previous studies when using the ICRP 1990 weighting factors; however, we generally found a lower effective dose when using the 2007 weighting factors.
The manufacturers of TLDs recommend that they not be used for low dose calculation because of the large signal to noise ratio. The lowest absorbed dose measurement from a single TLD in the current study was 69 μGy with a background reading of 1 μGy. The TLDs used in this study were the TLD-H material, which has an operating range down to 1 μGy; the TLD 100 (LiF) material used in other studies12,13,16,20 has an operating range down to only 10 μGy, so we may have achieved a better calculation of the absorbed dose in this study compared with those previously undertaken, resulting in another variability in the experimental setup.
The effective dose for a full FOV scan is generally lower when using the i-CAT Next Generation scanner compared with the i-CAT Classic since a different imaging volume is captured. With the i-CAT Next Generation the imaging detector rotates 90 degrees into a portrait mode, thereby allowing a 17 cm high by 23 cm diameter scan of the maxillofacial skeleton to be imaged. With the i-CAT Classic, craniofacial imaging can be performed by the addition of two rotational scans, which are stitched together by the software to produce a single volume with a 22 cm height and a 16 cm diameter, taking approximately 40 s.25 A smaller scan height is captured with the i-CAT Next Generation and the imaging volume is captured in a single revolution lasting approximately 9 s. Therefore, direct comparison of the effective dose from the i-CAT Next Generation and i-CAT Classic cannot be made. Using the new i-CAT Next Generation it is not possible to perform a similar size scan as with the previous unit owing to the X-ray and imaging detector gantry remaining in a fixed position. Using the i-CAT Classic, the parotid salivary glands will be irradiated twice, once by the primary beam and once by the scattered radiation when the second scan is added.
Field size limitation ensures that an optimal FOV can be selected for each patient based on the clinical presentation or the anatomical region that is to be imaged. CBCT systems can be categorized according to the FOV.25 The second purpose of this study was to compare the limited FOVs between the two generations of CBCT machine. Since the original i-CAT Classic scanner was able to scan in two voxel resolutions, standard 0.4 mm and high resolution 0.2 mm, the same voxel resolutions were selected when using the i-CAT Next Generation machine.
To allow comparison with a previous study,20 exactly the same limited FOVs were used. Both machines have the preset variables of 6 cm mandible, 6 cm maxilla and 13 cm mandible and maxilla, so the imaging heights should be similar in both machines. Variations in the amount of anatomy covered are minor and therefore we can assume a similar volume has been irradiated in both studies. Limited FOVs all maintained a diameter of 16 cm and the same imaging heights as selected from the i-CAT acquisition software (Xoran view in i-CAT Classic and i-CAT VisionQ in the i-CAT Next Generation).
As stated before, the view for the full head using the i-CAT Next Generation is slightly shorter but comparatively wider in its diameter. Therefore, the effective dose is likely to be different between the two studies.
Since both generations of i-CAT use similar imaging positions, the same landmarks on the RANDO phantom were used to allow reproducible positioning. This helps to reduce differences in dose measurements due to positioning discrepancies. In addition, the same RANDO phantom was utilized in both studies so there should be no variation in either the anatomical factors or TLD location; however, given the size of TLDs compared with the target organs, any misalignment in either study could have resulted in a deviation from the mean.
Volume fractions in this study were different from those chosen by Roberts et al,20 which were based on fractions used by Ludlow,16 because the ICRP methodology for dose calculation actually refers to mass weightings; we assumed a uniform density across each organ as it is simpler to estimate a volume fraction than a mass fraction. Unlike Roberts et al,20 we did not modify the volume fractions irradiated value to accommodate the non-full FOV examinations. This may influence the calculated effective dose using the ICRP 1990 weighting factors as in the current study it can be seen that the effective dose is much higher. This was undertaken, in the case of bone marrow for example, because this volume has not changed nor has the position of the TLDs that are irradiated during a scan. The study did confirm an increase in the effective dose when using the ICRP 2007 weighting factors.
When comparing the effective dose from the Roberts et al study20 and excluding the full head scan, it can be seen that there is generally a higher effective dose when using the i-CAT Classic CBCT in comparison with the i-CAT Next Generation when one applies the ICRP 2007 tissue weighting factors. The same voxel sizes, kV and mA, have been used. Imaging time and therefore patient exposure time is shorter in the new version of the machine and this has a direct impact on the absorbed dose in the patient. Both studies reveal a similar imaging trend—the dose to the mandible is higher than the maxilla.
The i-CAT Next Generation is able to use voxel resolutions of 0.4 mm, 0.3 mm, 0.25 mm, 0.2 mm and in selected imaging protocols 0.125 mm. When noting the kilovoltage (kV), current (mA) and time (s) for image acquisition applied during the various voxel resolutions, it can be seen that similar exposure factors are used in the 0.4 mm, 0.3 mm, 0.25 mm and 0.2 mm voxel. The change in voxel size when using the same acquisition dataset will impact the noise within the image. Further studies are required on the subjective image quality comparing scans of different voxel sizes. This is clearly a suitable subject for image quality optimization in this modality.
The 6 cm standard resolution (0.4 mm voxel) scans of the mandible or maxilla are ideal when assessing the bony morphology for implant planning purposes. However, it should be noted that now the authors have more experience with these units, smaller volume heights are routinely used. Changes to the i-CAT software have included the introduction of a 4 cm scan height of either the mandible or maxilla and the option to customize the scan height should the patient be slightly larger or smaller than the selected FOV. The machine is also capable of collimating the beam in a vertical fashion by scanning the dental arches in a scan height of 8 cm with a scan diameter of 8 cm; therefore, if dental implants are planned in both arches it may be prudent to perform the new 8 cm by 8 cm program that collimates the FOV to the dentition only.
Finally, the super high resolution is available with the i-CAT Next Generation with a voxel size of 0.125 mm. This scan should only be used if absolutely necessary, e.g. localization of fine root canals that can not be easily visualized by conventional radiography, as the dose to the patient will be high when compared with traditional intraoral views owing to the long scan time. It is unlikely that the 0.125 mm voxel scan will be routinely used, as most dental anomalies can usually be identified with the high resolution (0.2 mm voxel) scan.
Both large and limited volume cone beam scanners are commercially available. The i-CAT scanner can be considered as a large volume scanner since it is able to image most of the maxillofacial skeleton. Limiting the FOV to the ROI has been shown to limit the radiation dose to the patient and therefore should be recommended when performing CBCT scans.14
Conclusion
When comparing various sets of data from different researchers, we support the need for very careful control of the measurement conditions. However, the authors feel it is inevitable that the natural variation found in the human tissue anatomical phantoms often used in these studies will always result in differences between groups. There may also be differences in handling of data between groups and so it would be prudent to use the same standardized experimental protocol and fractionations from a previous publication as done here.
Using the new generation of i-CAT CBCT scanner, the effective dose is lower than the original generation machine for a similar FOV using the current ICRP 2007 tissue weighting factors24 and thus reduces the risk to the patient. The reasons for this decrease in effective dose could be due to a reduction in the scanning time and therefore less absorbed dose to the TLDs during the experimental set-up, contributing to a lower overall effective dose to the patient. It is advised that the FOV should be limited to the ROI to further reduce the dose and therefore reduce the risk to the patient.
Acknowledgment
The authors are grateful to staff at the Department of Medical Physics Guy's and St Thomas' NHS Foundation Trust and the staff at King's College London Dental Institute for allowing use of facilities for the research.
References
- 1.Guerrero ME, Jacobs R, Loubele M, Schutyser F, Suetens P, van Steenberghe D. State-of-the-art on cone beam CT imaging for preoperative planning of implant placement. Clin Oral Invest 2006;10:1–7 [DOI] [PubMed] [Google Scholar]
- 2.Heiland M, Schulze D, Rother U, Schmelzle R. Postoperative imaging of zygomaticomaxillary complex fractures using digital volume tomography. J Oral Maxillofac Surg 2004;62:1387–1391 [DOI] [PubMed] [Google Scholar]
- 3.Ziegler CM, Woertche R, Brief J, Hassfeld S. Clinical indications for digital volume tomography in oral and maxillofacial surgery. Dentomaxillofac Radiol 2002;31:126–130 [DOI] [PubMed] [Google Scholar]
- 4.Patel S, Dawood A, Pitt Ford T, Whaites E. The potential applications of cone beam computed tomography in the management of endodontic problems. Int Endod J 2007;40:818–830 [DOI] [PubMed] [Google Scholar]
- 5.Cevidanes LH, Bailey LJ, Tucker GR, Jr, Styner MA, Mol A, Philips CL, et al. Superimposition of 3D cone-beam CT models of orthognathic surgery patients. Dentomaxillofac Radiol 2005;34:369–375 [DOI] [PMC free article] [PubMed] [Google Scholar]
- 6.Cevidanes LH, Bailey LJ, Tucker SF, Styner MA, Mol A, Philips CL, et al. Three-dimensional cone-beam computed tomography for assessment of mandibular changes after orthognathic surgery. Am J Orthod Dentofacial Orthop 2007;131:44–50 [DOI] [PMC free article] [PubMed] [Google Scholar]
- 7.Holberg C, Steinhauser S, Geis P, Rudzki-Janson I. Cone-beam computed tomography in orthodontics: benefits and limitations. J Orofac Orthop 2005;66:434–444 [DOI] [PubMed] [Google Scholar]
- 8.Kau CH, Richmond S, Palomo JM, Hans MG. Three-dimensional cone beam computerized tomography in orthodontics. J Orthod 2005;32:282–293 [DOI] [PubMed] [Google Scholar]
- 9.Mah J, Enciso R, Jorgensen M. Management of impacted cuspids using 3-D volumetric imaging. J Calif Dent Assoc 2003;31:835–841 [PubMed] [Google Scholar]
- 10.Sukovic P. Cone beam computed tomography in craniofacial imaging. Orthod Craniofac Res 2003;Discussion 6 Suppl 1:179–182; 31–36 [DOI] [PubMed] [Google Scholar]
- 11.Wortche R, Hassfeld S, Lux CJ, Mussig E, Hensley FW, Krempien R, et al. Clinical application of cone beam digital volume tomography in children with cleft lip and palate. Dentomaxillofac Radiol 2006;35:88–94 [DOI] [PubMed] [Google Scholar]
- 12.Ludlow JB, Davies-Ludlow LE, Brooks SL. Dosimetry of two extraoral direct digital imaging devices: NewTom cone beam CT and Orthophos Plus DS panoramic unit. Dentomaxillofac Radiol 2003;32:229–234 [DOI] [PubMed] [Google Scholar]
- 13.Ludlow JB, Ivanovic M. Comparative dosimetry of dental CBCT devices and 64-slice CT for oral and maxillofacial radiology. Oral Surg Oral Med Oral Pathol Oral Radiol Endod 2008;106:106–114 [DOI] [PubMed] [Google Scholar]
- 14.SedentextCT Project Radiation Protection: Cone Beam CT for Dental and Maxillofacial Radiology. Provisional guidelines. 2009: Available from: http://www.sedentexct.eu/system/files/sedentexct_project_provisional_guidelines.pdf Accessed 15 February 2011
- 15.Isaacson KG, Thom AR, Horner K, Whaites E. Orthodontic Radiographs Guidelines (3rd edn) London: British Orthodontic Society, 2008 [Google Scholar]
- 16.Ludlow JB, Davies-Ludlow LE, Brooks SL, Howerton WB. Dosimetry of 3 CBCT devices for oral and maxillofacial radiology: CB Mercuray, NewTom 3G and i-CAT. Dentomaxillofac Radiol 2006;35:219–226 [DOI] [PubMed] [Google Scholar]
- 17.Iwai K, Arai Y, Hashimoto K, Nishizawa K. Estimation of effective dose from limited cone beam X-ray CT examination. Dent Radiol 2000;40:251–259 [Google Scholar]
- 18.Tsiklakis K, Donta C, Gavala S, Karayianni K, Kamenopoulou V, Hourdakis C. Dose reduction in maxillofacial imaging using low dose cone beam CT. Eur J Radiol 2005;56:413–417 [DOI] [PubMed] [Google Scholar]
- 19.Loubele M, Bogaerts R, Van Dijck E, Pauwels R, Vanheusden S, Suetens P, et al. Comparison between effective radiation dose of CBCT and MSCT scanners for dentomaxillofacial applications. Eur J Radiol 2009;71:461–468 [DOI] [PubMed] [Google Scholar]
- 20.Roberts JA, Drage NA, Davies J, Thomas DW. Effective dose from cone beam CT examinations in dentistry. Br J Radiol 2009;82:35–40 [DOI] [PubMed] [Google Scholar]
- 21.Imaging Sciences International i-CAT® Cone beam volumetric tomography and panoramic dental imaging system operator's manual. Hatfield, PA: ISI, 2007 [Google Scholar]
- 22.Institute of Physics and Engineering in Medicine Report 91. Recommended standards for the routine performance testing of diagnostic X-ray imaging systems. London: IPEM, 2005 [Google Scholar]
- 23.International Commission on Radiological Protection Recommendations of the International Commission on Radiological Protection. ICRP Publication 60. Ann ICRP 1991;21:1–201 [PubMed] [Google Scholar]
- 24.International Commission on Radiological Protection Recommendations of the International Commission on Radiological Protection. ICRP Publication 103. Ann ICRP 2007;37:1–332 [DOI] [PubMed] [Google Scholar]
- 25.Scarfe WC, Farman AG. What is cone-beam CT and how does it work? Dent Clin North Am 2008;52:707–730 [DOI] [PubMed] [Google Scholar]