

Abstract
Objective
The aim of this study was to assess the reliability and reproducibility of angular and linear measurements of conventional and digital cephalometric methods.
Methods
A total of 13 landmarks and 16 skeletal and dental parameters were defined and measured on pre-treatment cephalometric radiographs of 30 patients. The conventional and digital tracings and measurements were performed twice by the same examiner with a 6 week interval between measurements. The reliability within the method was determined using Pearson's correlation coefficient (r2). The reproducibility between methods was calculated by paired t-test. The level of statistical significance was set at p < 0.05.
Results
All measurements for each method were above 0.90 r2 (strong correlation) except maxillary length, which had a correlation of 0.82 for conventional tracing. Significant differences between the two methods were observed in most angular and linear measurements except for ANB angle (p = 0.5), angle of convexity (p = 0.09), anterior cranial base (p = 0.3) and the lower anterior facial height (p = 0.6).
Conclusion
In general, both methods of conventional and digital cephalometric analysis are highly reliable. Although the reproducibility of the two methods showed some statistically significant differences, most differences were not clinically significant.
Keywords: cephalometry, radiography, reproducibility of results
Introduction
Cephalometric radiography is an essential tool in the diagnosis and treatment of dental malocclusions and underlying skeletal discrepancies. The use of serial cephalometric radiographs makes it possible to study and predict growth, orthodontic treatment progress and surgical outcome of dentofacial deformity treatment.1-3
Conventional cephalometric analysis is performed by tracing radiographic landmarks on acetate overlays and measuring linear and angular values. Despite its widespread use in orthodontics, the technique is time-consuming and has the disadvantage of being subject to random and systematic error. The main sources of errors include technical measurements, radiographic acquisition and identifying landmarks. Most errors occur in landmark identification and are influenced by clinician experience, landmark definition, image density and sharpness.4-6 The reduction of a three-dimensional (3D) structure to a two-dimensional (2D) image adds to the difficulty.7
With the rapid evolution of computer radiography, digital tracing has slowly replaced the manual tracing methods. Three techniques are commonly reported:8 the first uses digitizer pads for tracing conventional cephalometric films and software programs to compute the measurements; the second uses scanners or digital cameras to export cephalometric images to measurement programs; and the third transmits digital radiographs directly to a computer database. The use of both digital radiography and conversion of manual film to a digital format offers several advantages—it is easy to use, allows several analyses to be performed at a time, promises convenience when generating treatment predictions,9 takes up less storage space,10 allows superimposition of images,11 provides the option to manipulate the size and contrast of the image and provides the ability to archive and improve access to images to overcome the problem of film deterioration, which has been a major source of information loss in craniofacial biology.7,12,13 Moreover, patients benefit from reduced radiation dose and elimination of chemicals and associated environmental hazards if a direct digital cephalograph is used for image capture. However, several drawbacks are also present, such as difficulty in landmark identification related to the 2D representation of a 3D structure, superimposition of bilateral structures and the need for a digital cephalometric radiographic machine as well as a software program. Furthermore, the quality of digital images is affected by their resolution, pixel size, shades of grey (bit) and compression format.7
Many offices worldwide have not yet switched to the use of direct digital cephalographs; therefore, the digitization process of conventional films is the only option if the benefits of digital cephalometric analysis are to be anticipated. Various studies have been conducted to compare the accuracy of digitized, scanned and digitally obtained radiographs with conventional methods.7,9,13-23 Few of them have compared angular and linear measurements, mostly because the analysis of the reproducibility of lines and angles is more challenging in relation to multiple sources of error than landmarks studies.9,14,24 However, results of comparisons of digitizing methods with conventional radiographs are contradictory (Table 1), probably because of the variety in the methods of obtaining digital images and the use of different cephalometric softwares. The literature would benefit from more data with direct clinical applications and an answer to whether a digital cephalometric analysis provides a diagnostic product equivalent to the conventional one. Therefore, the aim of this study was to assess the differences of angular and linear measurements of conventional and digital (using scanned conventional radiographs) cephalometric methods in terms of reliability of repeated measurements within each method (intraexaminer error) and reproducibility of measurements between the two methods.
Table 1. The published reports on different computerized methods.
| Authors | Year | Aim | Sample size | Methods | Digital tracing software | Results (+/−) |
| Oliver21 | 1991 | M | 5 | Manual tracing method vs digitized conventional imagea and digitalized video imageb | CC ISI | + |
| Macri and Wenzel25 | 1993 | L | 20 | Digitized conventional imagea vs digitalized video imageb | Computerized cephalometric program | + |
| Nimkarn and Miles26 | 1995 | M | 40 | Manual tracing method vs digitalized video imageb | Quick Ceph (Quick Ceph System, Inc., San Diego, CA) | + |
| Lim and Foong29 | 1997 | L | 20 | Manual tracing method vs storage phosphor imagec | + | |
| Geelen et al17 | 1998 | L | 19 | Manual tracing method vs storage phosphor imagec (Sandwich technique) | Computerized cephalometric program | + |
| Chen et al15 | 2000 | L | 10 | Manual tracing method vs scanned digital imaged | Customized software program | + |
| Turner and Weerakone28 | 2001 | L | 25 | Digitized conventional imagea vs scanned digital imaged | Customized software program | + |
| Ongkosuwito et al9 | 2002 | M | 20 | Manual tracing method vs scanned digital imaged | AOCeph™ (American Orthodontics, Sheboygan, WI) | + |
| Gregston et al19 | 2004 | M | 10 | Manual tracing method vs scanned digital imaged and storage phosphor image (Sandwich technique) | Dolphin (Dolphin Imaging, Chatsworth, CA) and Vistadent™ (GAC TechnoCenter, Bohemia, NY) | + |
| Gossett et al18 | 2005 | M | 31 | Manual tracing method vs scanned digital imaged | Dolphin | + |
| Power et al24 | 2005 | M | 60 | Manual tracing method vs scanned digital imaged | Dolphin | + |
| Santoro et al7 | 2006 | M | 50 | Manual tracing method vs storage phosphor imagec(Sandwich technique) | Dolphin | + |
| Bruntz et al14 | 2006 | M | 30 | Manual tracing method vs scanned digital imaged | Dolphin | + |
| Sayisu et al13 | 2007 | M | 30 | Manual tracing method vs scanned digital imaged | Dolphin | − |
| Celik et al23 | 2009 | M | 125 | Manual tracing method vs digitized conventional imagea and direct digital imagec | JOE (Rocky Mountain Orthodontics, Denver, Co) Vistadent | + |
| Polat-Ozsoy et al8 | 2009 | M | 30 | Manual tracing method vs direct digital imagec | Vistadent | + |
| Naoumova and Lindman20 | 2009 | L + M | 30 | Manual tracing method vs scanned digital imaged | FACAD (Ilexis AB, Linköping, Sweden) | + |
| Uysal et al22 | 2009 | M | 100 | Manual tracing method vs scanned digital imaged | Dolphin | + |
L, evaluate the landmarks location; M, evaluate the measurements
a Digitizing of conventional radiograph (direct image or tracing paper) using digitizer pad
b Export image using digital camera and projected on screen
c Transmitting digital radiographs to computer database and projected on screen directly
d Scanned a conventional radiograph into digital software program and projected on screen
+ Statistically significant difference in one or more variables
− No statistically significant differences
Materials and methods
The study was conducted on pre-treatment cephalometric radiographs of 30 patients collected from the archives of the outpatient clinic of the orthodontics department, Al-Azhar University, Cairo, Egypt. No differentiation was made for age or gender. The study was approved by the ethical committee of the Faculty of Dental Medicine, Al-Azhar University, Cairo, Egypt. Only good-quality radiographs without any artefacts were selected. The same machine was used to obtain all the radiographs, and cases were excluded if:
The cephalogram showed gross asymmetry or that the patient was not properly positioned as shown by ear rod markers;
The landmarks on the cephalograms could not be identified because of motion, resolution or lack of contrast;
The cephalogram showed craniofacial deformity or excess soft tissues that could interfere with locating the anatomical points;
Bilateral anatomical structures did not show good superimposition about the mid-sagittal plane.
All participants were positioned in the cephalostat with the sagittal plane at a right angle to the path of the X-rays, the Frankfort plane parallel to the floor, the teeth in centric occlusion and the lips sealed lightly together. The conventional and digital tracings as well as all the measurements were performed by the third investigator who was an experienced orthodontist with many years of cephalometric experience. Manual tracing was performed on fine-grain 0.003 inch transparent acetate papers using a 0.3 mm lead pencil. The tracing process was performed in a dark room using a screen viewing box. The selected landmarks were traced with bilateral structures averaged to make a single structure or landmark. All measurements were carried out manually and entered into an Excel spreadsheet (Microsoft, Seattle, WA) for statistical evaluation.
The radiographs were then scanned with the Dolphin ruler (Dolphin Imaging, Chatsworth, CA) into JPEG digital format using a scanner (Epson Perfection V700 Photo, Long Beach, CA) at 300 dpi resolution and an 8-bit greyscale. The digital tracing was done using Dolphin Imaging Software Version 11 (Dolphin Imaging). Once captured using the software, calibration of the actual size of each image in millimetres was based on the measurement of the known distance (100 mm) between the two fixed points of the Dolphin ruler on the screen. This calibration standardized all images. Landmark identification was carried out manually on digital images using a mouse-driven cursor and then stored in the Dolphin Imaging archive. A total of 13 landmarks were defined on each cephalogram (Figure 1) and 16 selected skeletal and dental parameters were measured (Table 2 and Figure 2).
Figure 1.
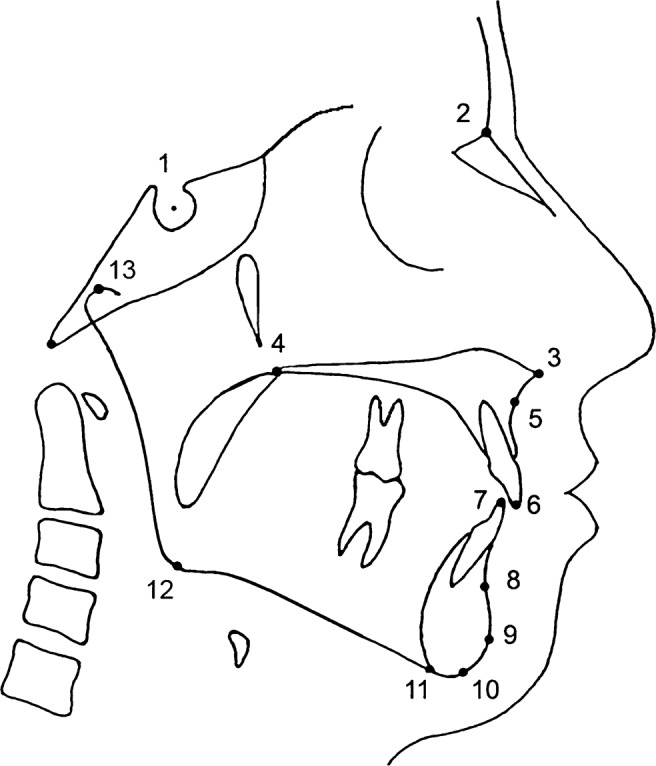
Cephalometric landmarks used in the study, 1, Sella (S); 2, Nasion (N); 3, Anterior nasal spine (ANS); 4, Posterior nasal spine (PNS); 5, Point-A (subnasal); 6, Incisor superius (Is); 7, Incisor inferius (Ii); 8, Point-B (supramental); 9, Pogonion (Pg); 10, Gnathion (Gn); 11, Menton (Me); 12, Gonion (Go); 13, Condylion (Co)
Table 2. Cephalometric skeletal and dental measurements.
| Skeletal angular measurements (Figure 2a) | |
| SNA | Anteroposterior position of the maxilla relative to the anterior cranial base |
| SNB | Anteroposterior position of the mandible relative to the anterior cranial base |
| ANB | The difference between SNA and SNB angles and defines the mutual relationship in the sagittal plane of the maxillary and mandibular bases |
| Angle of convexity | The angle formed by the intersection of the N-A-point to A-point—pogonion It reveals the convexity (or concavity) of the skeletal profile |
| SN-MP | The angle formed between the SN plane and the mandibular plane |
| SN-PP | The angle formed between the SN plane and the palatal plane |
| PP-MP | The angle formed between the palatal plane and the mandibular plane |
| Gonial angle | The angle between mandibular plane and ramal plane |
| Dental angular measurements: (Figure 2b) | |
| Upper incisor to SN (1/-SN) | The angle formed between the long axis of upper central incisor and the anterior cranial base |
| Lower incisor to mandibular plane (/1-MP) | The angle formed between long axis of lower central incisor and the mandibular plane |
| Skeletal linear measurements: (Figure 2c) | |
| Anterior cranial base (N-S) | The linear distance from sella turcica and anterior point of the frontonasal suture |
| Mandibular body length (Go-Gn) | Linear distance from gonion and gnathion |
| Maxillary length (ANS-PNS) | Linear distance from ANS to PNS |
| Co-ANS | The linear distance from condylion to anterior nasal spine. It represents the effective mid-facial length |
| Co-Gn | The linear distance from condylion to the gnathion. It represents the effective mandibular length |
| LAFH (ANS-Me) | The lower anterior facial height, linear distance from ANS to menton |
ANS, anterior nasal spine; Co, condylion; Gn, gnathion; Go, gonion; LAFH, lower anterior facial height; Me, menton; MP, mandibular plane; N, nasion; PNS, posterior nasal spine; PP, palatal plane; S, Sella
Figure 2.

Cephalometric measurements used in the study: (a) Skeletal angular measurements: 1, SNA; 2, SNB; 3, ANB; 4, angle of convexity; 5, SN–mandibular plane (MP); 6, SN–palatal plane (PP); 7, PP–MP; 8, gonial angle. (b) Dental angular measurements: 1, 1–SN; 2, 1–MP. (c) Skeletal linear measurements: 1, nasion–sella; 2, condylion (Co)–anterior nasal spine (ANS); 3, ANS–posterior nasal spine; 4, Co–gnathion (Gn); 5, gonion–Gn; 6, ANS–menton
All 30 radiographs were retraced manually and digitally at a 6 week interval for investigating the reliability (intraexaminer error) and the reproducibility for the manual and digital methods. The same scanned images were analysed on both occasions to avoid introducing additional errors in scanning and orientation on the Frankfort horizontal.
Statistical analysis
Data were analysed with the Statistical Package for Social Sciences (SPSS Inc., Chicago, IL), version 16. The mean, standard deviation (SD) and standard error (SE) of the difference between the repeated measurements for each method and between the two methods were calculated. The reliability was determined using Pearson's correlation coefficient (r2). These levels were used to determine the strength of the correlation: r2 > 0.8 = strong; 0.5 ≤ r2 ≤ 0.8 = moderate; r2 < 0.5 = weak. The reproducibility was calculated by paired measurement comparisons with t-test. The level of statistical significance was set at p < 0.05.
Results
The reliability of repeated measurements by a single investigator (intraexaminer error) for the two methods was investigated. The mean differences, SD and r2 for each of the 16 measurements of conventional and digital methods are shown in Table 3. The highest magnitude of the difference between the first and second tracings was 1.3 mm and 0.7° for conventional tracings and 1.7 mm and 0.6° for the digital method. Variability of the differences was reflected in the correlation coefficients. In general, the correlation coefficients of all measurements for the 2 methods were above 0.90 (strong correlation), except maxillary length, which had a correlation of 0.82 for conventional tracing. Overall, as indicated by the correlation coefficients, reliability was good and intraexaminer error was small.
Table 3. Mean differences, standard deviation and correlation coefficient (intraexaminer error) for repeated measurements of conventional and digital tracing.
| Measurements | Conventional tracing |
Digital tracing |
||
| Difference (mean ± SD) | Correlation coefficient* | Difference (mean ± SD) | Correlation coefficient* | |
| Angular (°) | ||||
| SNA | −0.03 ± 0.7 | 0.98 | 0.6 ± 1.6 | 0.93 |
| SNB | −0.4 ± 1.2 | 0.94 | 0.1 ± 0.9 | 0.97 |
| ANB | 0.4 ± 1.4 | 0.92 | 0.5 ± 1.3 | 0.91 |
| Angle of convexity | −0.04 ± 0.7 | 0.99 | −0.0007 ± 1.1 | 0.99 |
| SN-MP | −0.2 ± 0.8 | 0.99 | 0.07 ± 0.5 | 0.99 |
| SN-PP | 0.7 ± 0.9 | 0.98 | −0.6 ± 1.3 | 0.96 |
| PP-MP | −0.3 ± 0.8 | 0.99 | 0.01 ± 0.4 | 0.99 |
| Gonial angle | −0.1 ± 0.7 | 0.99 | 0.007 ± 0.4 | 0.99 |
| 1/-SN | −0.2 ± 0.9 | 0.99 | −0.1 ± 0.9 | 0.99 |
| /1-MP | 0.4 ± 1.3 | 0.99 | −0.2 ± 0.8 | 0.99 |
| Linear (mm) | ||||
| Anterior cranial base (N-S) | 0.3 ± 0.9 | 0.97 | −0.1 ± 0.7 | 0.98 |
| Mandibular length (Go-Gn) | −1.3 ± 1.6 | 0.94 | 1.7 ± 1.9 | 0.94 |
| Maxillary length (ANS-PNS) | 0.6 ± 2.5 | 0.82 | −1 ± 2.1 | 0.91 |
| Co-ANS | 1.3 ± 1.5 | 0.96 | −0.8 ± 1.3 | 0.96 |
| Co-Gn | 0.6 ± 1.2 | 0.98 | −0.7 ± 1.0 | 0.99 |
| LAFH (ANS-Me) | 0.1 ± 0.7 | 0.99 | −0.4 ± 1.3 | 0.98 |
ANS, anterior nasal spine; Co, condylion; Gn, gnathion; Go, gonion; LAFH, lower anterior facial height; Me, menton; MP, mandibular plane; N, nasion; PNS, posterior nasal spine; PP, palatal plane; S, sella; SD, standard deviation
* Pearson's correlation coefficient (r2): r2 > 0.8 = strong; 0.5 ≤ r2 ≤ 0.80 = moderate; r2 < 0.5 = weak
The comparison between the measurements of the conventional and digital methods is shown in Table 4. Significant differences between the two methods were observed in most of the angular and linear measurements, except for the angular measurements of the ANB angle (p = 0.5) and the angle of convexity (p = 0.09), and the linear measurements of the anterior cranial base (p = 0.3) and the lower anterior facial height (LAFH) (p = 0.6). In general, the highest magnitude of the difference between sample means was 2.9 mm and 1.2°. The SE values were mainly less than 0.5 (millimetres or degrees according to the measurement).
Table 4. Mean differences, SD, SE and paired t-test for comparison between conventional and digital tracing.
| Measurements | Conventional tracing |
Digital tracing |
Difference |
P-value | ||
| (mean ± SD) | (mean ± SD) | Mean | SD | SE | ||
| Angular (°) | ||||||
| SNA | 78.3 ± 3.3 | 79.3 ± 3.6 | −1.0 | 1.4 | 0.3 | 0.0001*** |
| SNB | 76.2 ± 3.6 | 77.4 ± 3.6 | −1.2 | 1.2 | 0.2 | 0.0001*** |
| ANB | 2.1 ± 3.4 | 1.9 ± 3.2 | 0.2 | 1.4 | 0.2 | 0.5 |
| Angle of convexity | 4.1 ± 6.0 | 4.5 ± 6.3 | −0.4 | 1.3 | 0.2 | 0.09 |
| SN-MP | 41.8 ± 6.5 | 42.4 ± 6.3 | −0.6 | 1.0 | 0.2 | 0.002** |
| SN-PP | 8.3 ± 3.9 | 7.4 ± 3.8 | 0.9 | 0.9 | 0.2 | 0.0001*** |
| PP-MP | 34.6 ± 6.6 | 35.7 ± 6.5 | −1.1 | 1.3 | 0.2 | 0.0001*** |
| Gonial angle | 131.6 ± 6.3 | 132.5 ± 7.0 | −0.9 | 1.5 | 0.3 | 0.003** |
| 1/-SN | 103.9 ± 7.4 | 104.5 ± 7.0 | −0.6 | 1.1 | 0.2 | 0.006** |
| /1-MP | 84.7 ± 7.8 | 84.1 ± 7.9 | 0.6 | 1.1 | 0.2 | 0.005** |
| Linear (mm) | ||||||
| Anterior cranial base (N-S) | 70.3 ± 4.3 | 70.1 ± 4.5 | 0.2 | 1.4 | 0.2 | 0.3 |
| Mandibular length (Go-Gn) | 77.7 ± 4.5 | 80.0 ± 4.8 | −2.3 | 1.7 | 0.3 | 0.0001*** |
| Maxillary length (ANS-PNS) | 50.9 ± 3.6 | 49.8 ± 4.0 | 1.1 | 2.2 | 0.4 | 0.01* |
| Co-ANS | 87.9 ± 4.8 | 85.0 ± 4.7 | 2.9 | 2.5 | 0.5 | 0.0001*** |
| Co-Gn | 118.8 ± 6.8 | 116.5 ± 7.3 | 2.3 | 1.9 | 0.4 | 0.0001*** |
| LAFH (ANS-Me) | 74.1 ± 7.5 | 74.0 ± 7.1 | 0.1 | 1.5 | 0.3 | 0.6 |
ANS, anterior nasal spine; Co, condylion; Gn, gnathion; Go, gonion; LAFH, lower anterior facial height; Me, menton; MP, mandibular plane; N, nasion; PNS, posterior nasal spine; PP, palatal plane; S, sella; SD, standard deviation; SE, standard error
* p < 0.05, ** p < 0.01, *** p < 0.001
Discussion
The accuracy of cephalometric analysis is essential so that the clinician can assess the results and provide the patient with various treatment options and outcomes. Until recently, conventional tracings were considered the best method for accurate cephalometric analysis. Nowadays, the widespread use of computerized software programs has highlighted the need to evaluate their consistency and compare them with conventional tracing methods. The present study compared the digital and conventional tracing methods in terms of the reliability (agreement between two measurements of the same object) as well as reproducibility (agreement between two measurements of two methods).24 Landmark identification, which is considered the major source of error, is greatly affected by operator experience. Because the interexaminer error in general is greater than intraexaminer error,13 in this study all the landmark identification, tracing and measuring were carried out by one examiner to minimize error.
According to Santoro et al,7 any investigation aiming to demonstrate the consistency of digital cephalometrics should focus on several significant factors, such as the use of measurements instead of landmarks as well as the sources of error. In our study, the use of measurements was preferred to landmark identification because the measurements are the end product of the cephalometric tracing process and provide data for treatment planning, and also because the differences in landmark location used in combination to generate measurements might cancel each other out or increase the magnitude of the discrepancy.7,9 Regarding the source of error, landmark identification on digital images was carried out manually using a mouse-driven cursor and the measurements were determined automatically by the software. If the films are scanned and transferred to digital format as in this study, the quality of the original film is one of the most important criterion in the validity of the result.13,25 Ongkosuwito et al9 stated that digital pictures that originate from poor-quality analogue cephalometric radiographs oftenappear even poorer on screen and consequently influence landmark identification. However, the results of our study on reliability of conventional measurements were similar to those obtained in other studies and confirm the acceptable quality of the films used.15,17 Errors with the digital technique can also result from using digital radiographs with unknown formats and unknown grey shades.21,25,26 In the present study, radiographs were scanned in standard resolution (300 dpi) with an 8-bit greyscale. Image quality of a cephalogram scanned in standard resolution is comparable to conventional cephalograms, while a high-resolution (600 dpi) version does not show better results and a greyscale less than 7-bit may lead to unreliable decisions on reproducibility of measurements.9 However, this study, which provides a compilation of all sources of errors, shows high reliability within each technique.
Intraexaminer error (reliability) of angular and linear measurements was assessed using r2. Overall, error analysis (Table 3) showed a high correlation between repeated measurements of the conventional and the digital tracings (r2 > 0.8 = strong), indicating that the investigator had no difficulty in correctly repeating measurements and the landmarks were easily identifiable in each method. The findings correspond well with previous studies that exhibited high reliability of the measurements.7,15,17,20 The only level of correlation below 0.90 was found for maxillary length (anterior nasal spine (ANS)–posterior nasal spine (PNS)), which was still strong; the conventional measurement (r2 = 0.82) revealed less reliability than the digital measurement (r2 = 0.91). This could be attributed to identification of the landmark ANS, which is often affected by the superimposition of other anatomical structures and has shown poor consistency.27 However, ANS was also used in other measurements, such as condylion (Co)-ANS, and the measurements showed good reliability. A similar observation on a different measurement using the same landmark was reported by Santoro et al.7
In the present study, the magnitude of the differences was small within both methods and the differences of the angular measurements had little clinical significance. These small differences could be explained because on-screen digitization does not allow identification of the landmarks located on a curve and those constructed by bisecting different reference planes compared with manual tracing. It could also be owing to the flashing cursor (used for digitizing) changing its greyscale value to the opposite of the background image as it is moved over the screen and failing to contrast significantly with the background, making the landmarks such as the sella point indistinct.28 It is also possible that the cursor design obscures some landmark identification.6,24
The comparison between the digital and the conventional methods displayed statistically significant differences for 12 cephalometric measurements (Table 4). A good agreement was reported between the present finding and other results.7,8,15 Chen et al15 in their study on digitized and conventional cephalometric measurements showed statistically significant differences between all skeletal and dental measurements. However, these differences could be explained by landmark identification. Previous studies on conventional and computerized methods have found difficulties in locating the landmarks porion (Po), ANS, Co, gonion (Go), gnathion (Gn) and menton (Me).1,7-9, 19, 27 Others1,29 expressed the tracing difficulties of the incisor position and variation in incisor angular measurements between tracing methods. Sekiguchi and Savara30 indicated that nasion (N) may be difficult to identify when the nasofrontal suture is not accurately visualized. Santoro et al7 and Chen et al15 stated that Go identification is difficult owing to a poorly defined anatomical outline, a double image and localization away from the mid-sagittal plane. In this study, the intraexaminer reliability was high in both tracing methods, suggesting that the landmark identification was relatively uncomplicated. The non-correspondence between conventional and digital values could be attributed to the investigator identifying some anatomical structures differently when projected on screen, even if they could be repeated consistently in each method. Although a lack of calibration between images could also contribute to error, in this study calibration was standardized for all images. In general, this study confirms the reliability of both conventional and scanned digital cephalometric analysis until orthodontic offices switch to direct digital imaging, which provides many advantages. Further evaluation studies with larger samples will benefit the user's knowledge about this technology.
In conclusion, both the digital (scanning a conventional film into digital format) and conventional cephalometric methods are reliable in daily orthodontic routines. The statistically significant differences between the digitized and conventional tracing techniques do not appear to be clinically significant.
References
- 1.Baumrind S, Frantz RC. The reliability of head film measurements. 2. Conventional angular and linear measures. Am J Orthod 1971;60:505–517 [DOI] [PubMed] [Google Scholar]
- 2.Ricketts RM. Perspectives in the clinical application of cephalometrics. The first fifty years. Angle Orthod 1981;51:115–150 [DOI] [PubMed] [Google Scholar]
- 3.Vig KD, Ellis E., 3rd Diagnosis and treatment planning for the surgical-orthodontic patient. Dent Clin North Am 1990;34:361–384 [PubMed] [Google Scholar]
- 4.Cohen AM. Uncertainty in cephalometrics. Br J Orthod 1984;11:44–48 [DOI] [PubMed] [Google Scholar]
- 5.Cooke MS, Wei SH. Cephalometric errors: a comparison between repeat measurements and retaken radiographs. Aust Dent J 1991;36:38–43 [DOI] [PubMed] [Google Scholar]
- 6.Sandler PJ. Reproducibility of cephalometric measurements. Br J Orthod 1988;15:105–110 [DOI] [PubMed] [Google Scholar]
- 7.Santoro M, Jarjoura K, Cangialosi TJ. Accuracy of digital and analogue cephalometric measurements assessed with the sandwich technique. Am J Orthod Dentofacial Orthop 2006;129:345–351 [DOI] [PubMed] [Google Scholar]
- 8.Polat-Ozsoy O, Gokcelik A, Toygar Memikoglu TU. Differences in cephalometric measurements: a comparison of digital versus hand-tracing methods. Eur J Orthod 2009;31:254–259 [DOI] [PubMed] [Google Scholar]
- 9.Ongkosuwito EM, Katsaros C, van't Hof MA, Bodegom JC, Kuijpers-Jagtman AM. The reproducibility of cephalometric measurements: a comparison of analogue and digital methods. Eur J Orthod 2002;24:655–665 [DOI] [PubMed] [Google Scholar]
- 10.Vincent AM, West VC. Cephalometric landmark identification error. Aust Orthod J 1987;10:98–104 [PubMed] [Google Scholar]
- 11.Forsyth DB, Davis DN. Assessment of an automated cephalometric analysis system. Eur J Orthod 1996;18:471–478 [DOI] [PubMed] [Google Scholar]
- 12.Melsen B, Baumrind S. Clinical research application of cephalometry. Athanasiou A, editor. Orthodontic cephalometry. St Louis, MO: Mosby-Wolfe, 1995, pp 181–202 [Google Scholar]
- 13.Sayinsu K, Isik F, Trakyali G, Arun T. An evaluation of the errors in cephalometric measurements on scanned cephalometric images and conventional tracings. Eur J Orthod 2007;29:105–108 [DOI] [PubMed] [Google Scholar]
- 14.Bruntz LQ, Palomo JM, Baden S, Hans MG. A comparison of scanned lateral cephalograms with corresponding original radiographs. Am J Orthod Dentofacial Orthop 2006;130:340–348 [DOI] [PubMed] [Google Scholar]
- 15.Chen YJ, Chen SK, Chang HF, Chen KC. Comparison of landmark identification in traditional versus computer-aided digital cephalometry. Angle Orthod 2000;70:387–392 [DOI] [PubMed] [Google Scholar]
- 16.Cohen JM. Comparing digital and conventional cephalometric radiographs. Am J Orthod Dentofacial Orthop 2005;128:157–160 [DOI] [PubMed] [Google Scholar]
- 17.Geelen W, Wenzel A, Gotfredsen E, Kruger M, Hansson LG. Reproducibility of cephalometric landmarks on conventional film, hardcopy and monitor-displayed images obtained by the storage phosphor technique. Eur J Orthod 1998;20:331–340 [DOI] [PubMed] [Google Scholar]
- 18.Gossett CB, Preston CB, Dunford R, Lampasso J. Prediction accuracy of computer-assisted surgical visual treatment objectives as compared with conventional visual treatment objectives. J Oral Maxillofac Surg 2005;63:609–617 [DOI] [PubMed] [Google Scholar]
- 19.Gregston MD, Kula T, Hardman P, Glaros A, Kula K. A comparison of conventional and digital radiographic methods and cephalometric analysis software: I. hard tissue. Semin Orthod 2004;10:204–211 [Google Scholar]
- 20.Naoumova J, Lindman R. A comparison of manual traced images and corresponding scanned radiographs digitally traced. Eur J Orthod 2009;31:247–253 [DOI] [PubMed] [Google Scholar]
- 21.Oliver RG. Cephalometric analysis comparing five different methods. Br J Orthod 1991;18:277–283 [DOI] [PubMed] [Google Scholar]
- 22.Uysal T, Baysal A, Yagci A. Evaluation of speed, repeatability and reproducibility of digital radiography with manual versus computer-assisted cephalometric analyses. Eur J Orthod 2009;31:523–528 [DOI] [PubMed] [Google Scholar]
- 23.Celik E, Polat-Ozsoy O, Toygar Memikoglu TU. Comparison of cephalometric measurements with digital versus conventional cephalometric analysis. Eur J Orthod 2009;31:241–246 [DOI] [PubMed] [Google Scholar]
- 24.Power G, Breckon J, Sherriff M, McDonald F. Dolphin Imaging Software: an analysis of the accuracy of cephalometric digitization and orthognathic prediction. Int J Oral Maxillofac Surg 2005;34:619–626 [DOI] [PubMed] [Google Scholar]
- 25.Macri V, Wenzel A. Reliability of landmark recording on film and digital lateral cephalograms. Eur J Orthod 1993;15:137–148 [DOI] [PubMed] [Google Scholar]
- 26.Nimkarn Y, Miles PG. Reliability of computer-generated cephalometrics. Int J Adult Orthodon Orthognath Surg 1995;10:43–52 [PubMed] [Google Scholar]
- 27.Houston WJ, Maher RE, McElroy D, Sherriff M. Sources of error in measurements from cephalometric radiographs. Eur J Orthod 1986;8:149–151 [DOI] [PubMed] [Google Scholar]
- 28.Turner PJ, Weerakone S. An evaluation of the reproducibility of landmark identification using scanned cephalometric images. J Orthod 2001;28:221–229 [DOI] [PubMed] [Google Scholar]
- 29.Lim KF, Foong KW. Phosphor-stimulated computed cephalometry: reliability of landmark identification. Br J Orthod 1997;24:301–308 [DOI] [PubMed] [Google Scholar]
- 30.Sekiguchi T, Savara BS. Variability of cephalometric landmarks used for face growth studies. Am J Orthod 1972;61:603–618 [DOI] [PubMed] [Google Scholar]