

Abstract
Objective
The aim of this study was to assess bone changes and mobility in temporomandibular joints (TMJs) using cone beam CT (CBCT) in a population sample in Recife, PE, Brazil.
Methods
The TMJ images of patients treated by a radiologist at a private dental radiology service over a period of 1 year were retrieved from the computer database and assessed using a computer with a 21-inch monitor and the iCAT Cone Beam 3D Dental Imaging System Workstation program (Imaging Sciences International, Hatfield, PA). The Pearson χ2 test was used to analyse the differences in percentage of bone changes among the categories of mobility (p ≤ 0.05). The McNemar test was used to compare the presence of bone changes in TMJs on the right and left sides (p ≤ 0.05).
Results
An adjusted logistic regression model was used to assess the effect of age and gender on the occurrence of bone changes (p ≤ 0.05). Bone changes were present in 227 (71%) patients. Age group and gender showed a statistically significant association with presence of bone changes (p ≤ 0.05). There was no significant difference between the right and left sides (p = 0.556) and in condylar mobility (p = 0.925) with regard to the presence of degenerative bone changes.
Conclusions
There is a high prevalence of degenerative bone alteration in TMJs, which is more frequent in women and mostly located in the condyle. The prevalence of degenerative bone changes increases with age. There is no correlation between condylar mobility and the presence of degenerative bony changes in TMJs.
Keywords: temporomandibular joint disorder, temporomandibular joint, cone beam computed tomography, bone diseases
Introduction
Temporomandibular joint disorders (TMDs) are considered a subdivision of musculoskeletal pathologies and are the main source of orofacial pain of non-dental origin.1 The most common clinical signs and symptoms of TMDs are joint pain, muscle pain, mouth-opening limitation, clicking and crepitation.2 TMDs are frequently associated with degenerative bone changes involving the bone structures of the temporomandibular joint (TMJ) such as flattening, erosion, osteophytes, subchondral bone sclerosis and pseudocysts.3 Knowledge about these bone changes is fundamental for correctly diagnosing the dysfunctions associated with the disease and for adequate treatment planning.4
A radiographic examination is part of the clinical assessment routine for conditions of TMJ dysfunction and the main objective is to verify degenerative bone changes in the joint structures and the amplitude of condylar excursion.5 The TMJ can be viewed using panoramic and transcranial radiographs, conventional CT, corrected tomography of the TMJ, cone beam CT (CBCT), MRI and arthrography.6 CT has been the method of choice to assess the contours of the cortical bone and TMJ dynamics. However, it is a high-cost examination and requires a high dose of radiation. CBCT is less costly and the dose of radiation is lower; the amount of radiation varies according to the brand of the appliance and the structure to be imaged. In addition to these advantages, CBCT provides a three-dimensional image of the maxillofacial mineralized tissue with minimal distortion. CBCT has been shown to be efficient in the diagnosis of several bone changes that affect the TMJ.7
However, there are few studies on the prevalence of bone changes in TMJ, particularly using CT. Therefore, the aim of this study was to assess the prevalence of degenerative bone changes in TMJs using CBCT and correlate these with age, gender, type of alteration, side and mobility.
Materials and methods
The Ethics Committee of the Centre of Health Science of The Federal University of Paraíba (UFPB) (protocol no. 319) approved the study. CBCT images of the TMJs of patients who attended a private dental radiology service in Recife, PE, Brazil from June 2007 to May 2008 were retrieved from the computer database and assessed. The sample included TMJ images of 319 patients (250 women and 69 men).
The TMJ images of patients were obtained by the same operator using CBCT (iCAT Classic; Imaging Sciences International, Hatfield, PA) with a 14-bit resolution, operating at 120 kVp, 5 mAs with a voxel of 0.30 mm. The images were obtained in maximum intercuspation and maximum opening. The primary reconstruction of the raw data was restricted to the TMJ region (approximately 1 cm superior to the mandibular fossa and 1 cm inferior to the condylar neck) and a series of axial views of 1 mm thickness were automatically generated. The long axial view of the examined condyle was traced with the TMJ tool and the software generated lateral and frontal cross-sectional reconstructions perpendicular and parallel to the long axis of the condyle, respectively. The thickness of the image slices was 1 mm and the distance between slices was 1 mm for both lateral and frontal reconstructions.
The reconstructions were assessed twice by a radiologist with 5 years' experience in diagnosing changes of bone surfaces of the TMJ on CT images. A minimum interval of 30 days between the evaluations of the same patient was established. If the first and second assessments differed, readings were repeated until a consistent result was obtained. Right and left TMJs were evaluated separately, resulting in a total of 638 TMJs. The TMJ images were assessed using a computer with a 21-inch monitor and the iCAT Cone Beam 3D Dental Imaging System Workstation program (Imaging Sciences International). Age, gender, degree of condylar mobility and osseous changes were recorded on an evaluation sheet for each patient. In order to avoid misinterpretation, bone changes had to be found in at least two consecutive slices. The bone changes evaluated were flattening (a flat bony contour deviating from the convex form), erosion (an area of decreased density of the cortical bone and the adjacent subcortical bone), osteophytes (marginal bony outgrowths on the condyle), sclerosis (an area of increased density of cortical bone extending into the bone marrow)16 and pseudocysts (well-circumscribed osteolytic adjacent subcortical bone area without cortical destruction). The bone changes are shown in Figure 1.
Figure 1.

Lateral slices of the temporomandibular joint (TMJ) in maximum intercuspation. The classification of the condyle morphology was (a) no bone change; (b) osteophyte; (c) flattening; (d) sclerosis; (e) erosion and (f) pseudocyst
Condylar mobility was interpreted using the lateral slices of the TMJ at maximum mouth opening (Figure 2). The condyle mobility was assessed as follows: hypomobility (the condyle situated posteriorly to the articular eminence), normal mobility (condyle just under the articular eminence) and hypermobility (condyle situated anteriorly to the articular eminence).
Figure 2.
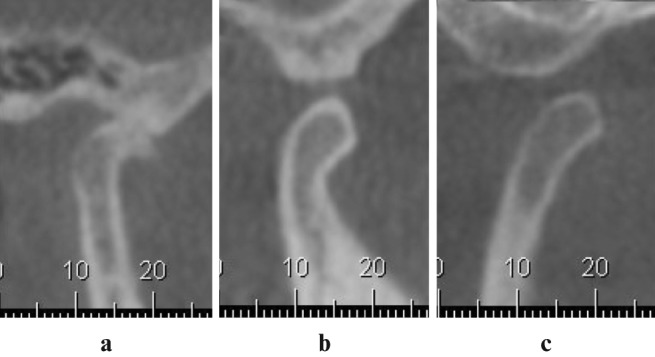
Lateral slices of the temporomandibular joint (TMJ) in maximum opening. The classification of condylar mobility was (a) hypomobility, (b) normal mobility and (c) hypermobility
Data analysis
The data were summarized using the percentage of absolute and relative frequencies. The Pearson χ2 test was used to analyse the differences in percentages of degenerative bone changes among the categories of mobility (p ≤ 0.05). The McNemar test was used to compare the presence of bone changes in TMJs on the right and left sides (p ≤ 0.05). An adjusted logistic regression model was used to assess the effect of age and gender on the occurrence of degenerative bone changes (p ≤ 0.05).
Results
The distribution of patients based on the presence of bone changes in TMJs, gender and age are shown in Table 1. 92 patients (29%) had no bone changes while 227 patients (71%) did. With the exception of patients aged 80–89 years (of whom 58% had bone changes), the prevalence of bone changes increased according to age group. According to the adjusted logistic regression model, age (categorized into age group) and gender showed a statistically significant association with the presence of bone changes (Table 2). Table 3 shows the distribution of bone changes in TMJs based on side (left or right). The results of the McNemar test show that the proportions of TMJ bone changes showed no significant difference between the sides (p = 0.556).
Table 1. Distribution of patients based on the presence of bone changes in temporomandibular joints (TMJ), gender and age.
| Bone changes in TMJ |
Total |
|||||
| Without |
With |
|||||
| n | % | n | % | n | % | |
| Gender | ||||||
| Women | 63 | 25 | 187 | 75 | 250 | 78 |
| Men | 29 | 42 | 40 | 58 | 69 | 22 |
| Total | 92 | 29 | 227 | 71 | 319 | 100 |
| Age group (years) | ||||||
| 10–29 | 21 | 40 | 31 | 60 | 52 | 16 |
| 30–39 | 29 | 31 | 64 | 69 | 93 | 30 |
| 40–49 | 16 | 26 | 46 | 74 | 62 | 19 |
| 50–59 | 11 | 24 | 35 | 76 | 46 | 14 |
| 60–69 | 9 | 24 | 29 | 76 | 38 | 12 |
| 70–79 | 1 | 6 | 15 | 94 | 16 | 5 |
| 80–89 | 5 | 42 | 7 | 58 | 12 | 4 |
| Total | 92 | 29 | 227 | 71 | 319 | 100 |
n, number of patients
Table 2. Result of the adjusted logistic regression model for the presence of temporomandibular joint bone changes based on age and gender.
| Coefficient | Standard error | Z score | p Value | 95% confidence interval (range) | ||
| Age | 0.16 | 0.08 | 1.94 | 0.053 | –0.002 to 0.316 | |
| Gender | –0.78 | 0.29 | –2.72 | 0.006 | –1.341 to –0.218 | |
| Constant | 0.46 | 0.35 | 1.34 | 0.179 | –0.213 to –1.143 |
Table 3. Distribution of bone changes in the temporomandibular joints (TMJ) of 319 patients based on side.
| Right TMJ | Left TMJ |
Total | |
| Bone changes | |||
| Without | With | ||
| Bone changes | |||
| Without | 92 | 33 | 125 |
| With | 39 | 155 | 194 |
| Total | 131 | 188 | 319 |
Table 4 shows the distribution of TMJ bone changes and their combinations according to type. The distribution of bone changes in TMJs on the right and left sides according to mobility are presented in Table 5. The Pearson χ2 test showed that there was no significant difference in the presence or absence of bone changes in relation to condylar mobility (right side, p = 0.925; left side, p = 0.279). Hypomobility of the TMJs on the left side was observed in 74 (23%) TMJs. Hypermobility was found in 111 (35%) of the TMJs on the left side. In relation to the evaluation of the location of bone changes, it was similar for both TMJs (Table 6).
Table 4. Distribution of temporomandibular joint bone changes and their combinations according to type of bone change.
| Bone change | Total |
|
| n | % | |
| Osteophytes | 12 | 3 |
| Erosion | 2 | 0.5 |
| Flattening | 227 | 59 |
| Subchondral bone sclerosis | 5 | 1.3 |
| Ankylosis | 1 | 0.3 |
| Osteophytes and flattening | 109 | 29 |
| Osteophytes and sclerosis | 1 | 0.3 |
| Erosion and flattening | 3 | 0.8 |
| Flattening and sclerosis | 8 | 2.1 |
| Flattening and pseudocysts | 3 | 0.8 |
| Osteophytes, erosion and flattening | 2 | 0.5 |
| Osteophytes, flattening and sclerosis | 3 | 0.8 |
| Osteophytes, flattening and pseudocysts | 5 | 1.3 |
| Osteophytes, flattening, sclerosis and pseudocysts | 1 | 0.3 |
| Total | 382 | 100 |
n, number of patients
Table 5. Distribution of bone changes in temporomandibular joints (TMJ) on the right and left sides according to mobility.
| Mobility | Presence of bone changes in the TMJ |
Total |
||||
| Absence |
Presence |
|||||
| n | % | n | % | n | % | |
| Right sidea | ||||||
| Normal mobility | 56 | 38 | 90 | 62 | 146 | 46 |
| Hypomobility | 32 | 41 | 46 | 59 | 78 | 24 |
| Hypermobility | 37 | 39 | 58 | 61 | 95 | 30 |
| Total | 125 | 39 | 194 | 60 | 319 | 100 |
| Left sideb | ||||||
| Normal mobility | 50 | 37 | 84 | 63 | 134 | 42 |
| Hypomobility | 36 | 49 | 38 | 51 | 74 | 23 |
| Hypermobility | 45 | 59 | 66 | 60 | 111 | 35 |
| Total | 131 | 41 | 188 | 59 | 319 | 100 |
aPearson χ2 = 0.1552, p = 0.925
bPearson χ2 = 2.5504, p = 0.279
n, number of pateints
Table 6. Distribution of location of bone changes in temporomandibular joints (TMJ).
| TMJ | Location |
Total |
||||||||
| Condyle |
Articular eminence |
Condyle + articular eminence |
Condyle + articular eminence + glenoid cavity |
|||||||
| n | % | n | % | n | % | n | % | n | % | |
| Right | 174 | 90 | 3 | 2 | 15 | 8 | 2 | 1 | 194 | 51 |
| Left | 171 | 91 | 2 | 1 | 12 | 6 | 3 | 2 | 188 | 49 |
| Total | 342 | 91 | 5 | 1 | 27 | 7 | 5 | 1 | 382 | 100 |
n, number of patients
Discussion
Several radiographic methods are used to assess degenerative bone changes that affect the TMJ. It is essential to obtain a clear and precise image of the region, but this can be difficult owing to the superimposition of adjacent structures, different angulations of the condyle, limitation of mouth opening in some patients, presence of artefacts and mandibular movements during the examination.8 Owing to the cost and the high dose of radiation, Brooks et al6 suggested that CT of the TMJ region be reserved for evaluation of foreign bodies, cell reaction to silicon or polytetrafluoroethylene sheet implants, suspected tumours, ankylosis and complex facial fractures. In a systematic literature review, Hussain et al9 observed that advances in CT have contributed to increased accuracy in the diagnosis of degenerative bone changes in the TMJ. However, this increase is not significant in relation to corrected conventional tomography.9,10
According to Tsiklakis et al11 and Koyama et al,12 CBCT should be used instead of CT because the dose of radiation to which the patient is exposed is much lower. Furthermore, CBCT is superior to CT for visualizing bone changes in the TMJ, analysing lateral slices in isolation and combining coronal and lateral slices.11-13 Thus, CBCT was the imaging method used in this study.
The sample selected for this study was representative and showed prevalence of bone changes (71%) similar to the study conducted by Koyama et al,12 who verified 63.7% of the joints of patients with TMDs using CT. However, in the study of Capurso et al,14 degenerative bone changes were seen in 19.6% of the 461 patients. The higher prevalence of bone changes in our study may be due to the fact that the sample of patients sent to a private dental radiology service to undergo a CBCT examination of the TMJs had clinical symptoms or signs, such as pain and joint sounds. Also, there were only 2 centres with this image modality in the city of this study, which has 1 561 659 inhabitants.
Osteoarthritis of TMJs is more frequent in women than in men.15,16 In our study, 78% of the patients were female and 22% were male. LeResche15 found that pain in the temporomandibular region is twice as common in women than in men. The greater occurrence in women may be explained by the hormonal influences of oestrogen and prolactin, which may exacerbate degradation of cartilage and articular bone in addition to stimulating a series of immunological responses in the TMJ.12,17 Nevertheless, Cruzoé-Rebello et al18 observed that both men and women share the same characteristics with regards to internal derangements and found that hormonal factors do not seem to play a significant role in the manifestation of internal derangements in TMJs.
According to Alexious et al,16 patients in older age groups are expected to have more frequent and severe bone changes than those in younger age groups. In our study, with the exception of patients aged 80–89 years, the prevalence of bone changes increased with age, as reported by Foucart et al,19 who assessed the TMJs of patients with disc displacement without reduction, and in agreement with LeResche,15 who found that pain in the TMJ region occurs in approximately 10% of the population over the age of 18 years. However, Cruzoé-Rebello et al18 and Isberg et al20 did not find an association between increased age and an increase in bone changes; they found that a greater number of individuals aged between 20 and 49 years showed TMJ changes.
When assessing the influence of horizontal angulation on the degenerative bone changes in the TMJ, Cruzoé-Rebello et al18 suggested that one joint influences the other and for that reason they cannot be considered separately, as in the study by Nebbe et al21 and Alexious et al.16 The movements of the mandible are co-ordinated by both joints, which are functionally unified, and the functional unification could justify the high prevalence of bilateral bone changes, as observed by Katzberg22 and in our study. Moreover, in our study, in spite of having a higher prevalence of left-side TMJs with bone changes, the difference was not significant compared with the prevalence on the right side.
According to Campos et al,23 degenerative bone changes are significantly more frequent in the condyle than the articular eminence, which is in agreement with the results of our study. Güler et al24 and Muller-Leisse25 also reported a high prevalence of condylar degenerative changes in patients with internal derangements, as did Hintze et al10 in samples of dried skulls. Degenerative bony changes are characterized by the development of osteophytes, erosion, avascular necrosis, subchondral cysts and intra-articular loose bodies.23,26 These degenerative bone changes are considered radiological findings of osteoarthritis and have been demonstrated in painful TMJs.27,28 In our study, flattening and osteophyte degenerative bone changes were the predominant findings. This was verified by Güler et al24 using MRI in patients who had bruxism, by Alexious et al16 who, using CBCT, found erosion, flattening and osteophytes to be the most common radiographic finding of the condyle and by Campos et al,23 who found osteophytes and erosion to be more prevalent in their MRI study.
In our study, the high prevalence of flattening may be explained by the possibility that this bone change represents an adaptive alteration,18,29 the first change of a progressive disease22 or degenerative change secondary to internal derangement.24,30 Flattening is also considered a degenerative alteration resulting from overload on the TMJ and it may be related to the involvement of the masseter and temporal muscles.12
Osteophytes occur at an advanced stage of degenerative change when the body adapts itself to repair the joint.9 The osteophyte appears to stabilize and widen the surface in an attempt to improve the overload resulting from occlusal forces, representing areas of neo-formed cartilage. Erosion is the initial stage of degenerative changes, indicating that the TMJ is unstable and changes in bone surfaces will occur, probably resulting in changes in occlusion.9 With regard to combinations of bone changes, flattening accompanied by osteophytes was more prevalent in our study, differing from the findings by Güler et al24 in patients with disc displacement with or without reduction. These authors found no flattening or osteophytes in any of the TMJs assessed by MRI. They found only a combination of osteophytes and erosion and osteophytes and sclerosis.
De Coster et al31 found a positive relationship between hypermobility and TMDs. According to Palácios-Moreno,29 Vasconcelos et al32 and Aquotti-Ilha et al,33 condylar mobility is also related to TMDs and therefore this was one of the items assessed in our study. Most patients were found to have normal mobility, followed by hypermobility and hypomobility. Hypermobility is a dysfunction that is usually associated with broader degenerative bone processes with specific symptomatology, such as arthritis, arthrosis, osteoporosis, vertigo and acute headaches.31 However, in our study, when assessing the influence of condylar mobility in the presence of local degenerative bone changes, no correlation was observed, which is similar to the study of Campos et al,23 who found no significant difference in the presence of degenerative bone changes between patients with hypermobility and those with normal mobility on MRI.
In conclusion, women have a greater predisposition to degenerative bone changes in the TMJ. The prevalence of degenerative bone changes increase with age, with the exception of patients over 80 years. Flattening and osteophytes are the most prevalent types of degenerative bone changes. There is no correlation of the prevalence of degenerative bony changes with condylar mobility and the TMJ side.
References
- 1.Mohl ND, Dixon DC. Current status of diagnostic procedures for temporomandibular disorders. J Am Dent Assoc 1994;125:56–64 [DOI] [PubMed] [Google Scholar]
- 2.Bronstein SL, Tomasetti BJ, Ryan DE. Internal derangements of the temporomandibular joint: correlation of arthrography with surgical findings. J Oral Surg 1981;39:572–584 [PubMed] [Google Scholar]
- 3.Mengel R, Kruse B, Flores-de-Jacoby L. Digital volume tomography in the diagnosis of periodontal defects: an in vitro study on native pig and human mandibles. J Periodontol 2005;76:665–673 [DOI] [PubMed] [Google Scholar]
- 4.Hatcher DC, Aboudara CL. Diagnosis goes digital. Am J Orthod Dentofacial Orthop 2004;125:512–515 [DOI] [PubMed] [Google Scholar]
- 5.Greenan RW. Panoramics for the temporomandibular joint. Funct Orthod 1997;14:26–28 [PubMed] [Google Scholar]
- 6.Brooks SL, Brand JW, Gibbs SJ, Hollender L, Lurie AG, Omnell KA, et al. Imaging of the temporomandibular joint: a position paper of the American Academy of Oral and Maxillofacial Radiology. Oral Surg Oral Med Oral Pathol Oral Radiol Endod 1997;83:609–618 [DOI] [PubMed] [Google Scholar]
- 7.Ludlow JB, Davies-Ludlow LE, Brooks SL, Howerton WB. Dosimetry of 3 CBCT devices for oral and maxillofacial radiology: CB Mercuray, NewTom 3G and i-CAT. Dentomaxillofac Radiol 2006;35:219–226 [DOI] [PubMed] [Google Scholar]
- 8.Lascala CA, Panella J, Marques MM. Analysis of the accuracy of linear measurements obtained by cone beam computed tomography. Dentomaxillofac Radiol 2004;33:291–294 [DOI] [PubMed] [Google Scholar]
- 9.Hussain AM, Packota G, Major PW, Flores-Mir C. Role of different imaging modalities in assessment of temporomandibular joint erosions and osteophytes: a systematic review. Dentomaxillofac Radiol 2008;65:63–71 [DOI] [PubMed] [Google Scholar]
- 10.Hintze H, Wiese M, Wenzel A. Cone beam and conventional tomography for the detection of morphological temporomandibular joint changes. Dentomaxillofac Radiol 2007;36:192–197 [DOI] [PubMed] [Google Scholar]
- 11.Tsiklakis K, Syriopoulos K, Stamatakis HC. Radiographic examination of the temporomandibular joint using cone beam computed tomography. Dentomaxillofac Radiol 2004;33:196–201 [DOI] [PubMed] [Google Scholar]
- 12.Koyama J, Nishiyama H, Hayashi T. Follow-up study of condylar bony changes using helical computed tomography in patients with temporomandibular disorder. Dentomaxillofac Radiol 2007;36:472–477 [DOI] [PubMed] [Google Scholar]
- 13.Honey OB, Scarfe WC, Hilgers MJ, Klueber K, Silveira AM, Haskell BS, et al. Accuracy of cone-beam computed tomography imaging of the temporomandibular joint: comparisons with panoramic radiology and linear tomography. Am J Orthod Dentofacial Orthop 2007;132:429–438 [DOI] [PubMed] [Google Scholar]
- 14.Capurso U, Scutellari PN, Orzincolo C. Involvement of the temporomandibular joint in the rheumatoid arthritis. Radiol Med 1996;78:299–304 [PubMed] [Google Scholar]
- 15.LeResche L. Epidemiology of the temporomandibular disorders: implications for the investigation of etiologic factors. Crit Rev Oral Biol Med 1997;8:291–305 [DOI] [PubMed] [Google Scholar]
- 16.Alexiou KE, Stamatakis HC, Tsiklakis K. Evaluation of the severity of temporomandibular joint osteoarthritic changes related to age using cone beam computed tomography. Dentomaxillofacial Radiology 2009;38:141–147 [DOI] [PubMed] [Google Scholar]
- 17.Okuda T. Effect of estrogen replacement on temporomandibular joint remodeling in ovariectomized rats. J Oral Maxillofac Surg 2000;58:189–197 [DOI] [PubMed] [Google Scholar]
- 18.Cruzoé-Rebello IMR, Campos PSF, Rubira IRF, Panella J, Mendes CMC. Evaluation of the relation between the horizontal condylar angle and the internal derangement of the TMJ – a magnetic resonance imaging study. Pesqui Odontol Bras 2003;17:176–182 [DOI] [PubMed] [Google Scholar]
- 19.Foucart JM, Carpentier P, Pajoni D, Marguelles-Bonnet R, Pharaboz C. MR of 732 TMJs: anterior, rotational, partial and sideways disc displacements. Eur J Radiol 1998;28:86–94 [DOI] [PubMed] [Google Scholar]
- 20.Isberg A, Hägglung M, Paesani D. The effect of age and gender on the onset of symptomatic temporomandibular joint disk displacement. Oral Surg Oral Med Oral Pathol Oral Radiol Endod 1998;85:252–257 [DOI] [PubMed] [Google Scholar]
- 21.Nebbe B, Major PW, Prasad NG, Hatcher D. Quantitative assessment of temporomandibular joint disk status. Oral Surg Oral Med Oral Pathol Oral Radiol Endod 1998;85:598–607 [DOI] [PubMed] [Google Scholar]
- 22.Katzberg RW. Temporomandibular joint imaging. Radiology 1989;170:297–307 [DOI] [PubMed] [Google Scholar]
- 23.Campos MI, Campos PS, Cangussu MC, Guimarães RC, Line SR. Analysis of magnetic resonance imaging characteristics and pain in temporomandibular joints with and without degenerative changes of the condyle. Int J Oral Maxillofac Surg 2008;37:529–534 [DOI] [PubMed] [Google Scholar]
- 24.Güler N, Yatmaz PI, Ataoglu H, Emlik D, Uckan S. Temporomandibular internal derangement: correlation of MRI findings with clinical symptoms of pain and joint sounds in patients with bruxing behaviour. Dentomaxillofac Radiol 2003;32:304–310 [DOI] [PubMed] [Google Scholar]
- 25.Müller-Leisse C, Augthun M, Bauer W, Roth A, Günther R. Anterior disc displacement without reduction in the temporomandibular joint: MRI and associated clinical findings. J Magn Reson Imaging 1996;6:769–774 [DOI] [PubMed] [Google Scholar]
- 26.Zarb GA, Carlsson GE. Temporomandibular disorders: osteoarthritis. J Orofac Pain 1999;13:295–306 [PubMed] [Google Scholar]
- 27.Emshoff R, Rudisch A, Innerhofer K, Bösch R, Bertram S. Temporomandibular joint internal derangement type III: relationship to magnetic resonance imaging findings of internal derangement and osteoarthrosis. Int J Oral Maxillofac Surg 2001;30:390–396 [DOI] [PubMed] [Google Scholar]
- 28.Emshoff R, Innerhofer K, Rudisch A, Bertram S. The biological concept of “internal derangement and osteoarthrosis”: a diagnostic approach in patients with temporomandibular joint pain? Oral Surg Oral Med Oral Pathol Oral Radiol Endod 2002;93:39–44 [DOI] [PubMed] [Google Scholar]
- 29.Palacios-Moreno AM, Chilvarquer I, Luz JGC. Radiographic findings, signs and symptoms in temporomandibular joint dysfunctions. Rev Odontol Univ São Paulo 1997;11:273–278 [Google Scholar]
- 30.Kurita H, Ohtsuka A, Kobayashi H, Kurashina K. Flattening of the articular eminence correlates with progressive internal derangement of the temporomandibular joint. Dentomaxillofac Radiol 2000;29:277–279 [DOI] [PubMed] [Google Scholar]
- 31.Vasconcelos BC, Cauás M, Melo ADG, Zamorano GH. Analysis of the morphological variations in the TMJ in patients with rheumatoid arthritis through computed tomography. Rev Odonto Ciência 2005;20:75–77 [Google Scholar]
- 32.De Coster PJ, Van denBerghe LI, Martens LC. Generalized joint hypermobility and temporomandibular disorders: inherited connective tissue disease as a model with maximum expression. J Orofac Pain 2005;19:47–57 [PubMed] [Google Scholar]
- 33.Aquotti-Ilha VC, Rapoport IlhaFilho JB, Aquotti Reis A, Boni AS. Estimation of condylar excursion in patients with craniomandibular dysfunction: a multidisciplinary approach. Rev Dent Press Ortodon Ortop Facial 2006;11:63–70 [Google Scholar]