

Abstract
Objectives
The dosimetry of the Kodak 9500 cone beam CT (CBCT) unit (Carestream Health, Rochester, NY) was measured before and after installation of copper filtration.
Methods
Dosimetry of a pre-production Kodak 9500 CBCT unit was compared with a current production unit with 0.4 mm of added filtration and increased kVp. Thermoluminescent dosimeter 100 chips were placed at 24 locations in a RANDO (radiation analogue dosimetry) head phantom (Nuclear Associates, Hicksville, NY). Small, medium and large adult default exposure settings were used in separate dosimeter runs for large and medium field of view (FOV) examinations with both units. Equivalent dose and effective dose were calculated using International Commission on Radiological Protection (ICRP) 1990 and 2007 tissue weights.
Results
Estimations of risk using 2007 ICRP calculations increased by an average of 77% for large FOV scans and 125% for the medium FOV scans in comparison with 1990 calculations. With added filtration, effective dose for medium FOV examinations for default settings were: small adult 76 µSv, medium adult 98 µSv, and large adult 166 µSv. Effective doses for large FOV examinations were: small adult 93 µSv, medium adult 163 µSv, and large adult 260 µSv. Effective dose was reduced by an average of 43% in examinations made with increased filtration and adjusted kVp.
Conclusion
The manufacturer's installation of additional filtration with the adjustment of kVp in the Kodak 9500 CBCT unit resulted in significant patient dose reductions for examinations at all adult default settings.
Keywords: cone beam computed tomography, radiation dosimetry, phantoms, risk assessment
Introduction
A review paper published at the end of 2007 in the New England Journal of Medicine estimated that between 1.5% and 2% of all cancers in the United States may be attributable to the radiation from CT studies.1 While these figures may be debatable, there is substantial evidence supporting the risk of exposure to X-rays. Over the last two decades the per capita dose from all sources of ionizing radiation has almost doubled from 3.6 mSv to 6.2 mSv, largely owing to the increased use of CT2. Perception of the risk of exposure from examinations of the maxillofacial area3 has also increased owing to the revision of tissues and tissue weighting factors in the International Commission on Radiological Protection (ICRP) 2007 recommendations for calculating effective dose.4
Cone beam CT (CBCT) has been cited as a lower dose technique for imaging of the maxillofacial area in comparison with CT, which may be as efficacious as CT for certain diagnostic tasks.5,6 However, large variations in dose have been noted for different CBCT units for comparable examinations.7 Furthermore, seven-fold differences in dose for the same examination by the same unit may be created by varying combinations of exposure factors for some units. Doses from some CBCT examination protocols have been shown to equal or exceed doses from comparable medical CT scans.7
Against this backdrop of increasing public concern over the risk of X-ray imaging, there has been a tremendous increase in the number of CBCT units purchased by non-radiology practices and operated by individuals with minimal training in radiation biology and protection. Dentistry is still in the first decade of dedicated commercial maxillofacial cone beam devices and we already have 15 manufacturers of 24 different units. These manufacturers play a critical role in determining examination dose through decisions regarding default exposure settings and exposure options. Continued effort to reduce the dose by manufacturers in new and post-release CBCT units will be important in reducing examination doses. This paper illustrates this concept using an example of dose reduction in the Kodak 9500 unit (Carestream Health, Rochester, NY) examination after the manufacturer increased beam filtration and adjusted exposure parameters of the unit.
Materials and methods
In December 2008, dosimetry measurements were made on a pre-production model of the Kodak 9500 three-dimensional cone beam radiography system (Carestream Health, Rochester, NY). The protocol described below was used to evaluate dosimetry. Subsequent to this the manufacturer increased filtration of the unit's X-ray beam and increased kVp of the generator, while maintaining mA for each of the default examination settings. The purpose of these changes was first to reduce dose and secondly to increase the image quality through a reduction of beam hardening artefacts that generally affect CT reconstruction algorithms. Testing the dose reduction was the primary purpose of the current study. Average tissue-absorbed dose, equivalent dose and effective dose are calculated for the anatomy of the head and neck area. Effective doses are reported using the 1990 ICRP recommendations7 and superseding 2007 recommendations.4
The Kodak 9500 is a patient standing or seated format CBCT unit, which uses a flat panel detector with two field of view (FOV) options. The large FOV produces a cylinder that is nominally 18 cm high and 21 cm in diameter. The smaller or medium FOV is 9 cm high by 15 cm in diameter. The 9500 unit has variable mA and kVp options, which can be determined individually by the operator or selected from a display of default settings. Dosimetry evaluation of the pre-production unit included medium and large adult default settings for the large FOV and small and medium adult settings for the medium FOV (Table 1). Subsequent modification of the pre-production Kodak 9500 unit added 0.4 mm copper filtration and increased kVp at all default settings. This is the configuration of currently manufactured units. Default settings for small, medium and large adult exposures were used for both FOVs (Table 1).
Table 1. Examination exposure factors.
| Initial configuration |
Added filtration |
|||
| Default setting | kVp | mAs | kVp | mAs |
| Small adult | 70 | 86.4 | 80 | 86.4 |
| Medium adult | 70 | 108 | 85 | 108 |
| Large adult | 74 | 108 | 90 | 108 |
Dosimetry was acquired using an average adult skull and tissue-equivalent phantom (RANDO — radiation analogue dosimetry system, Nuclear Associates, Hicksville, NY). Thermoluminescent dosimeter (TLD) chips were used to record the distribution of the absorbed radiation dose at selected locations in the head and neck region of the phantom. The 24 phantom sites measured in this study are shown in Figure 1. Neck, cheek and thyroid surface dosimeters were positioned at the vertical centre of the designated slice level and taped in position. The lens of eye dosimeters were centred over the anatomical location for the lens and taped in position. Internal dosimeters were approximately positioned in the vertical centre of the selected slice level and held in position by friction from the TLD's protective plastic envelope and the surface of the drilled space at the sampled anatomical location. During scanning the phantom was orientated with the occlusal plane approximately parallel to the scan rotation plane. Nine or ten scans were used for each dosimeter run to provide a more reliable measure of radiation in the dosimeters. TLD doses were divided by the number of scans to determine the “exposure per scan” for each dosimeter.
Figure 1.

Locations of thermoluminescent dosimeter (TLD) chips in radiation analogue dosimetry (RANDO) phantom
Pre-calibrated 3 × 3 ×1 mm TLD 100 lithium fluoride chips were supplied and analysed by Landauer Inc (Landauer, Glenwood, IL). The standard deviation of readings from a sample of the supplied TLD 100 chips was less than ± 5%. Doses from TLDs at different positions within a tissue or organ were averaged to express the average tissue-absorbed dose in micrograys (µGy). The products of these values and the percentage of a tissue or organ irradiated (Table 2) in radiographic examination were used to calculate the equivalent dose (HT) in microsieverts (µSv).4 Overall reproducibility of calculations of effective dose in repeated examinations using this phantom and dosimeter protocol was within 2.5%.8
Table 2. Estimated percentage of tissue irradiated and thermoluminescent dosimeter (TLD) used to calculate mean absorbed dose to a tissue or organ.
| Fraction irradiated (%) | TLD ID (see Figure 1) | |
| Bone marrow | 16.5 | |
| Mandible | 1.3 | 13, 14, 17, 18 |
| Calvaria | 11.8 | 1, 2, 3 |
| Cervical spine | 3.4 | 15 |
| Thyroid | 100 | 22, 23 |
| Oesophagus | 10 | 24 |
| Skin | 5 | 8, 9, 10, 16 |
| Bone surfacea | 16.5 | |
| Mandible | 1.3 | 13, 14, 17, 18 |
| Calvaria | 11.8 | 1, 2, 3 |
| Cervical spine | 3.4 | 15 |
| Salivary Glands | 100 | |
| Parotid | 100 | 11, 12 |
| Submandibular | 100 | 19, 20 |
| Sub-lingual | 100 | 21 |
| Brainb | 100 | 4, 5 |
| Remainder | ||
| Brainc | 100 | 4, 5 |
| Lymphatic nodesb | 5 | 11–15, 17–22, 24 |
| Muscleb,c | 5 | 11–15, 17–22, 24 |
| Extrathoracic airwayb | 100 | 6, 7, 11–15, 17–22, 24 |
| Oral mucosab | 100 | 11–14, 17–21 |
aBone surface dose is the bone marrow dose multiplied by the bone:muscle mass energy absorption coefficient ratio, which is equal to: (−0.0618 × 2/3 kV peak) + 6.9406 using data taken from NBS (National Bureau of Standards) Handbook No. 8511
b2007 recommendations of the ICRP4
c1990 recommendations of the ICRP13
For bone marrow, the equivalent dose to the whole-body bone marrow was calculated using the summation of the individual equivalent doses to the calvarium, the mandible and the cervical spine. Determination of these equivalent doses is based on the distribution of active bone marrow throughout the adult body. The mandible contains 1.3%; the calvaria, 11.8%; and the cervical spine, 3.4%.9 Following the technique of Underhill et al,10 three locations within the calvarium were averaged to determine calvarial dose. For bone, a correction factor based on experimentally determined mass energy attenuation coefficients for bone and muscle irradiated with mono-energetic photons was applied.11 An effective beam energy, estimated to be two-thirds of the peak beam energy for each X-ray unit, was used to determine bone:muscle attenuation ratios. A linear fit (R2 = 0.996) of ratios from 40 kV to 80 kV obtained from published data11 produced the following equation:
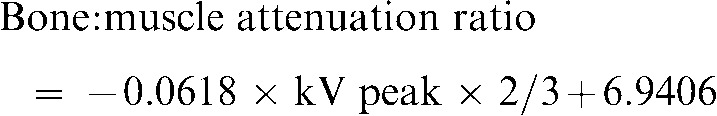 |
Values calculated from this equation provided a bone:muscle attenuation ratio of 3.63 at 54 kV (80 kV peak), 3.42 at 57 kV (85 kV peak) and 3.21 at 60 kV (90 kV peak).
The proportion of skin surface area in the head and neck region directly exposed during maxillofacial CBCT imaging is estimated at 5% of the total body to calculate radiation weighted dose to the skin following the procedure reported by Ludlow et al.12 Similarly, muscle and lymphatic node exposures are estimated to represent 5% of the total-body complement for these tissues. The proportion of the oesophageal tract that was exposed was set at 10%.
Effective dose (E) is a calculation that permits comparison of the detriment of different exposures to ionizing radiation with an equivalent detriment produced by a full-body dose of radiation. E, expressed in µSv, is calculated using the equation:
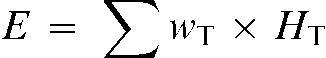 |
where E is the summation of the products of the tissue weighting factor (wT), which represents the relative contribution of that organ or tissue to the overall risk, and the radiation weighted dose HT.4 The whole-body risk is found by the summation of the radiation weighted doses to all tissues or organs exposed. Both previous 1990 ICRP tissue weighting factors and new 2007 weighting factors found in Table 3 were used to calculate E.4,13
Table 3. Tissue weighting factors for calculation of effective dose: ICRP 199013 and 20074 recommendations.
| Tissue |
1990 |
2007 |
| wT | wT | |
| Bone marrow | 0.12 | 0.12 |
| Breast | 0.05 | 0.12 |
| Colon | 0.12 | 0.12 |
| Lung | 0.12 | 0.12 |
| Stomach | 0.12 | 0.12 |
| Bladder | 0.05 | 0.04 |
| Oesophagus | 0.05 | 0.04 |
| Gonads | 0.20 | 0.08 |
| Liver | 0.05 | 0.04 |
| Thyroid | 0.05 | 0.04 |
| Bone surface | 0.01 | 0.01 |
| Brain | Remainder | 0.01 |
| Salivary glands | — | 0.01 |
| Skin | 0.01 | 0.01 |
| Remainder tissues | 0.05a | 0.12b |
aAdrenals, brain, upper large intestine, small intestine, kidney, muscle, pancreas, spleen, thymus and uterus; bAdrenals, extrathoracic region, gall bladder, heart, kidneys, lymphatic nodes, muscle, oral mucosa, pancreas, prostate, small intestine, spleen, thymus and uterus/cervix. (Text in italics refers to the remainder tissues used for calculation of maxillofacial dose)
The 1990 weighting factors were assigned to 12 organs or tissues and a group of remainder organs for the purposes of calculating total E (Table 3). Of the individually weighted tissues or organs only bone marrow, oesophagus, thyroid, bone surface and skin doses are included in dose calculations for this study. Of the ten organs making up the remainder category, only brain and muscle are included. The other individual or remainder organs are not directly exposed in the protocols used in this study. While an assumption of no dose may underestimate actual exposure to these organs, the impact on total E is negligible.
Tissue weighting factors for 2007 increase the number of independently weighted tissues by 2 and expand the number of remainder tissues to 14 (Table 3). Of the new individually weighted tissues, both brain and salivary gland tissues were used in this study's calculations. 2007 remainder tissues directly exposed in maxillofacial CBCT exams include oral mucosa, lymphatic nodes, muscle and extrathoracic region (airway). A body fraction of 100% was used in the calculation of dose to oral mucosa and extrathoracic region tissues for the scanning protocols used in this study. Because the uterus and cervix is present only in females and the prostate only present in males, the number used in the weighted averaging of remainder tissues is 13.
Radiation detriment, defined as the total harm to an exposed population and their descendants, can be calculated using E. Detriment includes the weighted probabilities of fatal and non-fatal cancer, hereditary effects and the relative length of life lost. The coefficient assigned to these combined effects is 7.3 × 10⁻² Sv−1 following the 1990 ICRP recommendations.13 Because of great uncertainty on the form of the dose response below 1 Sv, the ICRP currently suggests that no specific judgment on low-dose risk of non-cancer diseases is possible. Therefore, a risk coefficient of 5.5 × 10⁻² Sv−1 based on cancer risk alone was used for 2007 risk estimates (see ICRP 2007 Annex A).4
Results
Equivalent dose is summarized in Table 4, which provides equivalent doses for the weighted tissues and organs that receive direct exposure during maxillofacial imaging. Salivary gland contribution to effective dose is the highest of all weighted tissues. Oral mucosa and extrathoracic tissues received the next highest doses for weighted tissues and display similar patterns across large and medium FOVs. When the pre-production unit doses are compared with a current unit's doses, reduction in dose with added filtration is seen in almost every case. Table 5 compares E for the pre-production and currently configured Kodak 9500 units with added filtration. An average exposure reduction of 43% was found using default adult settings for both large and medium FOVs when the unit was equipped with additional filtration.
Table 4. Equivalent dose (µSv) to tissues and organs in the head and neck from Kodak 9500 large field of view (FOV) (18 × 21 cm) and medium FOV (9 × 15 cm) examinations using default exposure settings for small, medium and large adults and comparing pre-production and current production units.
| Remainder |
|||||||||||||
| Field (Adult size) | Unit status | Bone marrow | Thyroid | Oesophagus | Skin | Bone surface | Salivary glands | Brainb | Braina | Lymphatic nodesb | Extrathoracic airwaya | Musclea,b | Oral mucosab |
| 18 × 21 cm (small) | Added filtration | 134 | 471 | 36 | 70 | 485 | 1513 | 1017 | 1017 | 63 | 1262 | 63 | 1437 |
| 18 × 21 cm (medium) | Pre production | 292 | 2000 | 216 | 345 | 1181 | 4573 | 2030 | 2030 | 190 | 3736 | 190 | 4239 |
| Added filtration | 218 | 835 | 131 | 123 | 747 | 2645 | 1640 | 1640 | 114 | 2286 | 114 | 2549 | |
| % reduction | 25% | 58% | 39% | 65% | 37% | 42% | 19% | 19% | 40% | 39% | 40% | 40% | |
| 18 × 21 cm (large) | Pre production | 399 | 2045 | 307 | 451 | 1548 | 5447 | 2730 | 2730 | 233 | 4669 | 233 | 5219 |
| Added filtration | 342 | 1356 | 233 | 182 | 1098 | 4161 | 2694 | 2694 | 185 | 3655 | 185 | 4048 | |
| % reduction | 14% | 34% | 24% | 60% | 29% | 24% | 1% | 1% | 21% | 22% | 21% | 22% | |
| 9 × 15 cm (small) | Pre production | 150 | 960 | 89 | 132 | 1039 | 3672 | 180 | 180 | 155 | 2738 | 155 | 3572 |
| Added filtration | 70 | 475 | 52 | 33 | 255 | 1582 | 100 | 100 | 68 | 1196 | 68 | 1530 | |
| % reduction | 53% | 51% | 42% | 75% | 75% | 57% | 44% | 44% | 56% | 56% | 56% | 57% | |
| 9 × 15 cm (medium) | Pre production | 173 | 1010 | 117 | 176 | 1202 | 4682 | 265 | 265 | 189 | 3386 | 189 | 4413 |
| Added filtration | 113 | 533 | 54 | 55 | 386 | 1680 | 264 | 264 | 94 | 1738 | 94 | 2143 | |
| % reduction | 35% | 47% | 54% | 68% | 68% | 64% | 0% | 0% | 50% | 49% | 50% | 51% | |
| 9 × 15 cm (large) | Added filtration | 170 | 840 | 90 | 86 | 547 | 3612 | 350 | 350 | 156 | 2836 | 156 | 3570 |
aICRP 2007; bICRP 1990
Table 5. Effect of filtration and kVp changes of pre-production and current Kodak 9500 cone beam CT units on effective dose.
| Technique | Effective dose in μSv — ICRP 2007 pre-production configuration | Effective dose in μSv — ICRP 2007 added filtration configuration | % reduction in dose for current unit configuration |
| Large FOV (18 × 21 cm) | |||
| Small adult | 93 | ||
| Medium adult | 282 | 163 | 42 |
| Large adult | 339 | 260 | 23 |
| Medium FOV (9 × 15 cm) | |||
| Small adult | 171 | 76 | 56 |
| Medium adult | 200 | 98 | 51 |
| Large adult | 166 | ||
| Average reduction | 43 |
FOV, field of view; ICRP, International Commission on Radiological Protection
Table 6 compares E calculated with 1990 and 2007 tissue weighting factors for the current Kodak 9500 unit configuration. 2007 ICRP calculations of effective dose resulted in an average increase of 77% for large FOV scans and an increase of 125% for the medium FOV scans in comparison with 1990 calculations. Table 7 depicts an alternate means of comparing effective doses for the examinations tested using the current Kodak 9500 configuration. These comparisons include doses as multiples of average dental panoramic examinations, days of per capita background dose (based on an annual full body exposure of 3 mSv) and probability of a stochastic effect (ICRP 1990) or fatal cancer (ICRP 2007).
Table 6. Effective dose for large field of view (FOV) and medium FOV examinations with the Kodak 9500 unita: Comparison of International Commission on Radiological Protection (ICRP) 1990 and 2007 calculations.
| Technique | Effective dose in μSv — ICRP 1990 tissue weights | Effective dose in μSv — ICRP 2007 tissue weights | % change in effective dose 1990–2007 |
| Large FOV (18 × 21 cm) | |||
| Small adult | 52 | 93 | 78 |
| Medium adult | 92 | 163 | 77 |
| Large adult | 148 | 260 | 76 |
| Average | 77 | ||
| Medium FOV (9 × 15 cm) | |||
| Small adult | 39 | 76 | 96 |
| Medium adult | 49 | 98 | 101 |
| Large adult | 76 | 166 | 118 |
| Average | 105 |
aCurrently configured unit with 0.4 mm added copper filtration
Table 7. Doses of Kodak 9500 CBCT unita adult default examinations using alternate measures of risk.
| Technique | Effective dose in μSv — ICRP 1990 tissue weights | Effective dose in μSv — ICRP 2007 tissue weights | Dose as multiple of average panoramic dose (ICRP-1990) | Dose as multiple of averageb panoramic dose (ICRP 2007) | Days of per capita back-ground (ICRP 1990) | Days of per capita back-ground (ICRP 2007) | Probability of x in a million stochastic effect ICRP 1990 (dose in μSv x 7.3 × 10⁻²) | Probability of x in a million fatal cancer ICRP 2007 (dose in μSv x 5.5 × 10⁻²) |
| Large FOV (18 × 21 cm) | ||||||||
| Small adult | 52 | 93 | 8 | 6 | 6 | 11 | 4 | 5 |
| Medium adult | 92 | 163 | 14 | 10 | 11 | 20 | 7 | 9 |
| Large adult | 148 | 260 | 23 | 16 | 18 | 32 | 11 | 14 |
| Medium FOV (9 × 15 cm) | ||||||||
| Small adult | 39 | 76 | 6 | 5 | 5 | 9 | 3 | 4 |
| Medium adult | 49 | 98 | 8 | 6 | 6 | 12 | 4 | 5 |
| Large adult | 76 | 166 | 12 | 10 | 9 | 20 | 6 | 9 |
CBCT, cone beam CT; ICRP, International Commission on Radiological Protection
aCurrently configured unit with 0.4-mm added copper filtration
bAverage of 5 units: Sirona-Orthopos XG, Planmeca-ProMax, Kodak-9000, SCANORA 3D, Instrumentarium-OP 200 VT = 16.1 μ
Discussion
Increases in kVp and beam filtration have the potential to reduce dose by reducing the number of low-energy photons in the X-ray beam. Low-energy photons with high probabilities of being absorbed in the patient regardless of the absorption characteristics of the tissue contribute little diagnostic information while adding to patient dose. Adjustments made in beam filtration and kVp in the current study have resulted in impressive reductions in dose, which were averaged at 43% for both FOVs and all adult default settings. The effect of these changes on image quality was not tested; however, subjectively, all images appeared diagnostic. Examples of images produced during dosimetry testing are seen in Figures 2 and 3.
Figure 2.

Medium field of view, medium default exposure setting, pre-production unit
Figure 3.

Medium field of view, medium default exposure setting, current unit
Changes in tissue weighting factors and the inclusion of salivary glands as a weighted tissue in the 2007 recommendations of the ICRP have resulted in an upward reassessment of effective dose from oral and maxillofacial radiographic examinations in previously published studies.3,7,14 The results of the current study also support this statement.
Concern has been voiced over increasing numbers of CT examinations in the United States and the increased cancer risks, especially in children, which result from these examinations.1 Child exposure settings provided by the Kodak 9500 unit could not be tested with the adult phantom used in this study. While default child exposures are lower than adult settings, risk is inevitably greater owing to greater sensitivity of developing organs and tissues to radiation.
A recent report assessing the lifetime attributable risk of common CT examinations cited an average 13-fold difference in dose for the same examination in different facilities, even when using the same equipment.15 Within small, medium and large FOV groups, similar percentage differences in dose are also possible for the different units and exposure options available for dedicated maxillofacial CBCT imaging.7 The current study found a 2.8-fold difference between default small and large adult settings for large FOVs and a 2.2-fold dose difference for medium FOV settings in the current configuration of the Kodak 9500 unit. The median dose (medium adult default) for the Kodak 9500 large FOV (0.16 mSV) is 12 times less than the median dose from a head CT examination (2 mSv) cited in the Smith-Bindman et al study.15 An extension of this comparison is that, on average, an order of magnitude dose reduction can be obtained when substituting a Kodak 9500 CBCT scan for a standard CT scan for dental diagnosis. Furthermore, the current configuration of the Kodak 9500 produces default patient doses that are 43% less than the initially shipped units. Carestream-Kodak has offered to retrofit pre-production units and has completed most retrofits so that units in the field meet the new specifications for beam quality and exposure. It is hoped that other manufacturers will emulate this model.
Numerous radiographic parameters act in concert to influence diagnostic information, image quality and patient dose. Dose is proportional to size of the FOV when other factors are held constant. This should prompt practitioners to choose the smallest FOV that is needed to achieve the diagnostic aims of a particular examination. The Kodak 9500, with a medium and large FOV option, should lower practice-based doses through this mechanism. Location of the FOV also has a significant impact on dose. While this is most apparent with smaller FOVs, even large FOVs may produce differing patient risks depending on how peripheral organs, such as the thyroid gland, are positioned with respect to direct exposure from the X-ray beam. This should prompt radiographers to use thyroid shields and careful positioning strategies when possible. The shape of the FOV also influences dose to peripheral tissues. A sphere, used by image intensifier-based imaging systems, tends to increase brain and thyroid exposures in large FOVs. A cylinder, produced by flat panel detector-based CBCT units, has the potential to be collimated to image the anatomy between the condyles and chin with a reduced vertical beam height.
The number of basis images that are acquired for an image volume and the amount of exposure per basis image have a direct effect on patient dose. For some units these factors are under the operator's control. When this is the case, choice of factors resulting in the lowest tube current and exposure time (mAs) consistent with the diagnostic task should be chosen.
Use of continuous or pulsed X-ray sources also impact dose. Image receptors do not acquire information during short phases of the imaging cycle when the charge in the receptor is integrated and sent to the frame grabber for storage. Because of this some manufacturers pulse X-ray output, turning the beam off during the integration/data transmission phase of image acquisition. If the X-ray source is left on during this period, when no new data can be acquired, the exposure is wasted and contributes unnecessarily to patient dose.
Ideally exposure factors are selected on the basis of image quality required to achieve the examination goals. Because image quality is proportional to dose, selection of image quality becomes a decision on dose and vice versa. Ideally these decisions should be informed by the training and expertise of the dentist who will be using the examination for diagnosis. The reality is that the majority of scans will simply follow the manufacturer's suggested scanning protocol without further consideration of the potential for dose/image quality optimization. Therefore it will be important for future research to establish criteria for the optimal level of image quality taking into consideration both diagnostic yield and dose. It is critical that professional radiology associations use these findings to guide manufacturers and end users to establish standard parameters for the operation of each CBCT unit. If, as a profession, we are to continue to have our patients benefit from this evolving technology while reducing patient risk, it will be essential for us to work in concert with manufacturers and to provide encouragement and guidance through research and sound clinical practice.
References
- 1.Brenner DJ, Hall EJ. Computed tomography — an increasing source of radiation exposure. N Engl J Med 2007;357:2277–2284 [DOI] [PubMed] [Google Scholar]
- 2.National Council on Radiation Protection and Measurements Ionizing radiation exposure of the population of the United States (Report No160), Bethesda, MD: National Council on Radiation Protection and Measurements, 2009 [Google Scholar]
- 3.Ludlow JB, Davies-Ludlow LE, White SC. Patient risk related to common dental radiographic examinations: The impact of 2007 International Commission on Radiological Protection recommendations regarding dose calculation. J Am Dent Assoc 2008;139:1237–1243 [DOI] [PubMed] [Google Scholar]
- 4.Valentin J. The 2007 recommendations of the International Commission on Radiological Protection, ICRP Publication 103. Ann ICRP 2007;37:1–332 [DOI] [PubMed] [Google Scholar]
- 5. www.sedentexct.eu [homepage on the internet] Radiation protection: cone beam CT for dental and maxillofacial radiology provisional guidelines (v1.1 May 2009). A report prepared by the SEDENTEXCT project. Accessed October 31, 2010. Available from http://www.sedentexct.eu. [Google Scholar]
- 6.De Vos W, Casselman J, Swennen GRJ. Cone-beam computerized tomography (CBCT) imaging of the oral and maxillofacial region: A systematic review of the literature. Int J Oral Maxillofac Surg 2009;38:609–625 [DOI] [PubMed] [Google Scholar]
- 7.Ludlow JB, Ivanovic M. Comparative dosimetry of dental CBCT devices and 64 row CT for oral and maxillofacial radiology. Oral Surg Oral Med Oral Pathol Oral Radiol Endod 2008;106:930–938 [DOI] [PubMed] [Google Scholar]
- 8.Ludlow JB, Brooks SL, Davies-Ludlow LE, Howerton B. Dosimetry of 3 CBCT units for oral and maxillofacial radiology. Dentomaxillofac Radiol 2006;35:219–226 [DOI] [PubMed] [Google Scholar]
- 9.White SC, Rose TC. Absorbed bone marrow dose in certain dental radiographic techniques. J Am Dent Assoc 1979;98:553–558 [DOI] [PubMed] [Google Scholar]
- 10.Underhill TE, Chilvarquer I, Kimura K, Langlais RP, McDavid WD, Preece JW, et al. Radiobiologic risk estimation from dental radiology, part I, absorbed doses to critical organs. Oral Surg Oral Med Oral Pathol 1988;66:111–120 [DOI] [PubMed] [Google Scholar]
- 11.Physical AspectsofIrradiation. NBS Handbook No. 85. Washington DC: US Government Printing Office, March 1964: 3. [Google Scholar]
- 12.Ludlow JB, Davies-Ludlow LE, Brooks SL. Dosimetry of two extraoral direct digital imaging devices: NewTom cone beam CT and Orthophos Plus DS panoramic unit. Dentomaxillofac Radiol 2003;32:229–234 [DOI] [PubMed] [Google Scholar]
- 13.International Commission on Radiological Protection Recommendations of the International Commission on Radiological Protection, ICRP Publication 60. Ann ICRP 1991;21:1–201 [PubMed] [Google Scholar]
- 14.Ludlow JB, Davies-Ludlow LE, White SC. Patient risk from common dental radiographic examinations. Am Dent Assoc J 2008;139:1237–1243 [DOI] [PubMed] [Google Scholar]
- 15.Smith-Bindman R, Lipson J, Marcus R, Kim K-P, Mahesh M, Gould R, et al. Radiation dose associated with common computed tomography examinations and the associated lifetime attributable risk of cancer. Arch Intern Med 2009;169:2078–2086 [DOI] [PMC free article] [PubMed] [Google Scholar]