

Abstract
Objectives
The aim of this study was to investigate the accuracy and reliability of linear measurements of edentulous ridges recorded from 16-row multidetector CT (MDCT) images and cone beam CT (CBCT) images acquired using a flat panel detector (FPD) with a large field of view (FOV), both independently and in comparison with each other.
Methods
Edentulous areas of human dry skulls were marked with gutta-percha markers to standardize the plane of the transverse cross-sections and path of measurements. The skulls were imaged using a 16-row MDCT scanner and a CBCT device with a large FOV and a FPD. Ridge dimensions were recorded from reformatted sections by two observers and compared with measurements recorded directly from the bone. The measurement errors and intra and interexaminer reliability were calculated for each modality and compared with each other.
Results
The overall mean of the absolute errors was 0.75 mm for MDCT and 0.49 mm for CBCT. The mean of the CBCT absolute errors was smaller than that of the MDCT absolute errors for the overall data, as well as for the site-specific data. The intraexaminer reliability score was 0.994 for MDCT and 0.995 for CBCT. The interexaminer reliability was 0.985 for MDCT and 0.958 for CBCT.
Conclusions
Both MDCT and CBCT were associated with a clinically and statistically significant measurement error. CBCT measurements were significantly more accurate than those of MDCT. The measurements recorded from both modalities had a high inter and intraexaminer reliability. Accuracy of measurements was found to be more operator dependent with CBCT than with MDCT.
Keywords: cone beam CT, spiral CT, dental implants, reproducibility of results
Introduction
For many years multidetector CT (MDCT) has been advocated as the most accurate and reliable imaging modality for implant site assessment. However, MDCT has certain limitations such as high radiation dose, degradation of the image quality by metallic artefacts, and the high cost and limited availability of the procedure. Moreover, the anisotropic image voxels result in reformatted images with lower accuracy than the original axial scans. In an attempt to overcome the limitations of MDCT devices in general use, volumetric tomography devices, based on the concept of cone beam CT (CBCT), were developed specifically for use in the maxillofacial area.1-3 However, CBCT images are associated with increased scatter and noise compared with MDCT images, which causes them to have relatively less contrast resolution,1-4 and with CBCT devices with a limited field of view (FOV), structures outside the FOV were reported to cause further reduction in image contrast.2,5,6
The relatively lower image contrast of CBCT images reportedly affects low-contrast resolution but does not limit high-contrast resolution, which is the contrast required in implant site assessment.1,2,7 Three studies have compared the accuracy of MDCT and CBCT in the assessment of implant site dimensions.8-10 Kobayashi et al 8 and Suomalainen et al 10 both found that linear measurements of the alveolar ridges recorded from CBCT images were more accurate than those recorded from MDCT images. Loubele et al 9 tested four different MDCT protocols and one CBCT protocol and found the CBCT measurements to be more accurate than those obtained with three of the MDCT protocols. However, the MDCT images obtained by the fourth protocol yielded more accurate linear measurements than the CBCT images.
At the time of writing there were no studies, to our knowledge, which investigated the dimensional accuracy of images acquired with CBCT with a flat panel detector (FPD) and/or a large FOV in implant site assessment, and only one study9 was found that investigated a 16-row MDCT scanner. Therefore, the aim of this study was to investigate the accuracy and reliability (reproducibility) of linear measurements of edentulous ridges obtained from MDCT images made on a 16-slice scanner and CBCT images acquired with a FPD with a large FOV compared with the gold standard of human dried skulls. The study also aimed to compare the results from the two modalities.
Materials and methods
Preparation of skulls
Five human dry skulls were used in this study. All existing teeth were removed and the alveolar ridges were flattened to expose areas of bone which would facilitate the physical sectioning of the bone while maintaining the height and width of the ridge at the site of the sections. After grinding, the surface of one of the maxillae was found to be entirely made up of exposed large marrow spaces, and was therefore not used for measurement purposes. The corresponding mandible was used and the entire skull was imaged to facilitate the correct positioning of the mandible.
The edentulous areas to be measured were marked with radiopaque gutta-percha markers 1.4 mm in diameter. The markers delineating each sample site were placed crestal, buccal and lingual to the jaws, and a groove filled with softened gutta-percha was placed along the inferior border of the acrylic resin surrounding the mandible. The markers and gutta-percha groove were placed in order to delineate the position and plane of the transverse cross-sections as well as the proposed path of measurements (Figure 1).
Figure 1.

Diagram showing the direction of the height and width measurements on transverse cross-sections. a) Maxillary section. b) Mandibular section anterior to the mental foramen. c) Mandibular section at and posterior to the mental foramen
The markers were obtained by cutting the black colour-coded ends of size 80 gutta-percha cones with scissors, and were embedded in a layer of clear acrylic resin separated from the bone by three layers of sheet wax (each layer was 1.5 mm thick). The wax and the acrylic resin surrounding the maxillae covered the entire ridge, tuberosity and palate, and extended buccally superior to the floor of the nasal fossa and maxillary sinus. For the mandibles, the entire body of the mandible was surrounded by wax and acrylic resin. The distribution of the demarcated sample sites is listed in Table 1.
Table 1. Distribution of sample sites.
| Maxillary sites |
Mandibular sites |
Total | |||||
| Skull | Incisor | Canine-premolar | Molar | Incisor | Canine-premolar | Molar | |
| 1 | 2 | 3 | 3 | 2 | 0 | 0 | 10 |
| 2 | 2 | 0 | 1 | 2 | 4 | 2 | 11 |
| 3 | 0 | 0 | 0 | 2 | 4 | 2 | 8 |
| 4 | 2 | 1 | 1 | 2 | 4 | 2 | 12 |
| 5 | 2 | 3 | 2 | 2 | 4 | 1 | 14 |
| Total | 8 | 7 | 7 | 10 | 16 | 7 | 55 |
Imaging of the jaws
The skulls were imaged in a spiral 16-row MDCT scanner (Light Speed 2002, General Electric, Fairfield, CT) using the same protocol routinely used in clinical practice. Axial sectional images of the jaws were acquired with the scanning plane for the maxilla parallel to the hard palate and the scanning plane for the mandible parallel to the long axis of the body of the mandible. The sectional images were acquired with 80 mA and 120 kV. The acquisition time for the axial slices was 1 rotation per second (i.e. 16 slices per second). The slice thickness was 1.25 mm with 1.25-mm spacing (i.e. contiguous slices); the beam pitch was 0.562:1. The display FOV (DFOV) was 16.7 cm × 16.7 cm, with a matrix size of 512 × 512 (calculated pixel size: 0.33 mm).
Reformatting software (DentaScan Plus, General Electric, Fairfield, CT) was used to obtain transverse cross-sectional images of the jaws 2 mm in thickness, which is the standard thickness obtained from the software program. To produce the transverse cross-sectional images, the software requires a curvilinear plane to be traced on one of the acquired axial sections. The raw data are then reformatted to obtain transverse cross-sectional images perpendicular to the planes of both the axial section and the curvilinear plane. As such, the cross-sectional images cannot be reformatted individually.
Therefore, despite repeated attempts to standardize the plane of the MDCT reformatted image sections, not all were properly orientated; i.e. most did not include all their respective gutta-percha markers. The sections were, nonetheless, used in the study because the inability to obtain image sections at the exact sites and orientation is unavoidable with the particular software system used. If none of the transverse sectional images at a particular site included all the markers at that site, then the image with the most optimum orientation was used. The reformatted MDCT images were transferred to the workstation via floppy disk, without being archived. Figure 2 is a sample of the reformatted transverse cross-sectional images obtained from MDCT.
Figure 2.
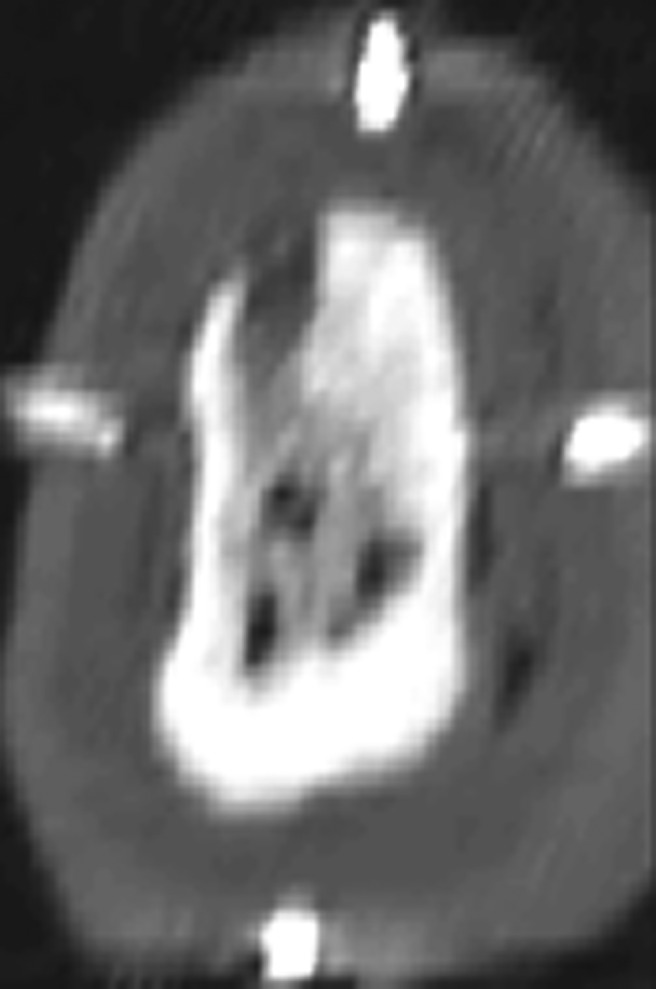
Sample of reformatted mandibular transverse cross-sectional images obtained from multidetector CT
The skulls were also imaged in a CBCT device (Iluma, Imtek Imaging, 3M Company, St Paul, MN) with a large FOV and a FPD. The size of the detector was 19 cm × 24 cm, and was composed of 127 micron amorphous silicon. The X-ray source focal spot size was 0.3 mm.
The skulls were placed upright on a wooden stand, which was free of any metallic parts. The number of basis images acquired for each scan was 602, and were acquired using 3.8 mA and 120 kVp. The scan time was 39.9 s. The reconstructed voxels were isotropic and 0.29 mm in all three dimensions. The reconstructed axial projection images were processed with reformatting software (IlumaVision 3-D (Version 1.0.2.5), Imtek Imaging, 3M Company, St Paul, MN) to obtain transverse cross-sectional images of the jaws at the sites of the gutta-percha markers. The transverse cross-sections were reformatted individually and each included the crestal, buccal and lingual gutta-percha markers. Figure 3 is a sample of the reformatted transverse cross-sectional images obtained from CBCT.
Figure 3.
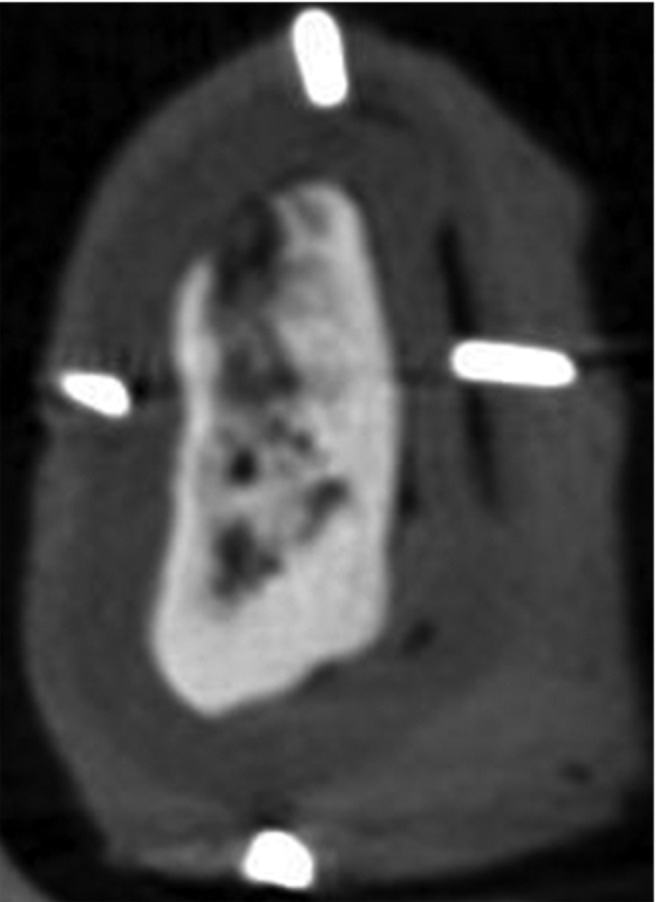
Sample of reformatted mandibular transverse cross-sectional images obtained from cone beam CT
The thickness of the cross-sectional images was 0.29 mm, which is the thickness used in clinical practice.
Recording of measurements
The linear measurement tool of the image processing software programs (DentaPC, General Electric, Fairfield, CT; and IlumaVision 3-D, Imtek Imaging, 3M Company, St Paul, MN) was used to record the measurements from the reformatted MDCT and CBCT images, respectively. The measurements were recorded directly from the computer monitors. The images from both modalities were viewed on identical liquid crystal display (LCD) monitors (Dell Ultrasharp 2408WFP- 24” Widescreen Flat Panel Monitors, Round Rock, TX). The resolution of the monitors was set at the optimal resolution (1920 × 1200), the pixel size being 0.27 mm. The colour quality was set at “medium” (16 bit) (the highest depth supported by the hardware of the CBCT device). Viewing and recording measurements from all the images was performed in the morning and in dim lighting.
Measurements were recorded twice by the first observer with at least a 1-week interval in between, and once by a second observer. Both observers were blinded to which CBCT sites corresponded with which MDCT sites.
After imaging, the jaws were sectioned using a band saw to obtain transverse cross-sections of the jawbones at the sites of the gutta-percha markers. To ensure that the plane of the bone sections corresponded to the plane of the images, the plane of the bone sections included the innermost portion of the gutta-percha markers (crestal, buccal and lingual). Figure 4 is a sample of the transverse bone sections showing gutta-percha markers embedded in acrylic. Bone sections that did not include the innermost portion of the three gutta-percha markers were excluded from the study. Also excluded from the study were the sections whose borders were inadvertently cut by the band saw, the sections whose gutta-percha markers were loosened before determination of the paths of measurement and the section at which the thin floor of the maxillary sinus was perforated by aggressive cleaning.
Figure 4.
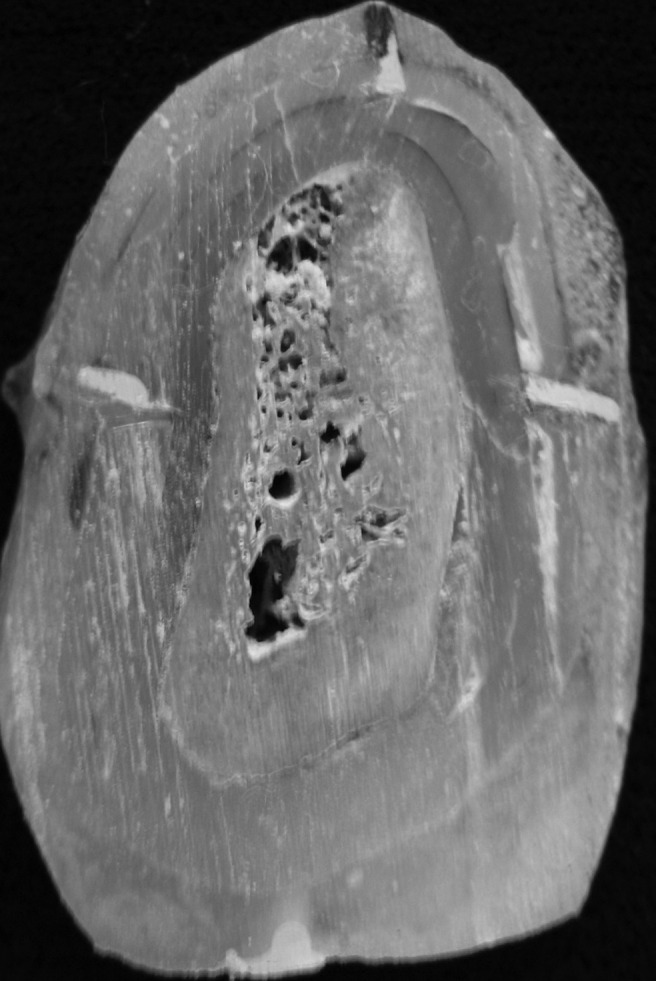
Sample of transverse mandibular bone sections showing gutta-percha markers embedded in acrylic
The paths of measurement were marked on the bone with a pencil, and the bone measurements were recorded using a digital calliper (Mitutoyo Absolute Digimatic Caliper, Mitutoyo Corporation, Kawasaki, Japan) with 0.01 mm resolution and ±0.02 mm accuracy. The calliper was submitted to King Abdulaziz City for Science and Technology, Riyadh, Saudi Arabia for testing, and was found to conform to the manufacturer's standards of accuracy (±0.02 mm).
The wax adjacent to the measurement points was carefully removed and the tips of the calliper blades were placed on the outer surface of the bone, contacting the edge of the cut surface. All the measurements were recorded by a single observer and repeated 1 week later. The observer was blinded to which bone sections corresponded to the previously examined images.
Statistics
Descriptive statistics were calculated for the differences between the measurements obtained from the images and those obtained by directly measuring the bone (the gold standard). The mean of the absolute values of the differences was calculated for each modality for the overall measurements, as well as for subsets of site-specific measurements. Intra and interexaminer reliability were evaluated with correlation testing and confirmed by the calculation of Cronbach's alpha.
Paired t-test, one-sample t-test (test value: zero) and Wilcoxon signed-rank test were then used to test the statistical significance of the mean of errors and absolute errors of MDCT and CBCT measurements compared with the gold standard and in relation to each other (for the overall and site-specific data). One-way ANOVA and independent t-test were then used to test the statistical significance of the difference between the means of the absolute errors from the different sites. Statistical significance was set at P = 0.05.
Results
The results of this study were obtained using four maxillae and five mandibles. Height and width measurements were recorded from the MDCT and CBCT images at 55 sites (110 measurements). After exclusion of the necessary bone sections, the total number of direct bone measurements available was 83. 3 of these 83 measurements were further excluded from the data set because the orientation of the MDCT reformatted transverse image was different than that defined by the markers to a very large degree. Thus, for measurement error calculations, only 80 measurements were included in the study.
Reliability
The intra and interexaminer reliability scores for the gold standard and test measurements are listed in Table 2. The intraexaminer reliability scores for the two modalities were comparable, and both were slightly lower than that for the gold standard measurements. The interexaminer reliability for both modalities was lower than the respective intraexaminer reliability, and the CBCT interexaminer reliability was found to be lower than that of MDCT.
Table 2. Reliability statistics.
| Reliability | Cronbach's alpha | Inter-item correlation matrix | Percentage of sample with absolute difference larger than 0.5 mm |
| Direct bone measurements (intraexaminer) | 0.999 | 0.999 | 2 |
| MDCT (intraexaminer) | 0.997 | 0.994 | 25 |
| MDCT (interexaminer) | 0.992 | 0.985 | 59 |
| CBCT (intraexaminer) | 0.997 | 0.995 | 10 |
| CBCT (interexaminer) | 0.979 | 0.958 | 75 |
MDCT, multidetector CT; CBCT, cone beam CT
Measurement error
The measurement error for each test device was calculated as the mean test measurement (first examiner) minus the mean direct bone measurement. Thus, a negative error value indicated the measurement recorded from the image was smaller than the gold standard and vice versa.
Figures 5 and 6 are frequency histograms of the MDCT and CBCT error values. Both histograms indicate the errors were both positive and negative and were normally distributed around zero.
Figure 5.

Frequency histogram of the multidetector CT (MDCT) error values
Figure 6.
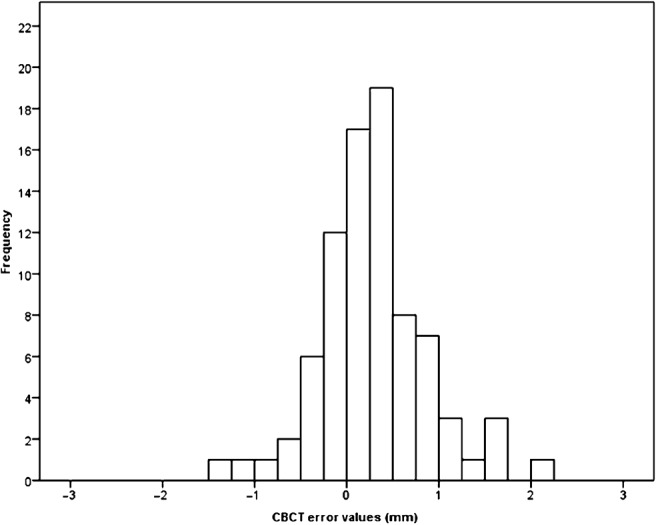
Frequency histogram of the cone beam CT (CBCT) error values
The mean of the absolute errors was 0.65 mm (SD 0.57 mm) for the MDCT measurements and 0.48 mm (SD 0.44 mm) for the CBCT measurements. Figures 7 and 8 are bar charts of the means of the absolute errors of MDCT and CBCT measurements for the overall, as well as for the site-specific, samples. For both modalities, the mean of the absolute errors was statistically significant for the entire sample size as well as for all the subsets of the sample (P-value = 0.000). Table 3 lists the number and percentage of absolute measurement errors which were larger than, or equal to, 0.5 mm, 1.0 mm and 2.0 mm.
Figure 7.
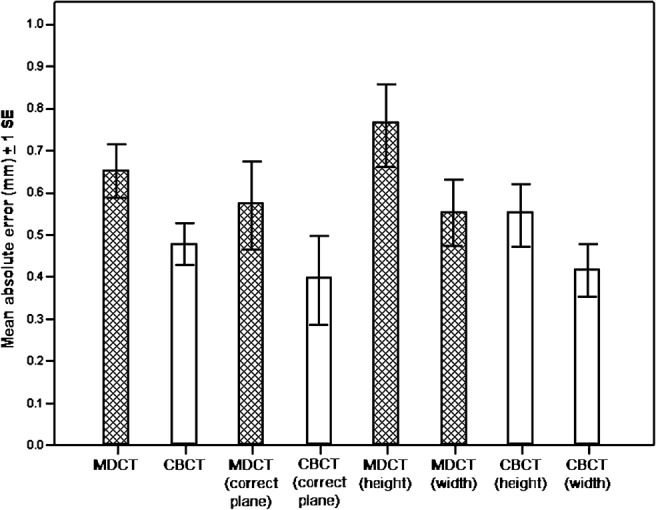
Bar chart of the means of the absolute errors of multidetector CT (MDCT) and cone beam CT (CBCT) measurements ±1 standard error (SE)
Figure 8.
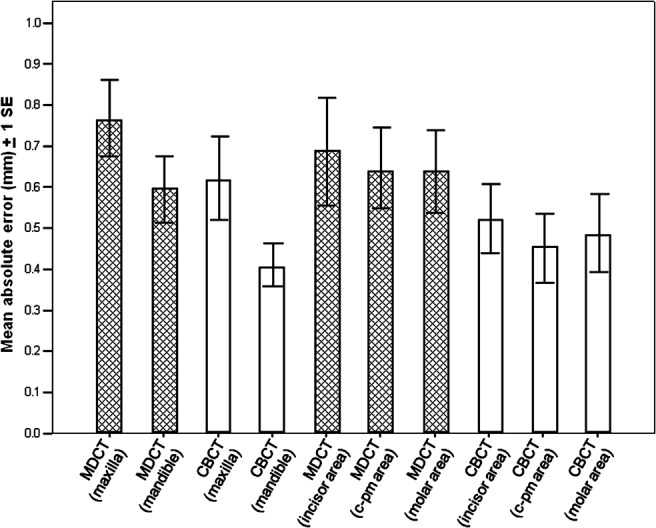
Bar chart of the means of the absolute errors of the site-specific multidectector CT (MDCT) and cone beam CT (CBCT) measurements ±1 standard error (SE)
Table 3. Frequency of multidetector CT (MDCT) and cone beam CT (CBCT) absolute errors ≥0.5, 1 and 2 mm.
| Number of sites with absolute error ≥ 0.5 mm (%) | Number of sites with absolute error ≥ 1 mm (%) | Number of sites with absolute error ≥ 2 mm (%) | |
| MDCT | 42 (52.5) | 17 (21.3) | 3 (3.8) |
| CBCT | 27 (33.3) | 10 (12.5) | 1 (1.3) |
Table 4 is a summary of the difference between MDCT and CBCT absolute errors for the entire sample as well as for specific sites, along with the corresponding P-values. The means of the CBCT absolute errors were found to be smaller than those of MDCT (for the entire sample, as well as for each subset of sample sites). However, the difference was found to be statistically significant only for the overall sample population (P = 0.006), the overall width measurements (P = 0.036), the mandibular sites (P = 0.027) and the area of the canine-premolars (P = 0.039).
Table 4. Summary and statistical significance of difference between multidetector CT (MDCT) and cone beam CT (CBCT) absolute errors for the different sample subsets.
| MDCT absolute error minus CBCT absolute error | Mean (mm) | Standard deviation (mm) | P-value |
| Entire sample | 0.17 | 0.55 | 0.006a |
| Height measurements | 0.22 | 0.67 | 0.055a |
| Width measurement | 0.14 | 0.41 | 0.036a |
| Site where MDCT sections were in correct plane | 0.18 | 0.36 | 0.053b |
| Maxillary sites | 0.15 | 0.47 | 0.130b |
| Mandibular sites | 0.19 | 0.59 | 0.027a |
| Area of incisors | 0.16 | 0.66 | 0.277b |
| Area of canine premolars | 0.20 | 0.54 | 0.039a |
| Area of molars | 0.15 | 0.43 | 0.130b |
aPaired t-test
bWilcoxon signed-rank test
When the absolute errors at the individual sites were reviewed, 28 of the 80 measurements were found to have an MDCT absolute error which was smaller than that of CBCT. The difference between the mean MDCT and CBCT absolute errors at these sites was statistically significant (both paired t-test and Wilcoxon signed-ranks test: P = 0.000). Only five of these measurements were from correctly orientated MDCT sections. This indicates that for 23 measurements (29% of the total sample) the MDCT absolute error was smaller than the CBCT error, despite the fact that the plane of the CBCT section was correctly orientated while that of the MDCT section was not.
Discussion
Comparing the accuracy of MDCT and CBCT images, the smaller CBCT errors obtained in this study are in agreement with the results obtained by Kobayashi et al 8 and Suomalainen et al 10, and in partial agreement with the findings of Loubele et al.9 In the present study, the smaller CBCT absolute error values compared with MDCT may be due to the fact that the CBCT voxel size was smaller, allowing the production of thinner reformatted transverse cross-sectional images with a sharper bone-wax interface. A confounding factor in the study that may have affected the MDCT measurements, but not those of CBCT, is compression of the images. To transfer the MDCT reformatted images to the workstation, the software system requires them to be compressed onto a floppy disk. This compression may lead to the loss of image data and the subsequent loss of image resolution.
When the height and width absolute errors were evaluated separately, the height errors were found to be larger than the width errors, but the difference was not statistically significant for either modality. This finding is similar to the results reported by previous investigators who calculated the MDCT or CBCT height and width errors separately.11-13 The slightly larger height error values may be due to the fact that the crest of the ridge is not always covered by compact bone, thus localization of the bone margins was difficult in some cases. Also, an elusive inferior dental canal and hazy inferior border of the mandible or floor of the maxillary sinus may lead to larger measurement errors. A confounding factor in the present study, which may have increased height measurement errors, may be the removal of the existing teeth and grinding of the crestal aspect of the ridge performed at some sites during preparation of the samples.
Analysis of the site-specific measurement errors obtained with both modalities did not reveal a difference between the different regions of the jaws. But with both modalities, the maxillary errors were found to be larger than the mandibular, although the difference was statistically significant only for CBCT. A possible explanation is that the peripheries of the mandibular bone are more likely to be covered with a distinct layer of compact bone, and thus are easier to distinguish on the sectional images. However, even these relatively distinct boundaries were less easy to distinguish on MDCT than on CBCT (as evidenced by the larger mean absolute error), hence the lack of statistical significance between height and width MDCT errors.
Of the MDCT sections where an absolute error of 1 mm or more was found, almost all were associated with an unsharp or unclear boundary. Furthermore, when any of the boundaries of the bone section were oblique or inclined relative to the path of measurement, slight shifts in the path of measurement may have led to significant differences in measurements.
The possibility that incorrect planes of the image sections contributed to the larger MDCT errors was investigated by comparing the measurements recorded from the MDCT sections, which were in the correct orientation only, with the corresponding CBCT sections. The results from these sites indicated that, similar to the overall study sample, the MDCT mean absolute error was larger than that of CBCT. Thus, incorrect orientation of the image sections was ruled out as a possible cause for the larger MDCT errors.
This fact is supported by the finding that for nearly a third of the study sample, MDCT measurements, which were from an imprecisely orientated section, were more accurate than the CBCT measurements, which were recorded from a correctly orientated section. These results indicate that slight shifts in the angulation of the image sections do not adversely affect the measurement accuracy. This finding is in agreement with the results of Kim et al 14 and Dantas et al 15 but in contrast with the findings of Sforza et al.16
Comparing the accuracy of the measurements obtained in this study with previous studies, the present study has shown a larger mean of the absolute errors for MDCT measurements than that reported by Kobayashi et al.8 However, neither the technical parameters of the MDCT device used in their study nor the resolution of their images were specified; therefore, analysing the differences between the present study's results and theirs is not possible.
The mean of the CBCT absolute error values obtained in this study was found to be larger than those reported by Kobayashi et al 8 and Naitoh et al.12 The devices used in both of the previous studies had an image intensifier17 and used a smaller number of basis images than the present study, and produced images with a smaller voxel size. Since noise increases with both an increase in resolution as well as reduction in the number of basis images,1,3-5,18-21 the higher accuracy of the measurements obtained by Kobayashi et al 8 and Naitoh et al,12 compared with the present study, suggests that the benefit of increased image resolution outweighs the effect of noise on contrast resolution when measuring bone dimensions. This is an expected finding since noise in CBCT images is known to limit low-contrast resolution but does not affect high-contrast resolution.1,2,7
The results of the present study could not be compared with those of Loubele et al 9 because they calculated the mean of the errors, not the mean of the absolute errors. Their results, therefore, do not represent the mean magnitude of error; they indicate the degree of positive or negative skew of the overall error values. As such, comparing the non-absolute results of the present study with theirs would not truly indicate the difference in magnitude of error between the two studies.
Furthermore, it was not possible to compare this study's findings with the results of Suomalainen et al 10 because they reported their error values only as percentages of the actual values, and the percentage error is not a valid unit for comparing and contrasting the findings of different studies. This is because the actual ridge dimensions vary in each study and there is no common denominator to make the comparisons valid. Thus, comparing the percentage errors of different studies may lead to erroneous conclusions.
The high intraexaminer reliability obtained in this study for both imaging modalities indicates they produce consistent results. Although the interexaminer reliability scores were high for both modalities, they were lower than the respective intraexaminer reliability scores, with the CBCT interexaminer reliability being lower than that of MDCT. These findings indicate that both modalities are, to a certain extent, operator dependent, with CBCT being more so than MDCT. The high interexaminer reliability obtained for both modalities is in agreement with the findings of Loubele et al.9
It should be noted that for the MDCT intra and interexaminer reliability, and CBCT interexaminer reliability, the difference between recorded measurements was clinically significant (0.5 mm) for a considerable number of sites. These differences are not reflected in the high reliability scores. Thus, the statistically calculated high reliability scores may be misleading with regard to clinical implications. Most operators round off recorded measurements to the nearest 1 mm or 0.5 mm and, therefore, as an error approaches 0.5 mm or more, it is more likely to significantly change the reported measurement.
In conclusion, the results of this study indicate that both MDCT and CBCT images have a high inter and intraexaminer reliability but are associated with a statistically significant measurement error. Furthermore, MDCT is associated with a larger mean absolute error than CBCT, and assessment of implant site dimensions is not adversely affected by minor discrepancies in the plane of orientation of the transverse cross-sectional images. As such, it is recommended that the possibility of 1 mm overestimation should be considered when measuring implant site dimensions on MDCT or CBCT images, and correction should be performed accordingly. Also, recording of the ridge dimensions for implant site assessment and placement of the implants should be performed by the same operator. Furthermore, implant simulation programmes should be used to evaluate ridge dimensions during implant site assessment to restrict the effect of inclined bone surfaces and avoid measurement errors. Further standardized studies should be conducted to investigate treatment outcome of implant therapy planned with different imaging modalities.
Acknowledgments
The authors thank Dr Abdallah Al-Dahmash, Chairman of the Anatomy Department at the College of Medicine, King Saud University, for his aid in obtaining the dry skulls, and Engineer Saleh Al-Sharikh, from King Abdulaziz City for Science and Technology, for facilitating the testing of the digital calliper used in this study.
The authors also thank Mr Mohammad Saeed, Head Radiology Technician at the College of Dentistry, King Saud University, and Mr Kamal Al-Batsh, Head CT Technician at King Khalid University Hospital, for their efforts during the conduct of this research.
References
- 1.Mozzo P, Procacci C, Tacconi A, Martini PT, Andreis IA. A new volumetric CT machine for dental imaging based on the cone-beam technique: preliminary results. Eur Radiol 1998;8:1558–1564 [DOI] [PubMed] [Google Scholar]
- 2.Arai Y, Tammisalo E, Iwai K, Hashimoto K, Shinoda K. Development of a compact computed tomographic apparatus for dental use. Dentomaxillofac Radiol 1999;28:245–248 [DOI] [PubMed] [Google Scholar]
- 3.Araki K, Maki K, Seki K, Sakamaki K, Harata Y, Sakaino R, et al. Characteristics of a newly developed dentomaxillofacial X-ray cone beam CT scanner (CB MercuRay): system configuration and physical properties. Dentomaxillofac Radiol 2004;33:51–59 [DOI] [PubMed] [Google Scholar]
- 4.Fuchs T, Kalender WA. On the correlation of pixel noise, spatial resolution and dose in computed tomography: theoretical prediction and verification by simulation and measurement. Physica Medica 2003;19:153–164 [Google Scholar]
- 5.van Daatselaar AN, van derStelt PF, Weenen J. Effect of number of projections on image quality of local CT. Dentomaxillofac Radiol 2004;33:361–369 [DOI] [PubMed] [Google Scholar]
- 6.Katsumata A, Hirukawa A, Okumura S, Naitoh M, Fujishita M, Ariji E, et al. Effects of image artifacts on gray-value density in limited-volume cone-beam computerized tomography. Oral Surg Oral Med Oral Pathol Oral Radiol Endod 2007;104:829–836 [DOI] [PubMed] [Google Scholar]
- 7.Kalender WA. The use of flat-panel detectors for CT imaging. Radiology 2003;43:379–387 [DOI] [PubMed] [Google Scholar]
- 8.Kobayashi K, Shimoda S, Nakagawa Y, Yamamoto A. Accuracy in measurement of distance using limited cone beam computerized tomography. Int J Oral Maxillofac Implants 2004;19:228–231 [PubMed] [Google Scholar]
- 9.Loubele M, Van Assche N, Carpentier K, Maes F, Jacobs R, van Steenberghe D, et al. Comparative localized linear accuracy of small-field cone beam CT and multislice CT for alveolar bone measurements. Oral Surg Oral Med Oral Pathol Oral Radiol Endod 2008;105:512–518 [DOI] [PubMed] [Google Scholar]
- 10.Suomalainen A, Vehmas T, Kortesniemi M, Robinson S, Peltola J. Accuracy of linear measurements using dental cone beam and conventional multislice computed tomography. Dentomaxillofac Radiol 2008;37:10–17 [DOI] [PubMed] [Google Scholar]
- 11.Cavalcanti MG, Haller JW, Vannier MW. Three-dimensional computed tomography landmark measurement in craniofacial surgical planning: experimental validation in vitro. J Oral Maxillofac Surg 1999;57:690–694 [DOI] [PubMed] [Google Scholar]
- 12.Naitoh M, Katsumata A, Mitsuya S, Kamemoto H, Ariji E. Measurement of mandibles with microfocus X-ray computerized tomography and compact computerized tomography for dental use. Int J Oral Maxillofac Implants 2004;19:239–246 [PubMed] [Google Scholar]
- 13.Hueman EM, Noujeim ME, Langlais R, Prihoda TJ, Miller FR. Accuracy of cone beam computed tomography in determining the location of the genial tubercle. Otolaryngol Head Neck Surg 2007;137:115–118 [DOI] [PubMed] [Google Scholar]
- 14.Kim KD, Jeong HG, Choi SH, Hwang EH, Park CS. Effect of mandibular positioning on preimplant site measurement of the mandible in reformatted CT. Int J Periodontics Restorative Dent 2003;23:177–183 [PubMed] [Google Scholar]
- 15.Dantas JA, Montebello Filho A, Campos PSF. Computed tomography for dental implants: the influence of the gantry angle and mandibular positioning on the bone height and width. Dentomaxillofac Radiol 2005;34:9–15 [DOI] [PubMed] [Google Scholar]
- 16.Sforza NM, Franchini F, Lamma A, Botticelli S, Ghigi G. Accuracy of computed tomography for the evaluation of mandibular sites prior to implant placement. Int J Periodontics Restorative Dent 2007;27:589–595 [PubMed] [Google Scholar]
- 17.Naitoh M. Re: Questions from OMF; radiology post-grad student. E-mail to Asma Al-Ekrish. 8 April 2009. [Google Scholar]
- 18.Jaffray DA, Siewerdsen JH. Cone-beam computed tomography with a flat-panel imager: initial performance characterization. Med Phys 2000;27:1311–1323 [DOI] [PubMed] [Google Scholar]
- 19.Seeram E. Computed tomography. Physical principles, clinical applications, and quality control. Second edition. Philadelphia: W.B. Saunders, 2001 [Google Scholar]
- 20.Siewerdsen JH, Jaffray DA. Cone-beam computed tomography with a flat-panel imager: magnitude and effects of x-ray scatter. Med Phys 2001;28:220–231 [DOI] [PubMed] [Google Scholar]
- 21.Bushberg JT, Seibert JA, Leidholdt EM, Jr, Boone JM. The essential physics of medical imaging. Second edition. Philadelphia: Lippincott Williams & Wilkins, 2002 [Google Scholar]