

Abstract
Objective
To present a clinical study demonstrating a method to derive Hounsfield units from grey levels in cone beam CT (CBCT).
Methods
An acrylic intraoral reference object with aluminium, outer bone equivalent material (cortical bone), inner bone equivalent material (trabecular bone), polymethlymethacrylate and water equivalent material was used. Patients were asked if they would be willing to have an acrylic bite plate with the reference object placed in their mouth during a routine CBCT scan. There were 31 scans taken on the Asahi Alphard 3030 (Belmont Takara, Kyoto, Japan) and 30 scans taken on the Planmeca ProMax 3D (Planmeca, Helsinki, Finland) CBCT. Linear regression between the grey levels of the reference materials and their linear attenuation coefficients was performed for various photon energies. The energy with the highest regression coefficient was chosen as the effective energy. The attenuation coefficients for the five materials at the effective energy were scaled as Hounsfield units using the standard Hounsfield units equation and compared to those derived from the measured grey levels of the materials using the regression equation.
Results
In general, there was a satisfactory linear relation between the grey levels and the attenuation coefficients. This made it possible to calculate Hounsfield units from the measured grey levels. Uncertainty in determining effective energies resulted in unrealistic effective energies and significant variability of calculated CT numbers. Linear regression from grey levels directly to Hounsfield units at specified energies resulted in greater consistency.
Conclusions
The clinical application of a method for deriving Hounsfield units from grey levels in CBCT was demonstrated.
Keywords: cone beam computed tomography, Hounsfield units, grey levels, bone density, linear attenuation coefficient
Introduction
Cone beam CT (CBCT) scans have been shown to aid in bone density assessment for orthodontic mini-implant site selection,1 diagnosis of periodontal bone loss,2 complex diagnostic and treatment planning,3 surgical assessment of pathology, temporomandibular joint assessment, pre- and post-operative assessment of craniofacial fractures,4 measurements of endodontic lesions to biopsy5 and the assessment of bone quality before dental implant surgery.6
While the literature supports the usefulness of CBCT scans for the determination of radiographic bone density1-6 at a lower cost and less radiation exposure when compared with CT, there are other studies stating that the grey levels in CBCT scans are not accurate when compared with CT. In a 2006 presentation, Armstrong7 concluded that “Hounsfield units sampled from identical anatomic areas with CBCT and MDCT are not identical”. A study carried out by Katsumata et al8 found that the grey levels in a CBCT image for bone varied from −1500 to over 3000. They concluded that “the ability to assess the density or quality of bone is limited and because the grey level range is so variable the derived density provided less than meaningful data”.8 Experience has shown that the grey levels obtained on one CBCT scanner may vary greatly from those obtained on another manufacturer's scanner. In addition, the grey levels from one CBCT scan may differ from those obtained in another scan performed on the same machine. This makes the comparison of data difficult if not impossible in terms of density. Given that there are many CBCT machines currently being used in dentistry which operate with differing tube potential and filtration as well as reconstruction algorithms, it is not really surprising that the grey levels obtained on dental CBCT scanners vary widely.9
As Hounsfield units are routinely used in CT to compare densities of different materials, it would seem that the adoption of Hounsfield units would also offer a method of comparing the relative densities of tissues in a CBCT scan.10 In a recent study, Mah et al9 introduced a method where Hounsfield units could be derived using grey levels in CBCT. This was an extensive study using 11 different CBCT scanners in 3 different situations: (1) phantom alone; (2) phantom in small water container to mimic a small patient, such as a child; and (3) phantom in a large water container to mimic an adult patient head. A linear relationship was demonstrated between the linear attenuation coefficients for each of the eight materials at a suitable specific energy and the grey levels were obtained from each of the CBCT scans. Hounsfield units were calculated using the fitted linear attenuation coefficients and compared to the Hounsfield units calculated from the measured grey levels. In most cases, the difference between the actual Hounsfield units of each of the materials in the phantom at the selected effective energy and the Hounsfield units calculated from grey levels was within a very small percentage. It was concluded that the method was effective in deriving Hounsfield units using grey levels within approximately the same variability range as that observed between medical CT scanners, which was less than 6.4%.9
The purpose of the present study was to apply this in vitro method to derive Hounsfield units from CBCT grey levels in a clinical situation with human patients.
Materials and methods
Patient selection
The patients selected to participate in this clinical study were prescribed a CBCT by their dental care provider. The patients were asked to participate in the study. Their panoramic radiographs were pre-screened by the primary investigator for pre-existing metallic restorations, endodontic obturation materials, metallic crowns and fixed partial dentures that might create severe artefacts. In order to achieve a realistic perspective, the patients selected for this study were allowed to participate if they had few to multiple metallic restorations, while some patients were completely edentulous. Any patients that had full mouth reconstruction or were undergoing active orthodontics and patient's that were prescribed CBCT scans for pathology, trauma or temporomandibular joint disorders were excluded because the placement of the bite plate may have altered the diagnostic value of the CBCT scan. Patient radiation dose was not increased as a result of participating in the study. The clinical study was approved by the University of Texas Health Science Center at San Antonio institutional review board on human subjects under IRB Protocol #HSC20090033H.
Intraoral reference object
Due to limitation of space in the oral cavity, only five materials were used as opposed to eight materials in the in vitro study. All materials used were epoxy resin-based tissue radiological substitutes from Gammex-RMI (Middleton, WI), except for the 1100 aluminium alloy and polymethlymethacrylate (PMMA). Each material was cut into a 5 × 5 × 5 mm cube and embedded in clear dental acrylic. Three intraoral reference objects were constructed. The reference object was designed with a smooth finish and rounded corners on the exterior to aid in patient comfort (Figure 1). The intraoral reference object has an acrylic key on the inferior aspect in order to lock onto the top of an acrylic bite plate made by Sirona Dental (Bensheim, Germany). The acrylic bite plate was used to ensure that the intraoral reference object was consistently positioned in the palatal vault of the patient's mouth. The patient was instructed to gently bite down on acrylic bite plate prior to the scan. If the patient was edentulous and had complete dentures, they were left in the mouth to help stabilize the phantom. For infection control the intraoral phantom and acrylic bite plate were sterilized using ethylene oxide gas.
Figure 1.
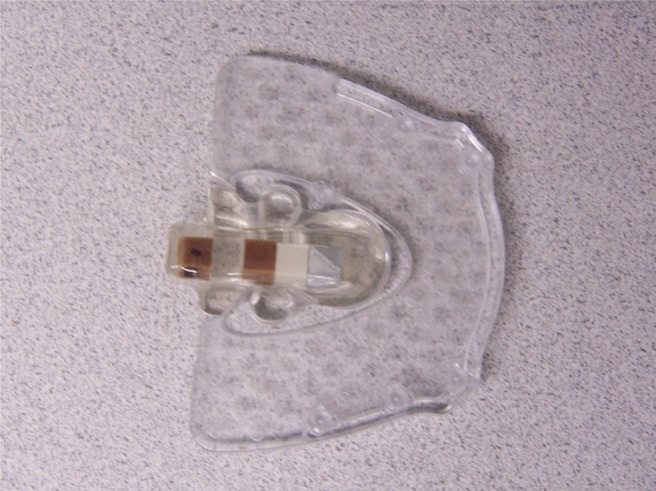
Intraoral phantom mounted on an acrylic bite plate (Sirona Dental, Bensheim, Germany)
Image acquisition
Two different CBCT machines were used: the Planmeca ProMaxTM 3D (Planmeca, Helsinki, Finland) and the Asahi Alphard 3030 (Belmont Takara, Kyoto, Japan). 31 adult patients were scanned with the Asahi Alphard 3030 and 30 with the Planmeca ProMax 3D using the manufacturer suggested clinical settings for the tube potential and current.
Most manufacturers of CBCT scanners offer an adjustable field of view (FOV) or size of scan to minimize radiation to the patients. The FOV or mode defines the volume size. Some Asian CBCT manufacturers use a letter designation such as D, I, P and C mode to designate the FOV and suggests that D-mode is “dental”, I-mode is “implant”, P-mode is “panoramic” and C-mode is “cephalometric”. However, most other manufacturer′s of CBCT scanners only designate the FOV using numerical values such as 80 × 80 mm. However, it may be confusing to the reader that the CBCT volume is labelled two dimensionally, when they need to be thinking about three dimensional volumes. Customarily, the first dimension listed is the width or diameter of the volume and the second value is the height and is sometimes designated by the letter (H) to represent the height of the volume and both units are in millimetres as indicated on the Table 1 heading.
The Asahi Alphard 3030 scanner rotates 360° around the patient's head, resulting in 510 projections.11 26 scans were acquired in I-mode with an imaging volume of 102 × 102 mm and a voxel size of 0.2 mm. Four scans were acquired in P-mode with an imaging volume of 154 × 154 mm and a voxel size of 0.3 mm. One scan was acquired in C-mode with an imaging volume of 200 × 178 mm and a voxel size of 0.39 mm. The scanning parameters were fixed at 80 kVp, 5 mA and 17 s for all patients. The Asahi Alphard 3030 has a 30 × 30 cm flat panel amorphous silicon detector and a 14-bit greyscale for density readings. The equipment specifications for the Asahi Alphard 3030 are summarised in Table 1.
On the Planmeca ProMax 3D, the scanner rotates only 194° around the patient's head, resulting in 300 projections.12 26 of the scans were acquired in 80 × 80 mm volumes in a normal resolution setting with a voxel size of 0.32 mm. Four scans were acquired in 80 × 80 mm volumes in a high resolution setting with a voxel size of 0.16 mm. The scanning parameters ranged from 80 kVp and 8 mA to 84 kVp and 14 mA for 18 s. The Planmeca ProMax 3D has a 12.16 × 12.16 cm flat panel amorphous silicon detector and uses a 12-bit greyscale for data processing. The equipment specifications for the Planmeca ProMax 3D are summarised in Table 2. Planmeca has upgraded the acquisition and reconstruction software on their proprietary Romexis software from a 12-bit to a 15-bit grey scale since this study was conducted.
Table 1. Asahi Alphard 3030 specifications and scan details.
| Exposure mode | Number of scans acquired | Exposure area (mm) | Voxel size (mm) |
| C-mode | 1 | 200 × 178 (H) | 0.39 |
| P-mode | 4 | 154 × 154 (H) | 0.3 |
| I-mode | 26 | 102 × 102 (H) | 0.2 |
| D-mode | 0 | 51 × 51 (H) | 0.1 |
| Number of projections | 510 | ||
| Exposure factors | 80 kV, 5 mA, 17 s | ||
| Degrees of rotation | 360° | ||
| Flat panel detector size | 30 × 30 cm | ||
C-mode, cephalometric; D-mode, dental; H, height; I-mode, implant; P-mode, panoramic.
Asahi Alphard 3030, Belmont Takara, Kyoto, Japan.
The raw images were processed and reconstructed using the manufacturer's proprietary software. The images were then exported in digital imaging and communications in medicine (DICOM) format for data analysis.
Image evaluation
The DICOM data sets were imported into a third party viewing software, On Demand 3D® (Cybermed, Seoul, Republic of Korea), to determine the grey levels in each of the materials for each scan. The slice thickness was not increased and was dependent upon the voxel size of each scan. The average grey levels within a square, 10 × 10 pixel, region of interest (ROI) were sampled for all five materials from both CBCT machines. Any sagittal, coronal or axial view could have been used, but primarily the sagittal views were used for sampling. The ROI was moved around within the 5 × 5 × 5 mm block of the reference material and several samples were taken. The ROI with the highest attainable grey levels was chosen for each material. For consistency the linear attenuation coefficients had to follow a specific order from high to low: aluminium > outer bone equivalent > inner bone equivalent > PMMA > water.
The linear attenuation coefficients (per centimetre) of the five reference materials were plotted as a function of the average grey levels corresponding to each material at photon energies from 30 keV to 80 keV for the Asahi Alphard 3030 and from 30 keV to 84 keV for the Planmeca ProMax 3D. The photon energy with the highest regression coefficient or value closest to one was selected as the “effective energy” of the beam. The linear attenuation coefficient for each material at the selected effective energy was converted to CT numbers Hounsfield units using the standard equation: HU = (µmaterial–µwater)/(µwater) × 1000. These CT numbers were compared to the CT numbers calculated using the grey levels of each of the materials within the region of interest using the regression equation and the difference was expressed as a percentage of the range of the Hounsfield units scale of the materials in the reference object.
The linear attenuation coefficients were derived from National Institute of Standards and Technology tables of X-ray mass attenuation coefficients and mass energy absorption coefficients for the elemental components in each material as discussed in the article by Mah et al9 on deriving Hounsfield units using grey levels in CBCT.
Results
Figures 2 and 3 are examples of the linear fits obtained when the grey levels were plotted against the linear attenuation coefficients at a particular effective energy. The water equivalent material has the lowest value and the aluminium has the highest value for both CBCT scanners.
Figure 2.

Linear regression of the results from the Asahi Alphard 3030 (Belmont Takara, Kyoto, Japan) for Patient 16
Figure 3.

Linear regression of the results from the Planmeca ProMax 3D (Planmeca, Helsinki, Finland) for Patient 25
Tables 3 and 4 show the mean values for effective energy, grey level, calculated Hounsfield units, actual Hounsfield units and percentage difference for the scanners. The overall variability between the actual and calculated Hounsfield units was less than 3%. There were 31 patients scanned on the Asahi Alphard 3030 and 30 scanned on the Planmeca ProMax 3D. With the Asahi Alphard 3030, one patient was removed from the study because endodontic filling material caused significant streak artefacts through the area of the reference object. In the case of the Planmeca ProMax 3D, one patient swallowed or respirated during the scan resulting in a vertical streak artefact in the middle of the scan that obscured the reference object. The data were averaged for the remaining 30 and 29 scans, respectively.
Table 2. Planmeca ProMax 3D specifications and scan details.
| Exposure mode | Number of scans acquired | Exposure area (mm) | Voxel size (mm) |
| Adult normal resolution | 26 | 80 × 80 (H) | 0.32 |
| Adult enhanced resolution | 4 | 80 × 80 (H) | 0.16 |
| Number of projections | 300 | ||
| Exposure factors | 80 kV, 8 mA, 18 s | ||
| 82 kV, 10 mA, 18 s | |||
| 84 kV, 12 mA, 18 s | |||
| 84 kV, 14 mA, 18 s | |||
| 84 kV, 16 mA, 18 s | |||
| Degrees of rotation | 194° | ||
| Flat panel detector size | 12.16 × 12.16 cm | ||
H, height.
Planmeca ProMax 3D, Planmeca, Helsinki, Finland.
Table 3. Average values for Asahi Alphard 3030.
| Material | Original grey level | Calculated HU | Actual HU | Percentage difference |
| Aluminium | 1424.3 | 2433.1 | 2433.2 | 1.09 |
| Outer bone equivalent | 938.0 | 1625.8 | 1652.3 | 1.52 |
| Inner bone equivalent | 154.4 | 288.2 | 287.3 | 2.05 |
| PMMA | 54.1 | 97.7 | 105.3 | 2.11 |
| Water equivalent | 22.7 | 44.2 | 19.0 | 2.42 |
PMMA, polymethlymethacrylate.
Mean keV, 66.9; Asahi Alphard 3030, Belmont Takara, Kyoto, Japan.
While the accuracy by which CT numbers in Hounsfield units can be calculated from CBCT grey levels is very encouraging, the data gathered in this study revealed a significant weakness in the present method. This is the wide variability and the physically unrealistic nature of effective energies chosen on the basis of the “best linear fit” as defined by the regression coefficient. In the present study, the mean effective energy for the Planmeca ProMax 3D was 73.4 keV with a standard deviation of 10.2 keV while the Asahi Alphard 3030 had a mean effective energy of 66.9 keV with a standard deviation of 9.8 keV. The strong dependence of Hounsfield units on beam energy resulted in a wide variation over the patient populations, making it very difficult to distinguish the values corresponding to the various tissues from one another. Figure 4 shows the original distribution of grey levels on the Planmeca ProMax 3D for the two bone equivalent materials in the intraoral reference object. While the original grey level values are not realistic Hounsfield units it is at least possible to distinguish between the two kinds of bone. Figure 5 shows the distribution of “corrected” grey levels using the method of Mah et al.9 While the average values for the two materials are now realistic Hounsfield units, the variability of effective energies results in such a tremendous overlap between the values of the two materials that it is difficult to distinguish one from the other. This variability would seem to be a serious deficiency in this method of calibration.
Figure 4.

Distribution of original bone material grey levels for 29 scans with the Planmeca ProMax 3D (Planmeca, Helsinki, Finland)
Figure 5.

Distribution of calculated bone material grey levels (Hounsfield units) using the method from Mah et al9 for 29 scans with the Planmeca ProMax 3D (Planmeca, Helsinki, Finland)
To find a way around this difficulty, linear regressions of CT number in Hounsfield units as a function of grey level were performed at several arbitrary energies (Figure 6). It was noted that an excellent linear fit was obtained at each energy level. When the same energy is used for all of the patient data, reasonable Hounsfield unit values are obtained and the distributions are much less dispersed, making it possible to clearly distinguish the two kinds of bone equivalent materials as shown in Figure 7. Using this method, it is now possible to standardize the results of the two different scanners at the same energy. Table 5 shows the averaged data from the 29 scans with the Planmeca ProMax 3D and the 30 scans with the Asahi Alphard 3030 standardized as Hounsfield units at 70 keV.
Figure 6.

Planmeca ProMax 3D (Planmeca, Helsinki, Finland) CBCT grey levels vs CT numbers in Hounsfield units at various effective energies for Patient 25
Figure 7.

Distribution of calculated bone materials grey levels (Hounsfield units) standardized at 70 keV for 29 scans with the Planmeca ProMax 3D (Planmeca, Helsinki, Finland)
Table 4. Average values for Planmeca ProMax 3D.
| Material | Original grey level | Calculated HU | Actual HU | Percentage difference |
| Aluminium | 1384.5 | 2227.8 | 2212.7 | 0.76 |
| Outer bone equivalent | 825.4 | 1459.7 | 1428.0 | 1.61 |
| Inner bone equivalent | 35.3 | 247.3 | 246.8 | 1.83 |
| PMMA | −81.0 | 87.4 | 115.6 | 1.41 |
| Water equivalent | −101.1 | 56.2 | 17.0 | 2.62 |
PMMA, polymethlymethacrylate.
Mean keV, 73.4; Planmeca ProMax 3D, Planmeca, Helsinki, Finland.
Table 5. Average values for Asahi Alphard 3030 and Planmeca ProMax 3D.
| Material | Asahi Alphard 3030 (HU) | Planmeca ProMax 3D (HU) |
| Aluminium | 2215.5 | 2247.0 |
| Outer bone equivalent | 1465.9 | 1424.3 |
| Inner bone equivalent | 254.7 | 251.9 |
| PMMA | 97.3 | 94.3 |
| Water equivalent | 45.8 | 61.7 |
PMMA, polymethlymethacrylate.
Calculated Hounsfield units at 70 keV; Asahi Alphard 3030, Belmont Takara, Kyoto, Japan; Planmeca ProMax 3D, Planmeca, Helsinki, Finland.
Discussion
CBCT imaging is rapidly becoming a standard of care in dentistry and is perceived as a benefit for the patient and clinician in terms of improved treatment outcome. While a CBCT scan is also useful in determining bone quantity, bone height and proximity of adjacent structures, it lacks the ability to quantify bone quality in a meaningful manner. This study has demonstrated a clinical application of a method developed by Mah et al9 to derive Hounsfield units using grey levels in the CBCT volume. The application of this method to derive Hounsfield units can provide a standardized method to assess bone quality similar to that found in medical CT.
As dental implant technology and the concept of osseointegration has evolved,13 the emphasis on bone morphology and quality has received greater importance in the prediction of implant success. Several studies have attempted to classify bone quality both pre-operatively and during implant placement. Pre-operative implant site assessment is the preferred method; however, it has somewhat limited success in the prediction of implant success.
When three-dimensional imaging became available with medical CT scanners, several studies attempted to classify bone quality using bone density values. One such study was a British clinical study was done using a spiral CT (GE ProSpeed helical scanner; General Electric, Slough, UK) by Norton and Gamble.14 This study found a range of bone densities for dental implants: anterior mandible, >850 HU; posterior mandible/anterior maxilla +500–850 HU; posterior maxilla, 0–500 HU; tuberosity area, <0 HU. Another pre-operative radiological study done on patients using a spiral CT machine (Siemens AR-SP 40, Munich, Germany) assessed bone volume and to determine the correlation between bone density, insertion torque and dental implant stability. The average radiographic bone density was measured and the average Hounsfield units values based on four different regions in the mouth ranged from 459 HU to 928 HU.15 The highest Hounsfield units mean is from the anterior mandible and the lowest Hounsfield units mean is from the posterior maxilla. In another retrospective dental clinical study by Turkyilmaz and McGlumphy,6 implant recipient sites were evaluated with a spiral CT machine (Siemens Somatom® AR-SP 40, Erlanger, Germany). The mean bone density of the implant recipient area was measured again in Hounsfield units using the CT machine's software.
The Turkyilmaz and McGlumphy6 study went further to relate bone density regions of the oral cavity to the scale introduced by Misch16 to characterize bone quality. Misch in 1999 developed a bone classification scale: D1 bone, >1250 HU; D2 bone, 850–1250 HU; D3 bone, 350–850 HU; D4 bone, 150–350 HU; D5 bone, <150 HU.16 D1 is described as dense cortical bone and is found only in the mandible about 8% of the time. D2 is described as having a dense cortex with a course trabecular bone pattern and this is the most common bone density in the mandible. D3 is described as having a thin cortex and a fine trabecular bone pattern and this is the most common bone density found in the maxilla. D4 is fine trabecular bone found primarily in the posterior maxilla. D5 is very soft bone and is usually consistent with sinus graft augmentation.16
In the present study, the Asahi Alphard 3030 had an average calculated value for outer bone equivalent material of 1465.9 HU using a fixed effective energy of 70 keV while the Planmeca ProMax 3D had a calculated value of 1424.3 HU at the same energy. As discussed above, the Misch bone quality classification states that the best quality dense cortical bone is >1250 HU; therefore, the calculated Hounsfield units for outer bone correlates well with the Misch bone quality scale.
According to the Misch bone quality classification system, trabecular bone (D3 and D4) has Hounsfield unit values ranging from 150 HU to 850 HU. In the present study, the Asahi Alphard 3030 had a calculated value for inner bone equivalent material of 254.7 HU using a fixed effective energy of 70 keV and the Planmeca ProMax 3D had a value of 251.9 HU using the same energy. While these values are within the appropriate range, more research needs to be done to derive a bone classification scale for CBCT scanners such that suggested by Misch16,17 for use with CT machines.
The clinical application of the technique to derive Hounsfield units using grey levels in CBCT allows the implant clinician more opportunity to select alternative implant sites or the orthodontist using mini-implants for anchorage more choices for treatment. Pre-operative planning would allow the clinician to evaluate the bone density in the CBCT scan based on the Hounsfield units prior to the procedure and plan accordingly on the type of implant to be used, length and shape of implant as well as whether to submerge or not, immediate loading versus osseous integration and healing period prior to loading, and a host of other treatment variables as well as make clinical treatment time more productive. While the results of the current study are encouraging, there remain some limitations and conditions where this technique may not be effective in deriving Hounsfield units from grey levels in CBCT.
One limitation is patient movement. In the Planmeca ProMax 3D, the patient is required to stand up when they are scanned. 1 of the 30 patients was eliminated from the data analysis with the Planmeca ProMax 3D owing to movement or motion artefact. There are insufficient restraining devices to secure the patient's head during the acquisition, making it difficult for the patient to remain still during the scan on the ProMax 3D. Head restraint, ear rods, chin rest and a built-in seat are the patient restraints used by the Asahi Alphard 3030. Since this study was completed, the manufacturer of the Planmeca ProMax 3D has incorporated a head band in the face shield to help stabilize patients' foreheads and also increased the number of adjustment heights on the chin support mechanism during CBCT acquisition. These two factors do seem to aid in patient stability during CBCT acquisition.
The lack of grey level uniformity in the CBCT images is another limitation. It has been reported by Bryant et al18 that there may be discrepancies in grey levels owing to inherent deficiencies in the flat panel detector used in some dental CBCT machines. In addition to this problem, there are the effects of scatter and beam hardening. While medical CT uses a collimated linear array of detectors and is subject to less scatter, the CBCT devices employ an area detector such as a flat panel or image intensifier which capture more scattered photons than a linear array detector. Beam hardening, the thickness-dependent variation of the effective energy of the polychromatic X-ray beam, is another source of grey level non-uniformity. Both of these effects lead to the phenomenon known as the “cupping artefact” whereby the grey levels in a homogeneous material have different values in the centre area compared to the periphery. Another reason why the grey levels may be non-uniform may be the presence of artefacts which occur when there is a large discrepancy in attenuation of the X-ray photons, such as between the boundary of the teeth and air, bone and air, metallic restoration and tooth structure, or endodontic filling material and adjacent tooth structure. This can be visualized as a high density area or streak immediately behind the high contrast material and extending into the low contrast area, such as at the interface between tooth material and air in the oral cavity or a metallic restoration and the adjacent tooth structure. Some manufacturers of CBCT scanners such as Planmeca and E-Woo Vatech (Seoul, Republic of Korea) have incorporated metal artefact reduction in their reconstruction algorithms. Further studies are needed to determine whether it will be possible to derive corrected Hounsfield units from grey levels in CBCT scanners with this additional feature.
All these grey level inconsistencies affect the accuracy of the present method. In the first place, these artefacts and inconsistencies may interfere with the sampling of grey levels to establish the original calibration. Second, even when an intraoral reference object has been successfully used to determine the conversion between grey levels and Hounsfield numbers the input of inconsistent grey levels will unavoidably result in inconsistent Hounsfield unit values.
The technique demonstrated that there were no apparent differences in grey levels between the different sized fields of view.
Conclusion
Currently, CBCT manufacturers have provided grey levels which are not actual Hounsfield units which make it difficult to assess bone quality from a CBCT data set. A method that converts grey levels taken from CBCT data sets into Hounsfield units would standardize and allow comparison of bone quality from machine to machine within a small range. The effectiveness of deriving Hounsfield units using grey levels in two CBCT systems was investigated in this clinical study. The results have demonstrated that the grey levels taken from CBCT scans can be used to derive Hounsfield units in a clinical environment. This capability along with the decreased patient radiation exposure, ease of access, greater resolution than medical CT and affordability should solidify CBCT as the imaging modality of choice in dental implant placement.
References
- 1.Chun YS, Lim WH. Bone density at interradicular sites: implications for orthodontic mini-implant placement. Orthod Craniofac Res 2009;12:25–32 [DOI] [PubMed] [Google Scholar]
- 2.Noujeim M, Prihoda T, Langlais R, Nummikoski P. Evaluation of high-resolution cone beam computed tomography in the detection of simulated interradicular bone lesions. Dentomaxillofac Radiol 2009;38:156–162 [DOI] [PubMed] [Google Scholar]
- 3.Miracle AC, Mukherji SK. Conebeam CT of the head and neck, part 2: clinical applications. AJNR Am J Neuroradiol 2009;30:1285–1292 [DOI] [PMC free article] [PubMed] [Google Scholar]
- 4.Scarfe WC, Farman AG, Sukovic P. Clinical applications of cone beam computed tomography in dental practice. J Can Dent Assoc 2006;72:75–80 [PubMed] [Google Scholar]
- 5.Simon JH, Enciso R, Malfaz JM, Roges R, Bailey-Perry M, Patel A. Differential diagnosis of large periapical lesions using cone beam computed tomography measurements and biopsy. J Endod 2006;32:833–837 [DOI] [PubMed] [Google Scholar]
- 6.Turkyilmaz I, McGlumphy EA. Influence of bone density on implant stability parameters and implant success: a retrospective clinical study. BMC Oral Health 2008;8:32. [DOI] [PMC free article] [PubMed] [Google Scholar]
- 7.Armstrong RT. Acceptability of Cone Beam CT vs. Multi-Detector CT for 3D Anatomic Model Construction. J Oral Maxillofac Surg 2006;64 Suppl. 1:37 [Google Scholar]
- 8.Katsumata A, Hirukawa A, Okumura S, Naitoh M, Fujishita M, Ariji E, et al. Relationship between density variability and imaging volume size in cone beam computerized tomographic scanning of the maxillofacial region: an in vitro study. Oral Surg Oral Med Oral Pathol Oral Radiol Endod 2009;107:420–425 [DOI] [PubMed] [Google Scholar]
- 9.Mah P, Reeves T, McDavid WD. Deriving Hounsfield units using grey levels in CBCT. Dentomaxillofac Radiol 2010;39:323–335 [DOI] [PMC free article] [PubMed] [Google Scholar]
- 10.Lagravere MO, Fang Y, Carey J, Toogood RW, Packota GV, Major PW. Density conversion factor determined using a cone beam computed tomography unit NewTom QR-DVT 9000. Dentomaxillofac Radiol 2006;35:407–409 [DOI] [PubMed] [Google Scholar]
- 11.Quolis™ AlphardAlphard-3030-Cone-Beam[internet][cited9June2010]. Available from: http://dental.takarabelmont.com/x-ray-systems/Alphard-3030-Cone beam [Google Scholar]
- 12.Planmeca ProMax3D[internet][cited9June2010]. Available from: http://www.planmeca.com/en/imaging/3d_imaging/planmeca_promax_3d [Google Scholar]
- 13.Albrektsson T, Brånemark PI, Hansson HA, Lindström J. Osseointegrated titanium implants. Requirements for ensuring a long-lasting, direct bone-to-implant anchorage in man. Acta Orthop Scand 1981;52:155–170 [DOI] [PubMed] [Google Scholar]
- 14.Norton MR, Gamble C. Bone classification: an objective scale of bone density using the computerized tomography scan. Clin Oral Implants Res 2001;12:79–84 [DOI] [PubMed] [Google Scholar]
- 15.Turkyilmaz I, Tumer C, Ozbek EN, Tozum TF. Relations between the bone density values from computerized tomography, and implant stability parameters: a clinical study of 230 regular platform implants. J Clin Periodontol 2007;34:716–722 [DOI] [PubMed] [Google Scholar]
- 16.Misch CE. Contemporary implant dentistry 2nd edn. St Louis, MO: Mosby, 1999 [Google Scholar]
- 17.Misch CE. Contemporary implant dentistry 3rd edn. St Louis, MO: Mosby, 2008 [Google Scholar]
- 18.Bryant JA, Drage NA, Richmond S. Study of the scan uniformity from an i-CAT cone beam computed tomography dental imaging system. Dentomaxillofac Radiol 2008;37:365–374 [DOI] [PubMed] [Google Scholar]