

Abstract
Elevated hepatic expression of fatty acid elongase-5 (Elovl5) induces FoxO1 phosphorylation, lowers FoxO1 nuclear content, and suppresses expression of genes involved in gluconeogenesis (GNG). In this report, we define the molecular and metabolic basis of Elovl5 control of FoxO1 phosphorylation. Adenoviral-mediated (Ad-Elovl5) induction of hepatic Elovl5 in diet-induced obese, glucose-intolerant mice and HepG2 cells increased the phosphorylation of Akt2-S473 [mammalian target of rapamycin complex-2 (mTORC2) site], but not Akt2-T308 (PDK1 site). The Akt2 inhibitor Akti1/2 blocked Elovl5 induction of FoxO1-S256 phosphorylation in HepG2 cells. Elevated Elovl5 activity in liver and HepG2 cells induced rictor mRNA, rictor protein, and rictor-mTOR interaction, whereas rictor knockdown (siRNA) attenuated Elovl5 induction of Akt2-S473 and FoxO1-S256 phosphorylation in HepG2 cells. FA analysis revealed that the abundance of cis-vaccenic acid (18:1,n-7) was increased in livers of obese mice and HepG2 cells following Ad-Elovl5 infection. Treating HepG2 cells with Elovl5 substrates established that palmitoleic acid (16:1,n-7), but not γ-linolenic acid (18:3,n-6), induced rictor protein, Akt-S473, and FoxO1-S256 phosphorylation. Inhibition of FA elongation blocked 16:1,n-7 but not 18:1,n-7 induction of rictor protein and Akt-S473 and FoxO1-S256 phosphorylation. These results establish a novel link between Elovl5-mediated synthesis of 18:1,n-7 and GNG through the control of the mTORC2-Akt-FoxO1 pathway.
Keywords: fatty acid elongase-5, palmitoleic acid, cis-vaccenic acid rictor, gluconeogenesis forkhead box O1, mammalian target of rapamycin complex 2
Recent studies suggest that fatty acid elongase-5 (Elovl5) plays a key role in regulating hepatic lipid and carbohydrate metabolism (1–3). Elovl5 elongates γ-linolenic acid (18:3,n-6) to form dihomo-γ-linolenic acid (20:3,n-6); this FA is converted to arachidonic acid (20:4,n-6) by FA desaturase 1 (FADS1). Elovl5 also elongates certain monounsaturated FAs, like palmitoleic acid (16:1,n-7), to form cis-vaccenic acid (18:1, n-7). Elovl5 does not elongate saturated FAs (4–6).
Hepatic expression of Elovl5 is regulated during postnatal development and by diet. High-fat, low-carbohydrate diets and diets enriched in C20–22 n-3 PUFA suppress hepatic Elovl5 expression and activity (2, 4). In a mouse model of diet-induced obesity and glucose intolerance, low hepatic Elovl5 activity correlated with low hepatic and plasma levels of n-7 MUFA and arachidonic acid (2). The physiological significance of this change in hepatic Elovl5 activity and unsaturated FA content was revealed when a recombinant adenoviral approach was used to restore hepatic Elovl5 activity in livers of diet-induced obese, glucose-intolerant mice. This treatment increased hepatic and plasma content of 18:1,n-7 and several C20–22 PUFAs. This treatment also reduced diet-induced insulin resistance, improved glucose tolerance, and lowered fasting blood glucose to euglycemic levels (2). This apparent insulin-mimetic effect of Elovl5 on hepatic glucose metabolism was linked to increased phosphorylation of Akt-S473, FoxO1-S256, and PP2Acat-Y307, decreased nuclear content of FoxO1, and decreased expression of phosphoenolpyruvate carboxykinase (Pck1) and glucose 6-phosphatase (G6Pc) (2). Pck1 and G6Pc are important enzymes involved in gluconeogenesis (GNG) and hepatic glucose production.
Phosphorylated FoxO1 is excluded from nuclei, ubiquitinated, and degraded in the proteasome. Loss of nuclear FoxO1 lowers the expression of key genes involved in GNG, i.e., Pck1 and G6Pc (2, 7–10). Akt2 is the most-abundant Akt isoform in rodent and human liver and other insulin-sensitive cells. Akt2 is a key regulator of hepatic FoxO1 (11–14) and plays an important role in type 2 diabetes mellitus and insulin resistance (11, 15). Akt is phosphorylated at two sites, T308 and S473 (16, 17). The Akt2-T308 site is phosphorylated by the insulin-regulated PI3 kinase-PDK1 pathway, whereas the Akt2-S473 site is phosphorylated by several kinases, including mammalian target of rapamycin complex 2 (mTORC2), integrin-linked kinase, MAP kinase-activated protein kinase-2, p38 MAP kinase, protein kinase C, NIMA-related kinase-6, double-stranded DNA-dependent protein kinase, and ataxia telangiectasia-mutated gene products (18–24). Recently, mTORC2 was identified as a key regulator of Akt-S473 and FoxO1 phosphorylation, establishing a link between the mTOR pathway and GNG (25–27). In addition to phosphorylation and ubiquitination, acetylation and covalent attachment of β-N-acetyl-glucosamine regulate FoxO1 function (7, 28, 29).
Although our earlier studies suggested a possible role of Elovl5 in the control of Akt, FoxO1, and GNG, those studies did not establish the metabolic or molecular mechanisms for this Elovl5-mediated regulatory scheme (2). In this report, we extend our previous study by establishing the requirement for Akt and FoxO1 phosphorylation in the Elovl5 control of FoxO1 and its target genes. We also identify mTORC2 as a major target of Elovl5 control and establish that cis-vaccenic acid (18:1,n-7), a product of Elovl5 activity, is a mediator of the mTORC2-Akt-FoxO1 pathway.
MATERIALS AND METHODS
Materials
DMEM with high glucose (25 mM) and antibiotics for cell culture was obtained from Invitrogen (Grand Island, NY). Hyclone fetal calf serum was purchased from Thermo-Fisher Scientific. Akti1/2, PP242, and rapamycin were purchased from EMD Calbiochem (Philadelphia, PA). Human rictor siRNA and control siRNA were obtained from Cell Signaling (Danvers, MA). X-tremeGENE siRNA transfection reagent was purchased from Roche Applied Science (Indianapolis, IN). Antibodies against rictor, phospho-rictor T1135, raptor, GβL, p70S6-kinase, phospho-p70S6 kinase T389, mTOR, phospho-mTOR S2448, FoxO1, phospho-FoxO1S256, GSK3β, phospho-GSK3α/β S21/S9, rictor sepharose bead conjugate, raptor sepharose bead conjugate, and IgG control sepharose bead conjugate were obtained from Cell Signaling (Danvers, MA). Antibodies against Akt2, phospho-Akt1/2/3 T308, phospho-Akt1/2/3-S473, phospho-GSK3β Y216, and Na,K-ATPase were purchased from Santa Cruz Biotechnology (Santa Cruz, CA). The antibody against TATA-binding protein (TBP) was obtained from Abcam (Cambridge, MA). The mSIN1 antibody was purchased from Millipore (Billerica, MA). The secondary antibodies, IRDye 680 and IRDye 800 (anti-mouse, anti-rabbit, and anti-goat) were obtained from LiCor, Inc., Lincoln, NE.
Recombinant adenovirus
The source, construction, purification, titration, and use of the recombinant adenovirus expressing luciferase (Ad-Luc) and Elovl5 (Ad-Elovl5) were described previously (2, 4). Adenovirus expressing a form of FoxO1 that is resistant to phosphorylation control (Ad-ADA-FoxO1) was a generous gift from Dr. D. Accili (Columbia University Medical center, NY) (29).
Mouse liver extracts
The mouse hepatic protein extracts from whole liver, nuclei, or cytosol used in this study were obtained from the lean and obese-glucose intolerant C57BL/6J mice described previously (2). Briefly, male C57BL/6J mice were fed a low-fat diet (10% calories as fat; Research Diets, D12450B) or a high-fat diet (60% calories as fat; Research Diets, D12492) for 12 weeks. After 12 weeks on these diets, mice fed the low-fat diet were lean and euglycemic, whereas mice fed the high-fat diet were obese, hyperglycemic, and insulin resistant. Five days prior to termination of the experiment, mice were infected with Ad-Luc or Ad-Elovl5. Five days later, mice were fasted overnight; half of the fasted mice were refed their diets for 4 h. Fasted and refed mice were euthanized at 8 AM and 12 noon for the recovery of blood and liver. Methods for liver recovery and preparation of protein extracts were described in our earlier report (2).
HepG2 Cells
Human hepatoma (HepG2) cells were obtained from American Type Culture Collection (Manassas, VA) and grown in DMEM with 25 mM glucose; media was supplemented with 10% fetal calf serum. All experiments were carried out in cells grown on 6-well or 12-well plates (Corning Life Sciences; Corning, NY) in a humidified incubator at 37°C and 5% CO2. HepG2 cells were infected with recombinant adenovirus expressing either a control virus (Ad-Luc) or test viruses (Ad-Elovl5, Ad-ADA-FoxO1) at 20 infectious units (IU) per cell. In all HepG2 cell experiments, proteins were extracted as whole-cell extract.
Immunoblotting
Proteins were extracted from mouse liver and HepG2 cells as described previously (1, 2) in the presence of protease (Roche Applied Science) and phosphatase inhibitors (1 mM β-glycerol phosphate, 2.5 mM Na-pyrophosphate, 1 mM Na3VO4). Cytosolic (post-nuclear), nuclear protein fractions and whole-cell protein extracts were separated electrophoretically by SDS-PAGE (NuPAGE, 4–12% polyacrylamide Bis-Tris; Invitrogen) and transferred to nitrocellulose (BA83) membranes. Blots were incubated with primary antibodies against various proteins overnight at 4°C. The following day, blots were washed and incubated with secondary antibody for 1 h at room temperature. Antigen-antibody reactions were detected and quantified using LiCor Odyssey scanner and software (1, 2).
RNA extraction and quantitative real time polymerase chain reaction
Total RNA was extracted from mouse liver of our earlier study (2) and HepG2 cells using Triazol (Invitrogen). Transcript levels were measured by qRT-PCR. Gene-specific primers are listed in Table 1. Primer design and qRT-PCR methods were described previously (2). Cyclophilin was used as a control gene. Levels of target gene mRNA abundance were normalized to the abundance of cyclophilin mRNA.
TABLE 1.
Primers for qRT-PCR
| Accession number | Forward | Backward | Species | |
| Elovl5 | NM_134382.1 | TACCACCATGCCACTATGCT | GACGTGGATGAAGCTGTTGA | Rat |
| Pck1 | NM_002591.3 | GGTTCCCAGGGTGCATGAAA | CACGTAGGGTGAATCCGTCAG | Human |
| G6Pc | NM_138387.3 | ATGAGTCTGGTTACTACAGCCA | AAGACAGGGCCGTCATTATGG | Human |
| mTOR | NM_004958.3 | TCTACCACGACAGCCCGGCA | TGGGGGCCCCGTTCCATCAT | Human |
| Rictor | NM_152756.3 | GTCCCGCTGGATCTGACCCGA | GAAGCGCTCGTAGCCCTGCTG | Human |
| Raptor | NM_020761.2 | CGCTTCTGCTGACGGCCACA | TCGCGTCGTTGGCAGCATGT | Human |
| mTOR | NM_020009.2 | CGGGCCTCATTGGCTGGGTG | AACGGCCAGGGAGCGGGTAT | Mouse |
| Rictor | NM_030168.3 | ACCCGGCAGTATGTGCGAGC | ACCTGCCCACGAGCGGAATG | Mouse |
| Raptor | NM_028898.2 | CTGGGCCTTGGCAATATGGCGT | ACTCGCCTGAGGGGCTGCAA | Mouse |
| Cyclophilin | NM_008907.1 | CTTCTTGCTGGTCTTGCCATTCCT | GGATGGCAAGCATGTGGTCTTTG | Mouse |
| Cyclophilin | NM_021130.3 | AAGACTGAGTGGTTGGATGG | CGAGAGCACAAAGATTCTAGG | Human |
Rictor knockdown
Knockdown of rictor protein in HepG2 cells used an siRNA approach. HepG2 cells were grown in 12-well plates to ∼30–50% confluence; cells were transfected with either siRNA rictor or control siRNA (scrambled RNA) at 100 pmol/well plus 2 μl/well of the X-tremeGENE siRNA transfection reagent according to the manufacturer's recommendations. Cells were also infected with either Ad-Luc or Ad-Elovl5 (20 IU/cell). Cells were maintained in DMEM + FBS for 72 h before harvest for protein analysis.
Immunoprecipitation
Mouse liver extracts (1 mg protein/ml) were incubated with 10 μl of antibody-conjugated sepharose beads. The antibodies conjugated to sepharose beads were against rictor or raptor; IgG served as a control. Extracts were incubated with antibody sepharose beads overnight at 4°C. The following day, the beads were centrifuged at 14,000 g for 30 s at 4°C. The immunoprecipitates were collected and washed with cell lysis buffer five times. The beads were resuspended with protein denaturing buffer containing SDS, boiled, and centrifuged; the supernatants were applied to SDS-PAGE gels for electrophoresis. Specific proteins were detected by immunoblotting as described above.
Lipid extraction and FA analysis
Total lipids from liver and HepG2 cells were extracted, saponified, methylated, and quantified by gas chromatography as described previously (2, 30).
Statistical analysis
The statistical analyses performed in this study included ANOVA plus post hoc Tukey test and Student's t-test by using the statistical software StatView. P < 0.05 was considered statistically different. Data are expressed as mean ± SD.
RESULTS
Elovl5 regulates Akt2 and FoxO1 phosphorylation in mouse liver and human hepatoma (HepG2) cells
Hepatic Elovl5 activity in obese glucose-intolerant mice is ∼60–75% below levels in livers of lean glucose-tolerant mice. Infection of obese mice with Ad-Elovl5 increases Elovl5 activity ∼3-fold; to a level ∼50% above the level expressed in livers of lean mice. Increased hepatic Elovl5 activity correlated with increased Akt2 and FoxO1 phosphorylation, decreased hepatic Pck1 expression, and restoration of euglycemia (2). When compared with Ad-Luc-infected mice, elevated Elovl5 activity (Ad-Elovl5 infection) significantly increased Akt2-S473 and FoxO1-S256 phosphorylation, but not Akt-T308 phosphorylation, in livers of fasted obese-glucose intolerant mice (Fig. 1A, B). Infection of HepG2 cells with Ad-Elovl5 increased Elovl5 protein ∼2-fold (30), and increased Akt2-S473 and FoxO1-S256, but not Akt2-T308, phosphorylation (Fig. 1C, D). Thus, Elovl5 regulates Akt activity by selectively phosphorylating Akt-S473 in mouse liver and HepG2 cells.
Fig. 1.

Elovl5 regulates the phosphorylation of Akt and FoxO1 in mouse liver and HepG2 cells. A, B : Mouse liver extracts from fasted obese glucose-intolerant mice infected with either Ad-Luc or Ad-Elovl5 were prepared and examined for total and phosphoprotein abundance as described previously (2). A: Representative immunoblots, n = three mice per treatment. B: Quantified levels of protein phosphorylation for Akt2-S473, Akt2-T308, and FoxO1-S256. Results are from two separate studies and are expressed as mean ± SD, n = 6. * P ≤ 0.05 versus Ad-Luc. Phosphorylation status is based on the ratio of phosphoprotein divided by total protein as quantified by immunoblot and Licor Odyssey software. C, D: HepG2 cells infected with Ad-Luc or Ad-Elovl5 for 48 h were serum starved overnight. The next day, cells were harvested to prepare total cell extracts and quantify levels of total and phospho-Akt and FoxO1. C: Representative immunoblots for total and phospho-Akt2-S473, Akt2-T308, and FoxO1-S256. D: Phosphorylation status was quantified as above. Results are representative of three separate studies; results are expressed as mean ± SD, n = 3. * P ≤ 0.05 versus Ad-Luc.
ADA-FoxO1 overrides Elovl5 suppression of GNG genes in HepG2 cells
To determine whether Elovl5 effects on the expression of gluconeogenic enzymes (i.e., Pck1 and G6Pc) required FoxO1 phosphorylation, HepG2 cells were infected with Ad-Luc or Ad-Elovl5 in the absence and presence of Ad-ADA-FoxO1. Ad-ADA-FoxO1 expresses a form of FoxO1 that is insensitive to phosphorylation control (29). Infection of HepG2 cells with Ad-Elovl5 significantly decreased Pck1 and G6Pc mRNA abundance by >70% and ∼50% (P < 0.05), respectively (Fig. 2). Including Ad-ADA-FoxO1 in the infection scheme induced Pck1 and G6Pc mRNA and completely abolished Elovl5 regulation of Pck1 and G6Pc mRNA abundance. Thus, Elovl5 control of Pck1 and G6Pc expression in HepG2 cells requires increased FoxO1 phosphorylation.
Fig. 2.

Overexpressed ADA-FoxO1 abrogates Elovl5 suppression of Pck1 and G6Pc in HepG2 cells. HepG2 cells were infected with Ad-Luc (control virus) and Ad-Elovl5 in the absence and presence of Ad-ADA-FoxO1 for 48 h. ADA-FoxO1 is insensitive to phosphorylation control (29). As in Fig. 1, cells were serum starved overnight and harvested the following day for RNA extraction and quantitation of Pck1 (A), G6Pc (B), and cyclophilin mRNA by qRT-PCR. Results are representative of three separate studies; results are expressed as mean ± SD, n = 3. * P ≤ 0.05 versus Ad-Luc; # P ≤ 0.05 versus no Ad-ADA-FoxO1 (None).
Elovl5 control of FoxO1-S256 phosphorylation requires Akt2
To determine whether active Akt2 was required for Elovl5 control of FoxO1-S256 phosphorylation, HepG2 cells were first infected with Ad-Luc or Ad-Elovl5 and then treated with vehicle or the Akt1/2 inhibitor (Akti1/2, at 3 μM) (31). Infection of HepG2 cells with Ad-Elovl5 significantly increased (≥50%, P < 0.05) the phosphorylation of Akt2-S473 and FoxO1-S256. Akti1/2 essentially blocked the Elovl5-mediated increase in Akt2-S473 and FoxO1-S256 phosphorylation (Fig. 3A–C). Thus, active Akt2 is required for Elovl5 control of FoxO1-S256 phosphorylation. Akti1/2 did not affect the phosphorylation of Akt2-T308.
Fig. 3.

Akt activity is required for Elovl5 control of FoxO1-S256 phosphorylation in HepG2 cells. HepG2 cells were infected with Ad-Luc or Ad-Elovl5 for 48 h and starved overnight as described above in Figs. 1 and 2. Cells were treated with vehicle (DMSO) or the Akt1/2 inhibitor (Akti1/2, 3 μM) for 30 min. Proteins were extracted, and protein abundance of Akt2, phospho-Akt1/2/3-S473, FoxO1, and phospho-FoxO1-S256 was measured. A: Representative immunoblots, n = 3 per treatment. B: Phosphorylation status of Akt2-S473. C: Phosphorylation status of FoxO1-S256. Results are representative of three separate studies and are expressed as mean ± SD, n = 3. * P ≤ 0.05 versus Ad-Luc; # P ≤ 0.05 versus vehicle.
The mTORC2 pathway is required for Elovl5 control of Akt2-S473 and FoxO1-S256 phosphorylation in mouse liver and HepG2 cells
Whereas Akt2-S473 is phosphorylated by mTORC2, the Akt2-T308 site is phosphorylated by PI3-kinase-PDK1 (23, 32–34). We assessed the role that mTORC2 played in Elovl5-mediated control of Akt2-S473 phosphorylation. We first examined the impact of diet and Elovl5 activity on the mammalian target of rapamycin complex-1 (mTORC1) and the mammalian target of rapamycin complex-2 (mTORC2) components, namely raptor, rictor, and mTOR (Fig. 4). Elevated Elovl5 activity increased rictor and mTOR mRNA in both lean and obese mice ≥2-fold (P < 0.05). Interestingly, raptor mRNA abundance was suppressed by ∼70% in livers of obese mice; elevated Elovl5 activity further decreased raptor mRNA. Similar effects were seen in HepG2 cells (Fig. 4B); increased Elovl5 expression induced rictor and mTOR, but suppressed raptor mRNA abundance.
Fig. 4.

Elovl5 regulates rictor and mTOR mRNA abundance in mouse liver and HepG2 cells. A: RNA was extracted from livers of lean and obese mice (Materials and Methods; Fig. 1A) and HepG2 cells (B). mRNA abundance was measured by qRT-PCR using the primers for rictor, raptor, mTOR, and cyclophilin (Table 1). Cyclophilin was used as a housekeeping gene. A: mRNA abundance in livers of lean and obese mice infected with either Ad-Luc or Ad-Elovl5. Results are expressed as fold change, relative to the abundance of the mRNA in liver of lean Ad-Luc-infected mice. Results are from two separate studies and are expressed as the mean ± SD, n = 6. B: mRNA abundance in HepG2 cells infected with either Ad-Luc or Ad-Elovl5. Results are expressed as fold change, relative to the abundance of the mRNA in cells infected with Ad-Luc. Results are representative of three separate studies; results are expressed as mean ± SD, n = 3. * P ≤ 0.05 versus Ad-Luc.
To determine whether these changes in mRNA correlated with changes in protein and mTOR phosphorylation, hepatic extracts from lean and obese mice infected with either Ad-Luc or Ad-Elovl5 (2) were quantified by immunoblotting (Fig. 5). Elevated hepatic Elovl5 activity did not significantly increase hepatic mTOR protein abundance (Fig. 5A), an effect that did not correlate with the changes in mTOR mRNA (Fig. 4). Instead, elevated Elovl5 expression significantly increased phosphorylation of mTOR-S2448 in obese but not in lean mice (Fig. 5A, B). Phosphorylated mTOR-S2448 is an active kinase (23, 35). The mTORC2-associated regulatory protein, rictor, was significantly induced by increased Elovl5 activity in both lean and obese mice (Fig. 5C), an effect that correlated with Ad-Elovl5-mediated increase in rictor mRNA (Fig. 4). Whereas the high-fat diet significantly suppressed hepatic raptor protein abundance, elevated Elovl5 activity had no further effect on hepatic raptor content (Fig. 5A, D). Neither diet nor changes in Elovl5 activity significantly affected hepatic abundance of other mTOR-associated proteins, mSIN1 and GβL (Fig. 5A).
Fig. 5.

Diet and Elovl5 regulate mTOR, rictor, and raptor protein abundance in mouse liver. C57BL/6J mice were fed a low-fat diet (10% calories as fat; lean) or a high-fat diet (60% calories as fat; obese) for 12 weeks. Mice were infected with Ad-Luc or Ad-Elovl5 5 days prior to termination of the experiment. Five days after infection, mice were fasted overnight and euthanized the following day (Materials and Methods) (2). Hepatic protein extracts were assayed for protein levels of mTOR, mTOR-S2448 phosphorylation, rictor, raptor, mSin1, GβL, and Na,K-ATPase. A: Representative immunoblots (n = 3) separate mouse liver extracts per treatment. B: Phosphorylation status of mTOR-S2448; hepatic protein abundance of rictor (C) and raptor (D). Results are from two separate studies and are expressed as mean ± SD, n = 6. * P ≤ 0.05 versus lean Ad-Luc; # P ≤ 0.05 versus obese Ad-Luc.
mTOR is the catalytic (kinase) subunit for both mTORC1 and mTORC2 (36, 37). Raptor and rictor play key roles in complex assembly and substrate selection for mTOR kinase (23, 33). The observed increase in rictor protein abundance with Elovl5 overexpression may facilitate rictor-mTOR interaction. To test this possibility, immunoprecipitation and immunoblotting were used to examine the impact of Elovl5 on mTOR interaction with rictor and raptor (Fig. 6). Extracts from diet-induced obese mice infected with Ad-Luc or Ad-Elovl5 were treated with antibodies against rictor (rictor-IP) or raptor (raptor-IP); IgG served as a control for nonspecific immunoprecipitation. The immunoprecipitates were collected, denatured, electrophoresed, immunoblotted, and assayed for the presence of rictor, raptor, and mTOR. The rictor sepharose bead-conjugated antibody pulled down both rictor and mTOR. Elevated Elovl5 activity increased the immunoprecipitation of both mTOR and rictor. Elovl5 not only increased hepatic levels of rictor protein, Elovl5 promoted the physical interaction of rictor with mTOR. In contrast, raptor sepharose bead-conjugated antibody did not pull down raptor or mTOR. The low level of raptor in these hepatic extracts probably explains this result.
Fig. 6.
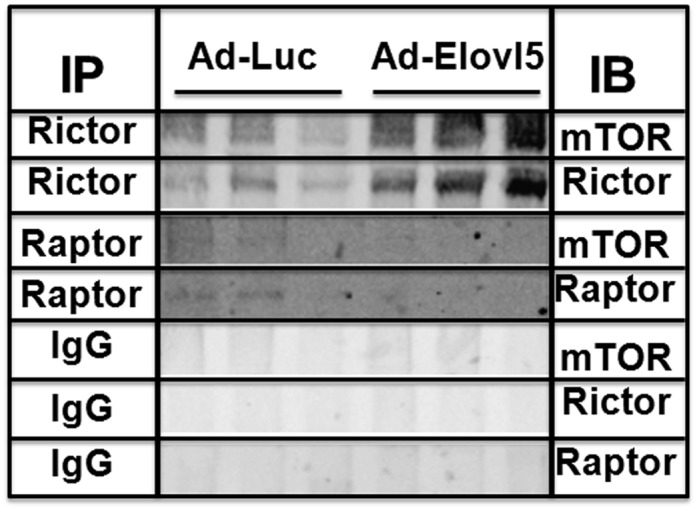
Elovl5 induces rictor-mTOR interaction in livers of obese mice. Hepatic extracts from obese C57BL/6J mice infected with Ad-Luc or Ad-Elovl5 were treated with antibodies against rictor and raptor (Materials and Methods). IgG was used as a control for nonspecific immunoprecipitation. Immunoprecipitates (IP) were collected and proteins separated for immunoblotting (IB) with antibodies against mTOR, rictor, and raptor. The immunoblot data are from hepatic extracts from three separate mice infected with either Ad-Luc or Ad-Elovl5 and are representative of two separate studies.
Rictor knockdown (siRNA) attenuates Elovl5-mediated induction of Akt2-S473 and FoxO1-S256 phosphorylation
To verify the role of rictor in Elovl5 control of Akt2 and FoxO1, siRNA was used to knock down rictor. Transfection of HepG2 cells with rictor siRNA significantly decreased rictor protein abundance and mTOR-S2448 phosphorylation (∼50%; P < 0.05) (Fig. 7A–C). Increased Elovl5 expression in HepG2 cells significantly induced Akt2-S473 and FoxO1-S256 phosphorylation by 6- and 3-fold (P < 0.05), respectively (Fig. 7D, E). Rictor knockdown, however, attenuated this response by ∼50% (Fig. 7D, E). Rictor knockdown had no impact on Akt2-T308 phosphorylation (data not shown). Thus, Elovl5 regulation of rictor protein abundance is required for Elovl5 to induce Akt2-S473 and FoxO1-S256 phosphorylation.
Fig. 7.

siRNA knockdown of rictor attenuates Elovl5 control of Akt2-S473 and FoxO1-S256 phosphorylation in HepG2 cells. HepG2 cells were infected with either Ad-Luc or Ad-Elovl5. Both groups of cells received no siRNA (None), scrambled siRNA, or siRNA-Rictor. After 72 h, cells were serum starved overnight and harvested the following day for protein extraction and immunoblotting. Levels of rictor, Akt2, phospho-Akt1/2/3-S473, FoxO1, phospho-FoxO1-S256, mTOR, and phospho-mTOR-S2448 and TBP (loading control) were measured as described above. A: Representative immunoblots, two extracts per treatment. B: Rictor protein abundance. C–E: Phosphorylation status of mTOR-S2448, Akt2-S473, and FoxO1-S256. Results are representative of three separate studies and are expressed as mean ± SD, n = 3. * P ≤ 0.05 versus Ad-Luc; # P ≤ 0.05 versus Ad-Luc + scrambled siRNA.
Further verification of the involvement of rictor in mTORC2 in this regulatory scheme evaluated the impact of rapamycin (a selective chemical inhibitor for mTORC1) and PP242 (a dual chemical inhibitor for mTORC1 and mTORC2). Treatment of HepG2 with rapamycin lowered the phosphorylation of mTOR and p70S6K, a target of mTOR, but did not block the Ad-Elovl5-mediated increase in Akt2-S473 or FoxO1-S256 phosphorylation (see supplementary Fig. IA–D). In contrast, PP242 suppressed mTOR and p70S6K phosphorylation and blocked the Elovl5-stimulated increase in Akt2-S473 and FoxO1-S256 phosphorylation (see supplementary Fig. IIA–D). Taken together with the siRNA studies (Fig. 7), these studies support the notion that increasing hepatic (or HepG2) Elovl5 activity induces rictor protein, mTOR-rictor interaction, and the phosphorylation of both Akt-S473 and FoxO1-S256. The consequence of this pathway is the suppression of expression of genes involved in GNG.
Changes in rictor phosphorylation regulate rictor activity (38–41). Gsk3β, a downstream target of Akt, is one kinase that phosphorylates rictor. Gsk3β activity is regulated by phosphorylation; and phosphorylation of Gsk3β-S9 (an Akt site) inhibits Gsk3β activity (1), whereas phosphorylation of Gsk3β-Y216 induces Gsk3β activity (38). Active Gsk3β (phospho-Gsk3β-Y216) phosphorylates rictor-S1235, a modification that interferes with rictor binding to Akt and ultimately reduces mTORC2-mediated Akt-S473 phosphorylation (38). Although no antibody against phospho-rictor-S1235 is currently commercially available, we show that Elovl5 induces Gsk3β-S9 but not Gsk3β-Y216 phosphorylation or rictor-T1135 phosphorylation (see supplementary Fig. IIIA–D). These results suggest that Elovl5 activity regulates mTORC2 by inducing rictor protein and not by regulating rictor phosphorylation through Gsk3β.
Elovl5 effects on FA composition in livers of obese glucose-intolerant mice and HepG2 cells
Elovl5 elongates specific C16–20 MUFAs and PUFAs (1, 4, 5), including palmitoleic acid (16:1,n-7), linoleic acid (18:2,n-6), γ-linolenic acid (18:3,n-6), arachidonic acid (20:4,n-6) and n-3 PUFA, stearidonic acid (18:4,n-3) and eicosapentaenoic acid (20:5,n-3). The corresponding Elovl5 elongation products are 18:1,n-7 (cis-vaccenic acid), 11, 14-eicosadienoic acid (20:2,n-6) and dihomo-γ-linolenic acid (20:3,n-6), adrenic acid (22:4,n-6), 8, 11, 14, 17-eicosatetraenoic acid (20:4,n-3) and docosapentaenoic acid (22:5,n-3), respectively (2, 4, 5). The hepatic FA composition in lean and obese mice was previously reported (2). Herein, we focus on the relative abundance of major Elovl5 substrates (16:1,n-7, 18:2,n-6, and 18:3,n-6) and products (18:1,n-7, 20:2,n-6, and 20:3,n-6) in liver and HepG2 cells.
The mol% of two n-7 MUFAs, i.e., 16:1,n-7 and 18:1n-7, decreased significantly (>50%, P ≤ 0.05) in livers of Ad-Luc-infected obese mice, when compared with Ad-Luc-infected lean mice (Fig. 8A). The mol% of 18:2,n-6 was 15.3 ± 2.9, 11.9 ± 1.3, 20.9 ± 1.9, and 19.7 ± 0.6 in lean, Ad-Luc; lean, Ad-Elovl5; obese, Ad-Luc; and obese Ad-Elovl5 mice, respectively. Thus, hepatic 18:2,n-6 content increases with obesity. Ad-Elovl5 infection resulted in a ≥50% (P ≤ 0.05) increase in 20:2,n-6 and 20:3,n-6 in lean and obese mice. (Fig. 8B).
Fig. 8.

Elovl5 regulates FA composition in livers of obese glucose-intolerant mice and HepG2 cells. Lipids were extracted and FA analysis was performed on livers of lean and obese mice (Materials and Methods) and HepG2 cells. A: n-7 MUFAs from livers of lean and obese mice infected with either Ad-Luc or Ad-Elovl5 are expressed as FA mol%. B: n-6 PUFAs from livers of lean and obese mice infected with either Ad-Luc or Ad-Elovl5 are expressed as FA mol%. C: The mole ratio of 18:1,n-7/16:1,n-7 and 20:3,n6/18:3,n6 in livers of lean and obese mice infected with either Ad-Luc or Ad-Elovl5. D: Ratio of FA pairs in HepG2 cells infected with Ad-Luc or Ad-Elovl5. Results are expressed as mean ± SD, n = 3. * P ≤ 0.05 versus Ad-Luc.
The ratio of 18:1,n-7 to 16:1,n-7 was significantly increased (2.5-fold, P < 0.05) in obese mice infected with Elovl5, whereas the ratio of 20:3,n-6 to 18:3,n-6 was significantly increased (≥2-fold, P ≤ 0.05) in both lean and obese mice infected with Ad-Elovl5 (Fig. 8C). Elevated Elovl5 activity increased hepatic levels of both 18:1,n-7 and 20:3,n-6. The hepatic ratio of 20:2,n-6 to 18:2,n-6 was very low (<0.1); elevated Elovl5 activity increased this ratio ∼2-fold (not shown). Thus, changes in Elovl5 activity regulate hepatic abundance of both n-7 and n-6 PUFAs.
To determine whether similar changes occur in HepG2 cells infected with Ad-Elovl5, we examined the FA profile of HepG2 cells infected with Ad-Luc or Ad-Elovl5. The FA profiles of HepG2 cells and the medium used to grow cells are shown in supplementary Fig. IV. Although these cells contain 16:1,n-7 and 18:2,n-6, cellular levels of 18:3,n-6 are very low because of low 18:2,n-6 and low FADS2 expression (30). Elevated Elovl5 activity significantly increased (∼40%, P < 0.05) the 18:1,n-7/16:1,n-7 ratio, but had no effect on other FA ratios (Fig. 8D). This effect of Ad-Elovl5 infection of HepG2 cells correlated with the increase in 18:1,n-7 production in liver of Ad-Elovl5-infected mice (Fig. 8C).
Effects of Elovl5 mediated MUFA and PUFA elongation on Akt-S473 and FoxO1-S256 phosphorylation in HepG2 cells
To determine whether changes in MUFA or PUFA content were required for Elovl5 induction of rictor in HepG2 cells, cells were infected with Ad-Luc or Ad-Elovl5 and treated with either no FA, 16:1,n-7, or 18:3,n-6 at 50 μM for 48 h (Fig. 9). Rictor protein was increased ≥30% (P < 0.05) in all cells infected with Ad-Elovl5. Addition of 16:1,n-7 but not 18:3,n-6 to the media augmented this response to ∼50% (P < 0.05). Although Elovl5 induced Akt-S473 and FoxO1-S256 in all treatments, only 16:1,n-7 treatment induced the phosphorylation of Akt and FoxO1 in the absence of elevated Elovl5 activity.
Fig. 9.

Effects of Elovl5-mediated 16:1,n-7 and 18:3,n-6 elongation on Akt-S473 and FoxO1-S256 phosphorylation in HepG2 cells. HepG2 cells were infected with either Ad-Luc or Ad-Elovl5. Both groups of cells received vehicle (ethanol), 16:1,n-7, or 18:3,n-6 at 50 μM for 48 h. After treatment, cells were harvested for protein extraction, and immunoblotting analysis was performed. Levels of rictor, Na,K-ATPase (loading control), Akt2, phospho-Akt1/2/3-S473, FoxO1, and phospho-FoxO1-S256 were measured as described above. A: Representative immunoblots, 1 extract per treatment. B: Rictor protein abundance. C, D: phosphorylation status of Akt2-S473 and FoxO1-S256. Results are representative of three separate studies. Results are expressed as mean ± SD, n = 3. * P ≤ 0.05 versus Ad-Luc + vehicle.
We next examined other MUFAs for their control of Akt and FoxO1 phosphorylation. HepG2 cells were not infected with either Ad-Luc or Ad-Elovl5, but instead were treated with 14:1,n-5, 16:1,n-7, 18:1,n-7, or 18:1,n-9 at 50 μM for 48 h. Of these, only 16:1,n-7 and 18:1,n-7 induced Akt-S473 and FoxO1-S256 phosphorylation (Fig. 10). We also examined several C18–22 n-3 and n-6 PUFAs and found no effect of these FAs on Akt or FoxO1 phosphorylation (data not shown).
Fig. 10.

Effects of various MUFAs on Akt-S473 and FoxO1-S256 phosphorylation in HepG2 cells. HepG2 cells were treated with vehicle (ethanol), 14:1,n-5, 16:1,n-7, 18:1,n-7, or 18:1,n-9 at 50 μM for 48 h. After treatment, cells were harvested for protein extraction and immunoblotting analysis as described above. Levels of Akt2, phospho-Akt1/2/3-S473, FoxO1, and phospho-FoxO1-S256 were measured. A: Representative immunoblots, 1 extract per treatment. B, C: Phosphorylation status of Akt2-S473 and FoxO1-S256. Results are representative of three separate studies and are expressed as mean ± SD, n = 3. * P ≤ 0.05 versus vehicle.
The time course for the 16:1,n-7 and 18:1,n-7 effects on rictor protein, Akt, and FoxO1 phosphorylation showed (Fig. 11) that rictor protein was induced 2-fold (P ≤ 0.05) within 24 h of initiating treatment and 4-fold after 48 h of FA treatment. The induction of Akt-S473 and FoxO1-S256 phosphorylation required a minimum of 24 h to reach a significant difference from untreated cells. FoxO1-S256 phosphorylation appears more responsive to 18:1,n-7 than 16:1,n-7 (Fig. 11A–D).
Fig. 11.

Time course of 16:1,n-7 and 18:1,n-7 effects on rictor protein abundance and Akt-S473 and FoxO1-S256 phosphorylation in HepG2 cells. HepG2 cells were treated with 16:1,n-7 or 18:1,n-7 at 50 μM for the times indicated in the figure, and cells were harvested for protein extraction and immunoblotting. Levels of rictor, TBP (loading control), Akt2, phospho-Akt1/2/3-S473, FoxO1, and phospho-FoxO1-S256 were measured as described above. A, B: Representative immunoblots for 16,n-7 and 18:1,n-7 treated cells, respectively, two extracts per treatment. C–E: Rictor protein abundance, phosphorylation status of Akt2-S473, and FoxO1-S256. Results are representative of three separate studies and are expressed as mean ± SD, n = 3. * P ≤ 0.05 versus no FA treatment (zero-time).
Soraphen A inhibits Elovl5 and 16:1,n-7 regulation of Rictor, Akt, and FoxO1
To assess the requirement for FA elongation in the MUFA and Elovl5 control of rictor, Akt, and FoxO1, cells were treated with soraphen A. Soraphen A inhibits acetyl CoA carboxylase-1 and -2 activity, lowers cellular malonyl CoA, and increases FA oxidation in HepG2 cells (30). Because malonyl CoA is a substrate for FA elongation, soraphen A also inhibits FA elongation.
HepG2 cells were infected with Ad-Luc or Ad-Elovl5 and also treated with 16:1,n-7 in the absence (DMSO) or presence of soraphen A (Sor A, 200 nM). Elevated Elovl5 activity increased rictor protein abundance and Akt and FoxO1 phosphorylation. Furthermore, adding 16:1,n-7 to the media augmented this response (Fig. 12A–D). Cells treated with soraphen A, however, blocked 16:1,n-7 and Elovl5-mediated induction of rictor protein. Changes in Akt-S473 and FoxO1-S256 phosphorylation paralleled changes in rictor protein (Fig. 12A–D).
Fig. 12.

Soraphen A inhibits Elovl5 regulation of rictor protein, Akt-S473, and FoxO1-S256 phosphorylation in HepG2 cells. HepG2 cells were infected with either Ad-Luc or Ad-Elovl5. A–D: Both groups of cells received vehicle (DMSO), soraphen A, DMSO + 16:1,n-7, or soraphen A + 16:1,n-7, 48 h; 16:1,n-7 was used at 50 μM, and soraphen A was used at 200 nM. After treatment, cells were harvested for protein extraction, and immunoblotting analysis was performed. Levels of rictor, TBP (loading control), Akt2, phospho-Akt1/2/3-S473, FoxO1, and phospho-FoxO1-S256 were measured as described above. A: Representative immunoblots, 1 extract per treatment. B: Rictor protein abundance. C, D: Phosphorylation status of Akt2-S473 and FoxO1-S256. E, F: The same protocol as described for A–D was used for E, F except that 18:1,n-7 was the FA used in this analysis. E: Representative immunoblots, 1 extract per treatment. F: Rictor protein abundance. G, H: Phosphorylation status of Akt2-S473 and FoxO1-S256. Results are representative of three separate studies and are expressed as mean ± SD, n = 3. For A–D, * P ≤ 0.05 versus Ad-Luc + DMSO; # P ≤ 0.05 versus 16:1,n-7 + DMSO. For E–H, * P ≤ 0.05 versus Ad-Luc + DMSO; # P ≤ 0.05 versus Elovl5 + DMSO.
To determine whether this effect was due to FA elongation and not to other actions of soraphen A, we repeated the study by replacing 16:1,n-7 with 18:1,n-7 (Fig. 12E–H). Soraphen A blocks 16:1,n-7 but not 18:1,n-7 regulation of rictor, Akt, and FoxO1. Accordingly, FA elongation of 16:1,n-7 to 18:1,n-7 is required for Elovl5 and 16:1,n-7 regulation of rictor and the phosphorylation of Akt2-S473 and FoxO1-S256.
DISCUSSION
Our previous study established that a high-fat lard diet (60% energy as fat) lowered hepatic Elovl5 expression and activity and also lowered hepatic content of several MUFA and PUFA products of Elovl5. This diet also increased hepatic nuclear abundance of FoxO1 and elevated expression of genes (Pck1 and G6Pc) involved in GNG. These changes in FoxO1 nuclear abundance and gene expression were associated with hyperglycemia, glucose intolerance, and insulin resistance. Adenoviral-mediated induction of hepatic Elovl5 activity in obese glucose-intolerant mice reversed these diet-induced effects on hepatic metabolism (2).
The findings in this report extend our previous study by establishing that Elovl5 regulated 18:1,n-7 synthesis controls the mTORC2-Akt-FoxO1 pathway and the expression of genes (Pck1 and G6Pc) involved in GNG. We established that increasing hepatic Elovl5 activity increases hepatic rictor through a pretranslational mechanism. Increased rictor protein promotes rictor-mTOR interaction to form mTORC2 and the stimulation of Akt-S473 but not Akt-T308 phosphorylation in liver and HepG2 cells (Figs. 1, 4–6). Based on studies that examined rictor-T1135 and Gsk3β phosphorylation, Elovl5 controls rictor protein abundance but may not control its phosphorylation status (see supplementary Fig. III). However, more studies are required to verify this mechanism. The selective effect of Elovl5 on Akt-S473 phosphorylation, the requirement for active Akt for Elovl5 control of FoxO1, coupled with the knockdown of rictor (Fig. 7) and inhibition of mTORC2 activity (see supplementary Figs. I, II) support the role of rictor as a key mediator of Elovl5 regulation of FoxO1 and gluconeogenic gene expression. As far as we are aware, this represents the first documented linkage between FA elongation and the mTORC2 pathway (Fig. 13).
Fig. 13.

Molecular mechanism for Elovl5 control of mTORC2, FoxO1-S256 phosphorylation, and hepatic GNG. See the text for details. Green arrow indicates increased response, and red arrow indicates decreased response.
We also established the metabolic basis for Elovl5 regulation of rictor, Akt, and FoxO1. As an FA elongase, Elovl5 elongates MUFAs and PUFAs, but not saturated FAs. This effect, however, is substrate specific; 16:1,n-7, 18:2,n-6, 18:3,n-6, 20:4,n-6, 18:4,n-3,and 20:5,n-3 are Elovl5 substrates (4, 5). Livers of obese mice contain low levels of 16:1,n-7 and 18:1,n-7 when compared with lean mice; they also have reduced levels of 20:4,n-6 (Fig. 8) (2). Although 16:1,n-7 and 18:1,n-7 are found in HepG2 cells, 18:3,n-6, 18:4,n-3, and 20:5,n-3 are below detection (see supplementary Fig. IV). Elevated Elovl5 activity in HepG2 cells increases the formation of 18:1,n-7 relative to 16:1,n-7 (Fig. 8D). The low level of 18:3,n-6 (see supplementary Fig. IV) and FADS2 expression in HepG2 cells (30) impairs 20:4,n-6 synthesis; 20:4,n-6 found in these cells is probably derived from the media. Addition of C18–22 n-3 or n-6 PUFA to HepG2 cells failed to induce rictor, or regulate Akt-S473 or FoxO1-S256 phosphorylation (data not shown). Thus, neither C18–22 n-6 or n-3 PUFA regulates rictor or FoxO1. This finding is consistent with the lack of effect of C20–22 ω3 PUFA on fasting blood glucose in diet-induced obese Ldlr−/− mice (42). In contrast, exogenously supplied 16:1,n-7 or 18:1,n-7, but not other MUFAs, induced Akt and FoxO1 phosphorylation in the absence of elevated Elovl5 activity (Fig. 10). A minimum of ∼24 h of MUFA treatment was required to see significant induction of rictor protein, Akt-S473, and FoxO1-S256 phosphorylation. Inhibition of FA elongation using soraphen A essentially blocked the 16:1,n-7 but not the 18:1,n-7 induction of rictor protein, Akt-S473, and FoxO1-S256 phosphorylation (Fig. 12). Accordingly, 18:1,n-7 and not 16:1,n-7 is the mediator of Elovl5 regulation of the mTORC2-Akt-FoxO1 pathway (Fig. 13). These studies clarify how changes in hepatic Elovl5 activity regulate the mTORC2-Akt-FoxO1 pathway.
Previous studies showed that changes in hepatic Elovl5 activity also affect SREBP1 nuclear abundance; SREBP-1 is a key regulator of lipogenic gene expression (2, 3). The control of hepatic SREBP-1 nuclear abundance by C20–22 n-3 and n-6 PUFA is well established (43–45). Elovl5 plays a dual role in hepatic metabolism; Elovl5 controls both hepatic FA and glucose synthesis, albeit through different pathways (Fig. 13).
Factors regulating cellular 18:1,n-7 content are important determinants in the control of rictor abundance and the mTORC2-Akt-FoxO1 pathway (Fig. 12). Enzymes that synthesize 18:1,n-7 include stearoyl CoA desaturases (SCDs), Elovl5, and Elovl6. Hepatic expression of SCD1, Elovl5, and Elovl6 is low in livers of C57BL/6J mice fed the high-fat lard diet (60% energy as fat) (2, 4). This diet contains high levels of 16:0 (22.5 mol%) and 18:1,n-9 (34.4 mol%) and low levels of 16:1,n-7 (1.8 mol%) and 18:1,n-7 (2.1 mol%). Thus, low dietary n-7 MUFAs and low expression of SCD1, Elovl5, and Elovl6 account for the low hepatic content of 16:1,n-7 and 18:1,n-7 in livers of obese glucose-intolerant mice.
In contrast, hepatic expression of SCD1 and Elovl6 is elevated in mouse models of carbohydrate-induced obesity and leptin deficiency (4, 46, 47). Ablation of these enzymes protects mice from diet-induced obesity and insulin resistance (46, 47). Hepatic expression of SCD1, Elovl5, and Elovl6 is increased in response to elevated hepatic SREBP1 nuclear abundance and leptin deficiency. Hepatic expression of SCD1 and Elovl6, but not Elovl5, is induced by high-carbohydrate diets and elevated ChREBP/MLX nuclear content (4). Expression of SCD1 and Elovl6 directs saturated FAs originating from de novo lipogenesis to the formation of stearic (18:0) and oleic acid (18:1,n-9). In contrast, SCD1 and Elovl5 will direct palmitate to the formation of 18:1,n-7 (4–6). Based on the studies reported here, the relative abundance of hepatic SCD1, Elovl5, and Elovl6 and their n-7 and n-9 MUFA products are important determinants in the control of the mTORC2 pathway and GNG.
The notion that n-7 MUFAs play a role in metabolic regulation is not new; adipose tissue-derived palmitoleic acid (16:1,n-7) was reported to act as a lipokine and to improve hepatic insulin action (48). A recent report examined the effects of adipose tissue 16:1,n-7 and SCD1 activity on the prevalence of obesity in 1,926 adults in Costa Rica. The authors found no evidence to support a lipokine role for adipose tissue 16:1,n-7 in the reduction of obesity occurrence (49). Others have reported that 16:1,n-7 promoted fatty liver but suppressed hepatic inflammation (50). Still another study suggests that 18:1,n-7 inhibits hepatosteatosis (51, 52). Although our previous reports described effects of elevated Elovl5 activity on hepatosteatosis (2), we suspect that this effect is linked to the capacity of Elovl5 to regulate hepatic content of C20–22 PUFA and hepatic SREBP1 nuclear abundance (Fig. 13) (42–45). In fact, addition of 18:3,n-6, but not 16:1,n-7, to the Elovl5-infected HepG2 cells significantly suppressed nuclear SREBP1 content (data not shown). As noted earlier, C18–22 n-3 and n-6 PUFAs regulate hepatic SREBP1 abundance, and dietary C20–22 n-3 attenuates hepatosteatosis in a mouse model of diet-induced fatty liver disease (42–45, 53). More recently, Wu et al. (54) reported that increased human plasma content of FAs derived from de novo lipogenesis, MUFA synthesis, and limited β-oxidation, i.e., 16:1,n-7, 18:1,n-7, 16:1,n-9, was associated with increased risk of sudden cardiac arrest. These FAs are in low abundance or absent in rodent and human diets, but are generated by elongation and desaturation reaction in cells. These reports, coupled with the data presented in this study, make clear that more study is required to establish the benefit, or lack of benefit, of 16:1,n-7 and 18:1,n-7 on human health.
In summary, we have identified cis-vaccenic acid (18:1,n-7) as a regulator of the mTORC2-Akt-FoxO1 pathway and a mediator of Elovl5 suppression of hepatic gluconeogenic gene expression. Decreased hepatic abundance of 18:1,n-7 is associated with increased expression of enzymes involved in GNG, glucose intolerance, and hyperglycemia. Increased hepatic production of 18:1,n-7 by elevated Elovl5 activity has the opposite effects on hepatic glucose metabolism and systemic control of blood glucose. These outcomes raise two key questions: 1) how does 18:1,n-7 regulate rictor expression, and 2) is dietary 18:1,n-7 alone sufficient to regulate hepatic glucose production in mouse models of obesity and diabetes. If so, dietary 18:1,n-7 might be useful in the management of blood glucose in humans with hyperglycemia.
Supplementary Material
Acknowledgments
The authors thank Dr. Domenico Accili (Columbia University, NYC, NY) for the Ad-ADA-FoxO1 recombinant adenovirus used in these studies. We also appreciate the efforts of Christopher M. Depner and Kelli A. Lytle in critical review of the manuscript.
Footnotes
Abbreviations:
- ChREBP
- carbohydrate regulatory element binding protein
- Elovl
- fatty acid elongase
- FADS1
- Δ5-fatty acid desaturase
- FADS2
- Δ6-fatty acid desaturase
- FoxO1
- forkhead box O1
- GβL
- G protein β-like
- GNG
- gluconeogenesis
- G6Pc
- glucose-6 phosphatase
- Gsk3β
- glycogen synthase 3β
- Pck1
- phosphoenolpyruvate carboxykinase
- mTOR
- mammalian target of rapamycin
- mTORC
- mammalian target of rapamycin complex
- MLX
- max-like factor X
- mSIN1
- mammalian stress-activated protein kinase (SAPK)-interacting protein 1
- PP2A-cat
- protein phosphatase-2A catalytic unit
- SCD
- stearoyl CoA desaturase
- SREBP1
- sterol regulatory element binding protein-1
This work was supported by National Institutes of Health Grants DK-043220 and DK-094600 and United States Department of Agriculture National Institute of Food and Agriculture Grant 2009-65200-05846. Its contents are solely the responsibility of the authors and does not necessarily represent the official views of the National Institutes of Health.
The online version of this article (available at http://www.jlr.org) contains supplementary data in the form of four figures.
REFERENCES
- 1.Wang Y., Torres-Gonzalez M., Tripathy S., Botolin D., Christian B., Jump D. B. 2008. Elevated hepatic fatty acid elongase-5 activity affects multiple pathways controlling hepatic lipid and carbohydrate composition. J. Lipid Res. 49: 1538–1552 [DOI] [PMC free article] [PubMed] [Google Scholar]
- 2.Tripathy S., Torres-Gonzalez M., Jump D. B. 2010. Elevated hepatic fatty acid elongase-5 activity corrects dietary fat-induced hyperglycemia in obese C57BL/6J mice. J. Lipid Res. 51: 2642–2654 [DOI] [PMC free article] [PubMed] [Google Scholar]
- 3.Moon Y. A., Hammer R. E., Horton J. D. 2009. Deletion of ELOVL5 leads to fatty liver through activation of SREBP-1c in mice. J. Lipid Res. 50: 412–423 [DOI] [PMC free article] [PubMed] [Google Scholar]
- 4.Wang Y., Botolin D., Xu J., Christian B., Mitchell E., Jayaprakasam B., Nair M. G., Peters J. M., Busik J. V., Olson L. K., et al. 2006. Regulation of hepatic fatty acid elongase and desaturase expression in diabetes and obesity. J. Lipid Res. 47: 2028–2041 [DOI] [PMC free article] [PubMed] [Google Scholar]
- 5.Green C. D., Ozguden-Akkoc C. G., Wang Y., Jump D. B., Olson L. K. 2010. Role of fatty acid elongases in determination of de novo synthesized monounsaturated fatty acid species. J. Lipid Res. 51: 1871–1877 [DOI] [PMC free article] [PubMed] [Google Scholar]
- 6.Ohno Y., Suto S., Yamanaka M., Mizutani Y., Mitsutake S., Igarashi Y., Sassa T., Kihara A. 2010. ELOVL1 production of C24 acyl-CoAs is linked to C24 sphingolipid synthesis. Proc. Natl. Acad. Sci. USA. 107: 18439–18444 [DOI] [PMC free article] [PubMed] [Google Scholar]
- 7.Aoki M., Jiang H., Vogt P. K. 2004. Proteasomal degradation of the FoxO1 transcriptional regulator in cells transformed by the P3k and Akt oncoproteins. Proc. Natl. Acad. Sci. USA. 101: 13613–13617 [DOI] [PMC free article] [PubMed] [Google Scholar]
- 8.Guo S., Rena G., Cichy S., He X., Cohen P., Unterman T. 1999. Phosphorylation of serine 256 by protein kinase B disrupts transactivation by FKHR and mediates effects of insulin on insulin-like growth factor-binding protein-1 promoter activity through a conserved insulin response sequence. J. Biol. Chem. 274: 17184–17192 [DOI] [PubMed] [Google Scholar]
- 9.Matsumoto M., Pocai A., Rossetti L., Depinho R. A., Accili D. 2007. Impaired regulation of hepatic glucose production in mice lacking the forkhead transcription factor Foxo1 in liver. Cell Metab. 6: 208–216 [DOI] [PubMed] [Google Scholar]
- 10.Puigserver P., Rhee J., Donovan J., Walkey C. J., Yoon J. C., Oriente F., Kitamura Y., Altomonte J., Dong H., Accili D., et al. 2003. Insulin-regulated hepatic gluconeogenesis through FOXO1-PGC-1alpha interaction. Nature. 423: 550–555 [DOI] [PubMed] [Google Scholar]
- 11.Cho H., Mu J., Kim J. K., Thorvaldsen J. L., Chu Q., Crenshaw E. B., III, Kaestner K. H., Bartolomei M. S., Shulman G. I., Birnbaum M. J. 2001. Insulin resistance and a diabetes mellitus-like syndrome in mice lacking the protein kinase Akt2 (PKB beta). Science. 292: 1728–1731 [DOI] [PubMed] [Google Scholar]
- 12.Brozinick J. T., Jr, Birnbaum M. J. 1998. Insulin, but not contraction, activates Akt/PKB in isolated rat skeletal muscle. J. Biol. Chem. 273: 14679–14682 [DOI] [PubMed] [Google Scholar]
- 13.Kohn A. D., Summers S. A., Birnbaum M. J., Roth R. A. 1996. Expression of a constitutively active Akt Ser/Thr kinase in 3T3-L1 adipocytes stimulates glucose uptake and glucose transporter 4 translocation. J. Biol. Chem. 271: 31372–31378 [DOI] [PubMed] [Google Scholar]
- 14.Liao J., Barthel A., Nakatani K., Roth R. A. 1998. Activation of protein kinase B/Akt is sufficient to repress the glucocorticoid and cAMP induction of phosphoenolpyruvate carboxykinase gene. J. Biol. Chem. 273: 27320–27324 [DOI] [PubMed] [Google Scholar]
- 15.Cho H., Thorvaldsen J. L., Chu Q., Feng F., Birnbaum M. J. 2001. Akt1/PKBalpha is required for normal growth but dispensable for maintenance of glucose homeostasis in mice. J. Biol. Chem. 276: 38349–38352 [DOI] [PubMed] [Google Scholar]
- 16.Yang J., Cron P., Thompson V., Good V. M., Hess D., Hemmings B. A., Barford D. 2002. Molecular mechanism for the regulation of protein kinase B/Akt by hydrophobic motif phosphorylation. Mol. Cell. 9: 1227–1240 [DOI] [PubMed] [Google Scholar]
- 17.Dormond O., Madsen J. C., Briscoe D. M. 2007. The effects of mTOR-Akt interactions on anti-apoptotic signaling in vascular endothelial cells. J. Biol. Chem. 282: 23679–23686 [DOI] [PMC free article] [PubMed] [Google Scholar]
- 18.Dong L. Q., Liu F. 2005. PDK2: the missing piece in the receptor tyrosine kinase signaling pathway puzzle. Am. J. Physiol. Endocrinol. Metab. 289: E187–E196 [DOI] [PubMed] [Google Scholar]
- 19.Sarbassov D. D., Guertin D. A., Ali S. M., Sabatini D. M. 2005. Phosphorylation and regulation of Akt/PKB by the rictor-mTOR complex. Science. 307: 1098–1101 [DOI] [PubMed] [Google Scholar]
- 20.Zong H., Bastie C. C., Xu J., Fassler R., Campbell K. P., Kurland I. J., Pessin J. E. 2009. Insulin resistance in striated muscle-specific integrin receptor beta1-deficient mice. J. Biol. Chem. 284: 4679–4688 [DOI] [PMC free article] [PubMed] [Google Scholar]
- 21.Pearce L. R., Huang X., Boudeau J., Pawlowski R., Wullschleger S., Deak M., Ibrahim A. F., Gourlay R., Magnuson M. A., Alessi D. R. 2007. Identification of Protor as a novel Rictor-binding component of mTOR complex-2. Biochem. J. 405: 513–522 [DOI] [PMC free article] [PubMed] [Google Scholar]
- 22.Wullschleger S., Loewith R., Hall M. N. 2006. TOR signaling in growth and metabolism. Cell. 124: 471–484 [DOI] [PubMed] [Google Scholar]
- 23.Hresko R. C., Mueckler M. 2005. mTOR.RICTOR is the Ser473 kinase for Akt/protein kinase B in 3T3-L1 adipocytes. J. Biol. Chem. 280: 40406–40416 [DOI] [PubMed] [Google Scholar]
- 24.Guertin D. A., Stevens D. M., Thoreen C. C., Burds A. A., Kalaany N. Y., Moffat J., Brown M., Fitzgerald K. J., Sabatini D. M. 2006. Ablation in mice of the mTORC components raptor, rictor, or mLST8 reveals that mTORC2 is required for signaling to Akt-FOXO and PKCalpha, but not S6K1. Dev. Cell. 11: 859–871 [DOI] [PubMed] [Google Scholar]
- 25.Wang R. H., Kim H. S., Xiao C., Xu X., Gavrilova O., Deng C. X. 2011. Hepatic Sirt1 deficiency in mice impairs mTorc2/Akt signaling and results in hyperglycemia, oxidative damage, and insulin resistance. J. Clin. Invest. 121: 4477–4490 [DOI] [PMC free article] [PubMed] [Google Scholar]
- 26.Hagiwara A., Cornu M., Cybulski N., Polak P., Betz C., Trapani F., Terracciano L., Heim M. H., Ruegg M. A., Hall M. N. 2012. Hepatic mTORC2 activates glycolysis and lipogenesis through Akt, glucokinase, and SREBP1c. Cell Metab. 15: 725–738 [DOI] [PubMed] [Google Scholar]
- 27.Zhang C., Wendel A. A., Keogh M. R., Harris T. E., Chen J., Coleman R. A. 2012. Glycerolipid signals alter mTOR complex 2 (mTORC2) to diminish insulin signaling. Proc. Natl. Acad. Sci. USA. 109: 1667–1672 [DOI] [PMC free article] [PubMed] [Google Scholar]
- 28.Housley M. P., Rodgers J. T., Udeshi N. D., Kelly T. J., Shabanowitz J., Hunt D. F., Puigserver P., Hart G. W. 2008. O-GlcNAc regulates FoxO activation in response to glucose. J. Biol. Chem. 283: 16283–16292 [DOI] [PMC free article] [PubMed] [Google Scholar]
- 29.Qiang L., Banks A. S., Accili D. 2010. Uncoupling of acetylation from phosphorylation regulates FoxO1 function independent of its subcellular localization. J. Biol. Chem. 285: 27396–27401 [DOI] [PMC free article] [PubMed] [Google Scholar]
- 30.Jump D. B., Torres-Gonzalez M., Olson L. K. 2011. Soraphen A, an inhibitor of acetyl CoA carboxylase activity, interferes with fatty acid elongation. Biochem. Pharmacol. 81: 649–660 [DOI] [PMC free article] [PubMed] [Google Scholar]
- 31.Lindsley C. W., Zhao Z., Leister W. H., Robinson R. G., Barnett S. F., Defeo-Jones D., Jones R. E., Hartman G. D., Huff J. R., Huber H. E., et al. 2005. Allosteric Akt (PKB) inhibitors: discovery and SAR of isozyme selective inhibitors. Bioorg. Med. Chem. Lett. 15: 761–764 [DOI] [PubMed] [Google Scholar]
- 32.Moore S. F., Hunter R. W., Hers I. 2011. mTORC2 protein-mediated protein kinase B (Akt) serine 473 phosphorylation is not required for Akt1 activity in human platelets. J. Biol. Chem. 286: 24553–24560 [DOI] [PMC free article] [PubMed] [Google Scholar]
- 33.Gu Y., Lindner J., Kumar A., Yuan W., Magnuson M. A. 2011. Rictor/mTORC2 is essential for maintaining a balance between beta-cell proliferation and cell size. Diabetes. 60: 827–837 [DOI] [PMC free article] [PubMed] [Google Scholar]
- 34.Breuleux M., Klopfenstein M., Stephan C., Doughty C. A., Barys L., Maira S. M., Kwiatkowski D., Lane H. A. 2009. Increased AKT S473 phosphorylation after mTORC1 inhibition is rictor dependent and does not predict tumor cell response to PI3K/mTOR inhibition. Mol. Cancer Ther. 8: 742–753 [DOI] [PMC free article] [PubMed] [Google Scholar]
- 35.Zoncu R., Efeyan A., Sabatini D. M. 2011. mTOR: from growth signal integration to cancer, diabetes and ageing. Nat. Rev. Mol. Cell Biol. 12: 21–35 [DOI] [PMC free article] [PubMed] [Google Scholar]
- 36.Efeyan A., Sabatini D. M. 2010. mTOR and cancer: many loops in one pathway. Curr. Opin. Cell Biol. 22: 169–176 [DOI] [PMC free article] [PubMed] [Google Scholar]
- 37.Emerling B. M., Akcakanat A. 2011. Targeting PI3K/mTOR signaling in cancer. Cancer Res. 71: 7351–7359 [DOI] [PubMed] [Google Scholar]
- 38.Chen C. H., Shaikenov T., Peterson T. R., Aimbetov R., Bissenbaev A. K., Lee S. W., Wu J., Lin H. K., Sarbassov Dos D. 2011. ER stress inhibits mTORC2 and Akt signaling through GSK-3β-mediated phosphorylation of rictor. Sci. Signal. 4: ra10 doi: 10.1126/scisignal.2001731 [DOI] [PubMed] [Google Scholar]
- 39.Dibble C. C., Asara J. M., Manning B. D. 2009. Characterization of Rictor phosphorylation sites reveals direct regulation of mTOR complex 2 by S6K1. Mol. Cell. Biol. 29: 5657–5670 [DOI] [PMC free article] [PubMed] [Google Scholar]
- 40.Julien L. A., Carriere A., Moreau J., Roux P. P. 2010. mTORC1-activated S6K1 phosphorylates Rictor on threonine 1135 and regulates mTORC2 signaling. Mol. Cell. Biol. 30: 908–921 [DOI] [PMC free article] [PubMed] [Google Scholar]
- 41.Treins C., Warne P. H., Magnuson M. A., Pende M., Downward J. 2010. Rictor is a novel target of p70 S6 kinase-1. Oncogene. 29: 1003–1016 [DOI] [PubMed] [Google Scholar]
- 42.Depner C. M., Torres-Gonzalez M., Tripathy S., Milne G., Jump D. B. 2012. Menhaden oil decreases high-fat diet-induced markers of hepatic damage, steatosis, inflammation, and fibrosis in obese Ldlr−/− mice. J. Nutr. 142: 1495–1503 [DOI] [PMC free article] [PubMed] [Google Scholar]
- 43.Jump D. B., Botolin D., Wang Y., Xu J., Demeure O., Christian B. 2008. Docosahexaenoic acid (DHA) and hepatic gene transcription. Chem. Phys. Lipids. 153: 3–13 [DOI] [PMC free article] [PubMed] [Google Scholar]
- 44.Jump D. B. 2011. Fatty acid regulation of hepatic lipid metabolism. Curr. Opin. Clin. Nutr. Metab. Care. 14: 115–120 [DOI] [PMC free article] [PubMed] [Google Scholar]
- 45.Botolin D., Wang Y., Christian B., Jump D. B. 2006. Docosahexaneoic acid (22:6,n-3) regulates rat hepatocyte SREBP-1 nuclear abundance by Erk- and 26S proteasome-dependent pathways. J. Lipid Res. 47: 181–192 [DOI] [PMC free article] [PubMed] [Google Scholar]
- 46.Miyazaki M., Flowers M. T., Sampath H., Chu K., Otzelberger C., Liu X., Ntambi J. M. 2007. Hepatic stearoyl-CoA desaturase-1 deficiency protects mice from carbohydrate-induced adiposity and hepatic steatosis. Cell Metab. 6: 484–496 [DOI] [PubMed] [Google Scholar]
- 47.Matsuzaka T., Shimano H., Yahagi N., Kato T., Atsumi A., Yamamoto T., Inoue N., Ishikawa M., Okada S., Ishigaki N., et al. 2007. Crucial role of a long-chain fatty acid elongase, Elovl6, in obesity-induced insulin resistance. Nat. Med. 13: 1193–1202 [DOI] [PubMed] [Google Scholar]
- 48.Cao H., Gerhold K., Mayers J. R., Wiest M. M., Watkins S. M., Hotamisligil G. S. 2008. Identification of a lipokine, a lipid hormone linking adipose tissue to systemic metabolism. Cell. 134: 933–944 [DOI] [PMC free article] [PubMed] [Google Scholar]
- 49.Gong J., Campos H., McGarvey S., Wu Z., Goldberg R., Baylin A. 2011. Adipose tissue palmitoleic acid and obesity in humans: does it behave as a lipokine? Am. J. Clin. Nutr. 93: 186–191 [DOI] [PMC free article] [PubMed] [Google Scholar]
- 50.Guo X., Li H., Xu H., Halim V., Zhang W., Wang H., Ong K. T., Woo S. L., Walzem R. L., Mashek D. G., et al. 2012. Palmitoleate induces hepatic steatosis but suppresses liver inflammatory response in mice. PLoS ONE. 7: e39286. [DOI] [PMC free article] [PubMed] [Google Scholar]
- 51.Djoussé L., Matthan N. R., Lichtenstein A. H., Gaziano J. M. 2012. Red blood cell membrane concentration of cis-palmitoleic and cis-vaccenic acids and risk of coronary heart disease. Am. J. Cardiol. 110: 539–544 [DOI] [PMC free article] [PubMed] [Google Scholar]
- 52.Yang Z. H., Miyahara H., Hatanaka A. 2011. Chronic administration of palmitoleic acid reduces insulin resistance and hepatic lipid accumulation in KK-Ay mice with genetic type 2 diabetes. Lipids Health Dis. 10: 120. [DOI] [PMC free article] [PubMed] [Google Scholar]
- 53.Jump D. B. 2008. N-3 polyunsaturated fatty acid regulation of hepatic gene transcription. Curr. Opin. Lipidol. 19: 242–247 [DOI] [PMC free article] [PubMed] [Google Scholar]
- 54.Wu J. H., Lemaitre R. N., Imamura F., King I. B., Song X., Spiegelman D., Siscovick D. S., Mozaffarian D. 2011. Fatty acids in the de novo lipogenesis pathway and risk of coronary heart disease: the Cardiovascular Health Study. Am. J. Clin. Nutr. 94: 431–438 [DOI] [PMC free article] [PubMed] [Google Scholar]
Associated Data
This section collects any data citations, data availability statements, or supplementary materials included in this article.