Abstract
Lipofuscin results from digestion of photoreceptor outer segments by the retinal pigment epithelium (RPE) and is the principal compound that causes RPE fluorescence during autofluorescence imaging. Absorption of the 488-nanometer blue light by macular pigments, especially by the carotenoids lutein and zeaxanthin, causes normal macular hypo-autofluorescence. Fundus autofluorescence imaging is being increasingly employed in ophthalmic practice to diagnose and monitor patients with a variety of retinal disorders. In macular edema for example, areas of hyper-autofluorescence are usually present which are postulated to be due to dispersion of macular pigments by pockets of intraretinal fluid. For this reason, the masking effect of macular pigments is reduced and the natural autofluorescence of lipofuscin can be observed without interference. In cystic types of macular edema, e.g. cystoid macular edema due to retinal vein occlusion, diabetic macular edema and post cataract surgery, hyper-autofluorescent regions corresponding to cystic spaces of fluid accumulation can be identified. In addition, the amount of hyper-autofluorescence seems to correspond to the severity of edema. Hence, autofluorescence imaging, as a noninvasive technique, can provide valuable information on cystoid macular edema in terms of diagnosis, follow-up and efficacy of treatment.
Keywords: Autofluorescence, Cystoid Macular Edema, Lipofuscin
INTRODUCTION
Fluorescence signifies light emission of a specific wavelength when illumination occurs with a different wavelength. In addition to fluorescein dyes, some natural substances fluoresce spontaneously (autofluoresce). Fundus autofluorescence (AF) is thought to be mostly due to the presence of lipofuscin in the retinal pigment epithelium (RPE).1
Lipofuscin has a yellow-brown appearance with excitation wavelength of 320-460 nanometers (nm) and emission wavelength of 460-630 nm. N-retinylidene-N-retinylethanolamine (A2E) is one of the most extensively studied lipofuscin components responsible for fundus AF. A2E formation initiates in the photoreceptor outer segment as a result of retinoid turnover in the visual cycle.2
RPE digests the tips of photoreceptor outer segments which are being phagocytosed on a daily basis. Among them, a tiny fraction is chemically incompatible for degradation and accumulates in lysosomes of RPE cells, labelled as lipofuscin. However, lipofuscin can also be derived from degradation of intracellular organelles such as mitochondria.2
The distribution of lipofuscin demonstrates a retinal topography similar to that of rod photoreceptors. In the normal fundus, diffuse AF is most intense 5 to 15 degrees from the fovea, where the density of rod outer segments is highest. AF is maximal at about 12 degrees temporally and superiorly.2 The cytoplasmic volume occupied by lipofuscin increases significantly with age; therefore fundus AF has also been shown to increase with age.2 Lipofuscin accumulation also occurs in Best disease, age related macular degeneration and pattern dystrophy. Cellular stress and oxidative damage may also lead to accumulation of this autofluorescent material.2 When the RPE is under stress or diseased, it exhibits hyper-autofluorescence and when it is not viable, hypo-autofluorescence ensues.
Macular pigments mainly include zeaxanthin and lutein which are located in the outer plexiform layer and partly in the inner plexiform layer. The highest density of macular pigments exists in the foveal area which blocks the normal autofluorescence of the RPE in the macula. Absorption of the 488 nm blue light by macular pigments, especially the carotenoids lutein and zeaxanthin, cause hypo-autofluorescence of the central macula.3,4 There is also some absorption of the 488 nm light by melanin granules located in the RPE.5 When the integrity of tight junctions of the retinal capillary endothelium is lost, fluid and macromolecules leak out from vessles.6,7 In cystoid macular edema (CME), fluid accumulates in the extracellular space of the outer plexiform and inner nuclear layers and cyst formation occurs as a result of radial distribution of Henle fibers in the outer plexiform layer.6-10 The optic disc and retinal blood vessels have low (dark) autofluorescent signals due to the lack of RPE in the optic disc region and the masking effect of blood vessels on the RPE beneath them.
The Heidelberg Retinal Angiography system (HRA2; Heidelberg Engineering, Dossenheim, Germany) is a system which can obtain AF images. This confocal scanning laser ophthalmoscope (cSLO) employs an excitation wavelength of 488 nm and a barrier filter of 500 nm to provide fundus AF imaging in vivo. Conventional Topcon fundus camera with a halogen lamp exciter is another available imaging system which uses excitation wavelength of 580 nm and filters wavelengths of 695 nm (580 nm-AF).11,12 Macular pigments block 488 nm-AF more intensely than 580 nm-AF. In Fundus autofluorescence (FAF) imaging, hyper-autofluorescent spaces in regions of cystic macular edema are the result of displacement of macular pigments by cysts and exposure of natural RPE autofluorescence. Due to the important role of macular pigments in providing contrast for hyper-autofluorescence, it is recommended to use cSLO instruments to obtain these images.13
Image processing is required to increase sensitivity to the signal and reduce noise. Compared to a fundus camera, this process is more time consuming when performed by cSLO. In cSLO, averaging a series of single frames can greatly improve the signal-to-noise ratio and therefore visualization of details, but exposure time to the laser beam and eye movements are limiting factors for obtaining more frames. Signal sensitivity is enhanced by capturing more frames, which may lead to a false interpretation especially when it is automatically done by the software. Hence, it is suggested to adjust brightness and contrast of the system manually and to review single images.14
The current article discusses patterns of autofluorescence in CME in various diseases. There are two explanations for hyper-autofluorescence in CME. The first possibility is displacement of macular pigments by the cysts and consequently more exposure of lipofuscin within RPE cells which is similar to a window defect mechanism15; the second is the presence of some fluorophores inside the cysts which requires histochemical analysis for confirmation.13
Imaging technique
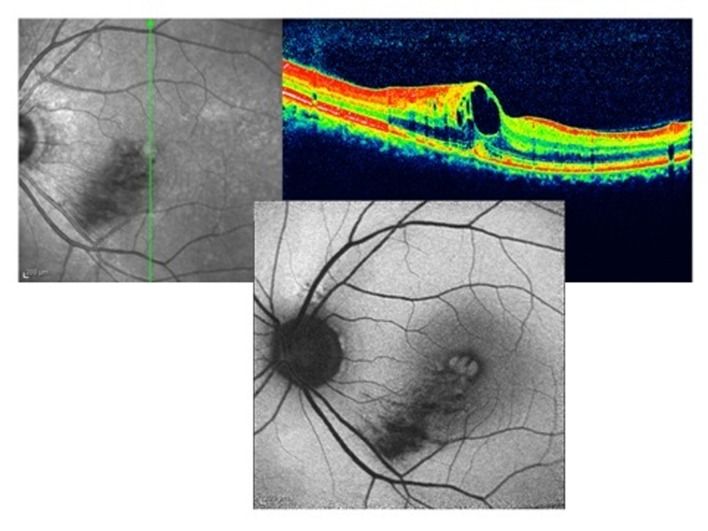
The following are examples of fundus AF images obtained by cSLO. Figure 1 is a case of inferotemporal macular branch retinal vein occlusion (BRVO) with macular edema. There is hypo-autofluorescence in the territory of the occluded vessel due to the masking effect of edema and hemorrhage in the retina, but hyper-autofluorescent spaces in the macula are due to CME. These pockets of fluid can also be observed on optical coherence tomography (OCT) images of the macula, located vertically in the retinal layers pushing other normal elements of the retina, macular pigments for example, to the sides; AF of RPE can be visualized through these cysts without interference by macular pigments and hyper-autofluorescence is therefore evident.
Figure 1.
Cystoid macular edema in inferotemporal branch retinal vein occlusion; optical coherence tomography shows cystic collection of fluid in the macula (right upper image), autofluorescence imaging shows hyper-autofluorescence (lower image). There is hypo-autofluorescence in the territory of the occluded vein due to the masking effect of hemorrhage on the lipofuscin in the retinal pigment epithelium.
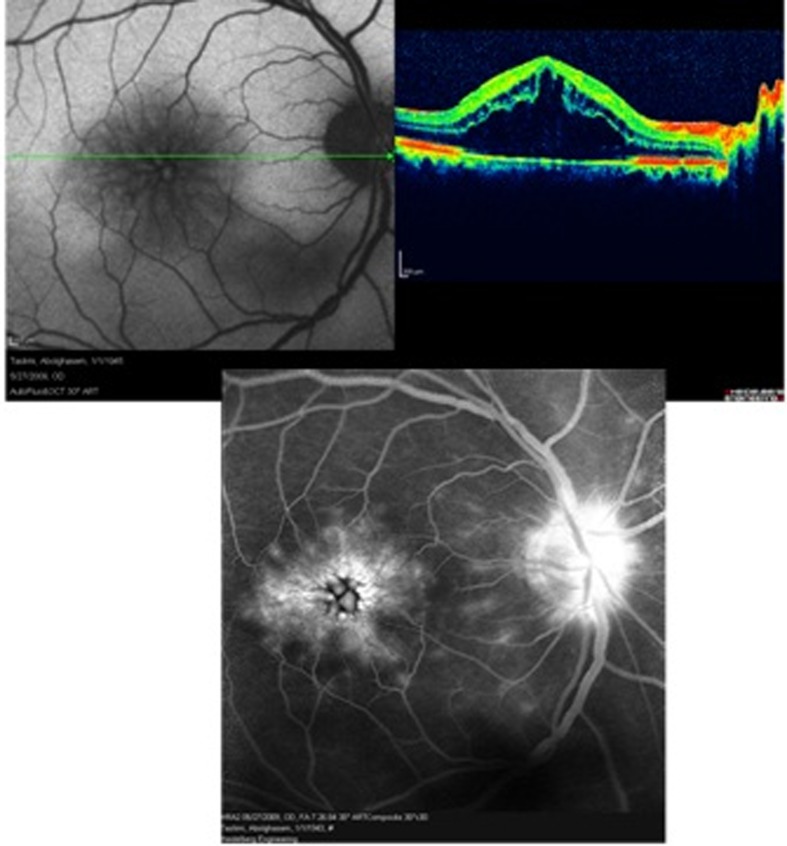
Figure 2 is a case of Irvine-Gass syndrome which describes CME specifically arising after cataract surgery. OCT images reveal severe macular edema while fluorescein angiography shows a petaloid pattern of hyperfluorescence in the macula together with some optic disc leakage. Similarly, hyper-autofluorescent cysts are seen in the macula on AF imaging.
Figure 2.
Irvine-Gass syndrome (post cataract surgery cystoid macular edema); optical coherence tomography shows severe macular edema (right upper image), autofluorescence imaging reveals hyper-autofluorescence only in the foveal center (left upper image), fluorescein angiography shows a petaloid pattern of leakage in the macula with late staining of the optic disc (lower image). The petaloid pattern of fluorescein leakage into the cystic spaces of fluid collection in the macula resembles the pattern of hyper-autofluorescent spots.
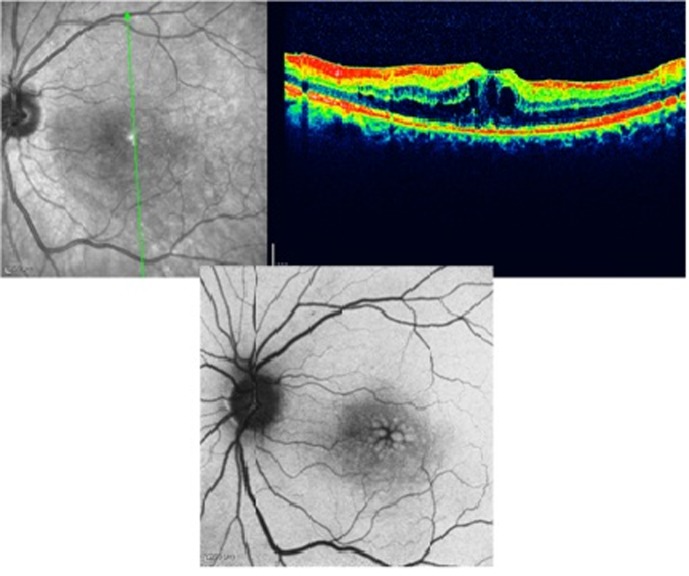
Figure 3 demonstrates a case of diabetic macular edema which is apparent on the OCT image. Hyper-autofluorescent cysts are easily visible in the central macula on AF imaging. Cystoid edema of diabetes is more readily evident by FAF as compared to spongiform edema.
Figure 3.
Diabetic macular edema; optical coherence tomography shows cystic spaces of fluid collection (right upper image) and autofluorescence imaging demonstrates hyperautofluorescence spots in the macula (lower image).
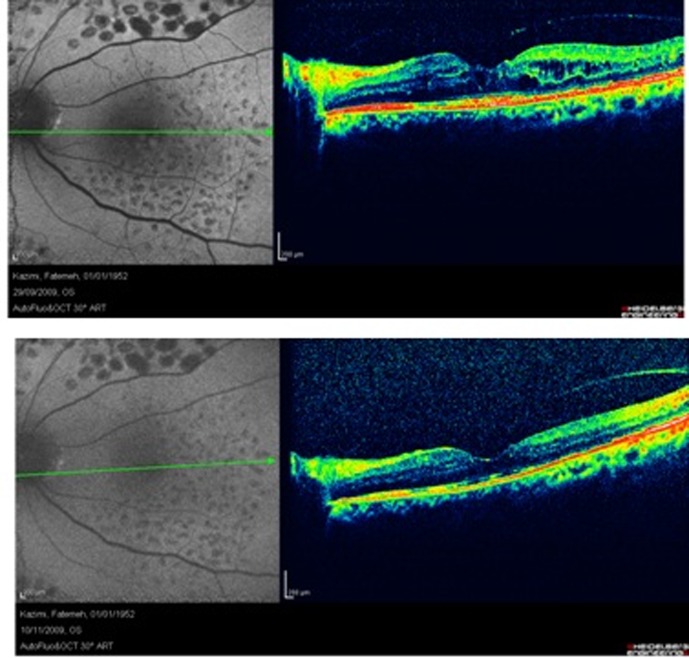
Figure 4 shows another case of diabetic macular edema that has received macular photocoagulation (MPC). In autofluorescence imaging, MPC scars are hypo-autofluorescence due to the destructive effects of laser on deep retinal layers and RPE. Diabetic macular edema that is evident in OCT, appears as hyper-autofluorescent spaces on autofluorescence imaging. After resorption of the fluid, the hyper-autofluorescent cysts disappeared which is demonstrated in the lower image.
Figure 4.
A case of diabetic macular edema that received macular photocoagulation exhibits some hyper-autofluorescence in the macular region (upper image), the lower image shows the same case after complete resolution of the edema, note that hyper-autofluorescence of the macula has disappeared.
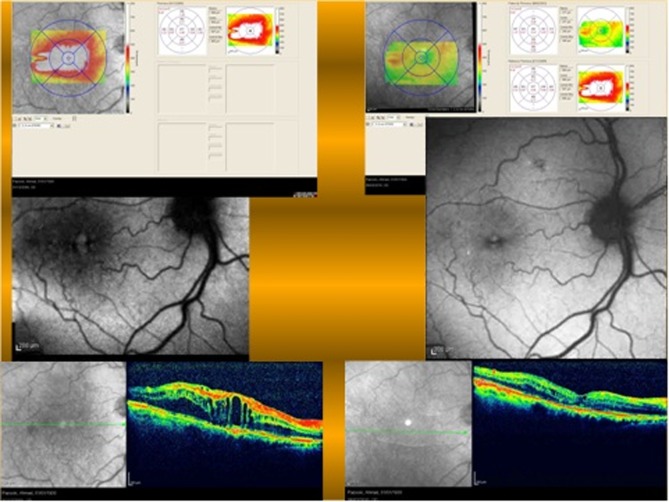
Figure 5 represents two eyes of the same patient with diabetic macular edema who has received MPC. In the right eye which is located on the left side of the picture, macular edema has resolved and there is no hyper-autofluorescence in the fovea while macular edema persists in the left eye. Hyper-autofluorescent cysts are evident in the central fovea (middle images).
Figure 5.
Two eyes with diabetic macular edema which have received macular photocoagulation; the last row shows optical coherence tomography images of the two eyes and the middle row shows autofluorescence imaging. In the right eye (left image), macular edema has resolved and there is no hyper-autofluorescence in the macular region. In the left eye (right image) there is persistent macular edema and visible hyper-autofluorescence in the macula.
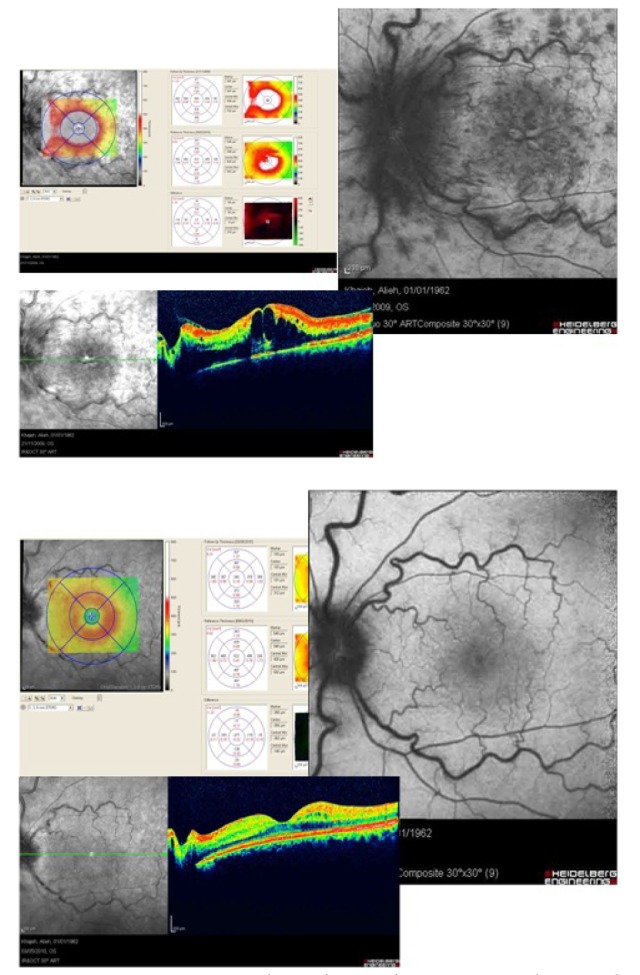
Figure 6 shows a case of macular edema before and after treatment. While hyper-autofluorescent cysts are much larger before treatment, the amount of hyper-autofluorescence varies with the severity of macular edema. Thus this imaging modality is also useful for evaluating outcomes of treatment. The extent and severity of hyper-autofluorescence can be quantitated by image processing and is the subject of one of the authors’ research in progress.
Figure 6.
The amount of macular edema is more evident on images in the left column (baseline macular edema) as compared to right side images (after treatment). Left side fundus autofluorescence shows more hyperautofluorescence in the foveal center. Although there is retinal edema on the temporal side of the fovea, hyper-autofluorescent is not seen in the parafoveal area.
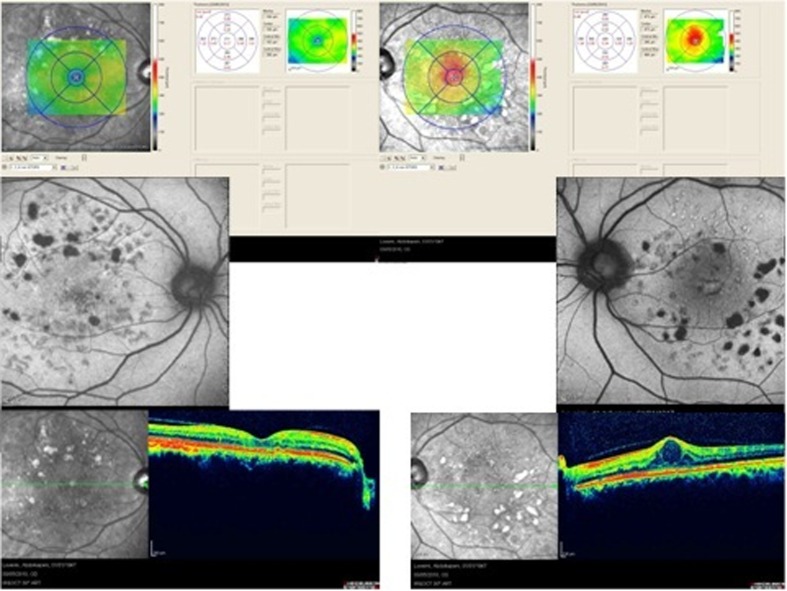
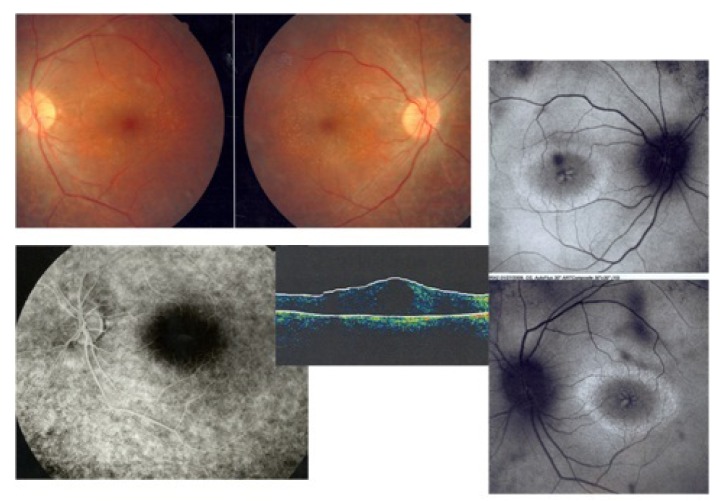
Figure 7 shows both eyes of a patient with retinitis pigmentosa (RP) and CME. There is usually no leakage on fluorescein angiography in such patients. Autofluorescence imaging clearly shows hyper-autofluorescent cysts in regions of foveal edema. In RP patients, fundus autofluorescence can also provide valuable information about disease progression by monitoring the hyper-autofluorescent ring in the macular area. With disease progression, this ring will decrease in size.16
Figure 7.
Retinitis pigmentosa and cystoid macular edema; fundus photograph images of both eyes show typical arteriolar narrowing and bony spicules (upper left images), fluorescein angiography shows no leakage in the macular area (lower image), autofluorescence images of both eyes reveals hyperfluorescent cysts corresponding to cystic edema (right side images), besides a hyperautofluorescent ring in the macula shows the border between involved and uninvolved photoreceptors. The ring becomes smaller with disease progression.
Figure 8 is a case of central retinal vein occlusion (CRVO) with macular edema. In autofluorescence imaging, hyper-autofluorescent cysts can be observed in the central fovea. Hyper-autofluorescent cysts disappeared after treatment demonstrating the utility of autofluorescence imaging during follow up and for evaluating the results of treatment.
Figure 8.
Cystic macular edema due to central retinal vein occlusion (upper image) - autofluorescence imaging shows hyper-autofluorescence; resolving macular edema in central retinal vein occlusion (lower image) - autofluorescence imaging shows disappearance of hyper-autofluorescence which had been evident in the upper figure.
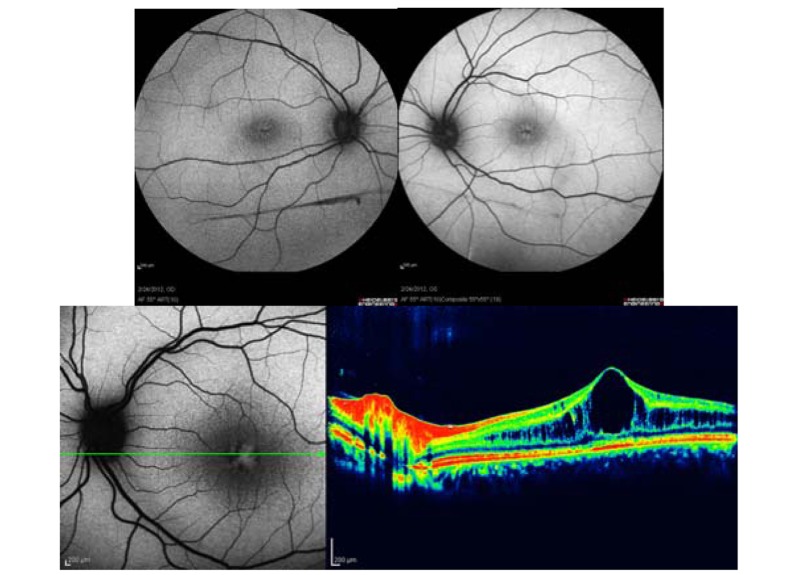
Figure 9 depicts a case of juvenile x-linked retinoschisis. Schisis retinal cavities which are due to defects in intercellular adhesions can be observed as hyper-autofluorescent spaces.
Figure 9.
Foveal schisis in the right and left eye of a young man with x-linked juvenile retinoschisis shows bilateral hyper-autofluorescence due to cystoid lesions in the macular region.
Discussion
The gold standard for the diagnosis of CME is fluorescein angiography (FA) which demonstrates leakage from perifoveal capillaries in early phases and dye pooling in late phases resulting in a “petaloid pattern”.6,8,10
Mcbain and colleagues reported 81% sensitivity and 69% specificity for FAF in diagnosing CME as compared to FA.17 Although FA is the gold standard for diagnosis, it is an invasive procedure and more time-consuming as compared to FAF which may be helpful in patients with allergy to fluorescein or history of adverse effects due to fluorescein injection.18
Bessho et al evaluated FAF imaging in patients with CME by two instruments; cSLO (480 nm) and conventional fundus camera (580 nm).13 They found macular hyper-autofluorescence in 100% of patients using the 480 nm-AF imaging but only in 7% utilizing 580 nm-AF. Macular pigments block 488 nm-AF more intensely than 580 nm-AF, hence the authors concluded that hyper-autofluorescence in CME is due to macular stretching and may result in lateral displacement of macular pigments. In addition, the condition is a “pseudo-autofluorescence” which may not indicate actual alteration in RPE function. On the other hand, peripheral retinal edema did not show hyper-autofluorescence even with 480 nm-AF, because of the lack of macular pigments in that area. For the same reason, other types of macular edema such as subretinal fluid or spongiform edema may not demonstrate increased autofluorescence.13
The crystalline lens due to its highly fluorescent characteristics which excites in 400-600 nm, is the main barrier in obtaining images with high contrast and low background noise. With increasing age and development of nuclear opacities in the lens, lens fluorescence becomes even more prominent.14
Qualitative assessment of the severity of CME by clinical examination, FA and FAF are not accurate, but may be evaluated more precisely by OCT. The value of fundus AF in the diagnosis and evaluation of macular edema should be considered as a new imaging technique which is finding its way in patients’ care and can serve as an acceptable alternative when OCT is not available. For more accurate assessment of CME by FAF, it is recommended to employ 488-nm excitation (cSLO) which is a useful tool for monitoring the course of macular edema after intervention. It is possible to translate these qualitative data to quantitative measurements and obtain more realistic speculations about macular thickness.19
There are some limitations in employing fundus autofluorescence for monitoring macular edema. For instance, in non-cystoid patterns of macular edema, FAF may not be as useful as in the cystoid type which is due to less dispersion of xantophyll pigments in the fovea. The other limitation could be the effect of different pathologies of the RPE and retinal layers which may coexist with macular edema and interfere with the autofluorescent pattern of macular edema.
In conclusion, fundus AF derived from lipofuscin has developed into an important noninvasive imaging technique in the past decade. We can acquire valuable information about the health of the retina and RPE by this imaging modality. Additionally, the technique is noninvasive and there is no need for dye injection. It represents cystoid macular edema as hyper-autofluorescent cysts and the intensity of this hyper-autofluorescence can provide helpful clues to the physician about the severity of macular edema. It can be used as a valuable tool for follow up of patients with cystoid macular edema and monitoring the effect of treatment.
Footnotes
Conflicts of Interest
None.
REFERENCES
- 1.Delori FC, Dorey CK, Staurenghi G, Arend O, Goger DG, Weiter JJ. In vivo fluorescence of the ocular fundus exhibits retinal pigment epithelium lipofuscin characteristics. Invest Ophthalmol Vis Sci. 1995;36:718–729. [PubMed] [Google Scholar]
- 2.Lois N, Forrester JV. Fundus Autofluorescence. Philadelphia: Lippincott Williams & Wilkins; 2009. [Google Scholar]
- 3.Bone RA, Landrum JT, Cains A. Optical density spectra of the macular pigment in vivo and in vitro. Vis Res. 1992;32:105–110. doi: 10.1016/0042-6989(92)90118-3. [DOI] [PubMed] [Google Scholar]
- 4.Handelman GJ, Snodderly DM, Adler AJ, Russett MD, Dratz EA. Measurement of carotenoids in human and monkey retinas. Methods Enzymol. 1992;213:220–230. doi: 10.1016/0076-6879(92)13123-f. [DOI] [PubMed] [Google Scholar]
- 5.Keilhauer CN, Delori FC. Near-infrared autofluorescence imaging of the fundus: visualization of ocular melanin. Invest Ophthalmol Vis Sci. 2006;47:3556–3564. doi: 10.1167/iovs.06-0122. [DOI] [PubMed] [Google Scholar]
- 6.Yan M. Cystoid macular edema. Chin J Ocul Fundus Dis (Chin) 2002;18:234–235. [Google Scholar]
- 7.Gass JDM. Current concepts concerning cystoid macular edema. In: Franklin RM, editor. Retina and Vitreous: Proceedings of the Symposium on Retina and Vitreous. Amsterdam: Kugler Publications; 1993. pp. 295–297. [Google Scholar]
- 8.Johnson TM, Johnson MW. Cystoid macular edema. In: Quillen DA, Blodi BA, editors. Clinical Retina. Chicago: AMA Press; 2002. [Google Scholar]
- 9.Otani T, Kishi s, Maruyama Y. Patterns of diabetic macular edema with optical coherence tomography. Am J Ophthalmol. 1999;127:688–693. doi: 10.1016/s0002-9394(99)00033-1. [DOI] [PubMed] [Google Scholar]
- 10.Zheng Y. Clinical features and treatment of uveitis combined with cystoid macular edema. Chin J Ocul Fundus Dis (Chin) 2006;22:394–396. [Google Scholar]
- 11.von Ruckmann A, Fitzke FW, Bird AC. In vivo fundus autofluorescence in macular dystrophies. Arch Ophthalmol. 1997;115:609–615. doi: 10.1001/archopht.1997.01100150611006. [DOI] [PubMed] [Google Scholar]
- 12.Holz FG, Bellmann C, Margaritidis M, Schütt F, Otto TP, Völcker HE. Patterns of increased in vivo fundus autofluorescence in the junctional zone of geographic atrophy of the retinal pigment epithelium associated with age-related macular degeneration. Graefes Arch Clin Exp Ophthalmol. 1999;237:145–152. doi: 10.1007/s004170050209. [DOI] [PubMed] [Google Scholar]
- 13.Bessho K, Gomi F, Harino S, Sawa M, Sayanagi K, Tsujikawa M, et al. Macular autofluorescence in eyes with cystoid macula edema, detected with 488 nm-excitation but not with 580 nm-excitation. Graefes Arch Clin Exp Ophthalmol. 2009;247:729–734. doi: 10.1007/s00417-008-1033-y. [DOI] [PubMed] [Google Scholar]
- 14.Schmitz-Valckenberg S. How to obtain the optimal fundus autofluorescence image with the confocal scanning laser ophthalmoscope. In: Holz FG, Spaide R, Bird AC, editors. Atlas of Fundus Autofluorescence Imaging. Springer-Verlag: New York; 2007. [Google Scholar]
- 15.Besshol K, Gomi F, Harino S, Sawa M, Sayanagi K, Tsujikawa M, et al. Macular autofluorescence in eyes with cystoid macular edema, detected with 488 nm-excitation but not with 580 nm-excitation. Graefes Arch Clin Exp Ophthalmol. 2009;247:729–734. doi: 10.1007/s00417-008-1033-y. [DOI] [PubMed] [Google Scholar]
- 16.Fishman GA, Gilbert LD, Fiscella RG, Kimura AE, Jampol LM. Acetazolamide for treatment of chronic macular edema in retinitis pigmentosa. Arch Ophthalmol. 1989;107:1445–1452. doi: 10.1001/archopht.1989.01070020519031. [DOI] [PubMed] [Google Scholar]
- 17.McBain VA, Forrester JV, Lois N. Fundus autofluorescence in the diagnosis of cystoid macular oedema. Br J Ophthalmol. 2008;92:946–949. doi: 10.1136/bjo.2007.129957. [DOI] [PubMed] [Google Scholar]
- 18.Pece A, Isola V, Holz F, Milani P, Brancato R. Autofluorescence imaging of cystoid macular edema in diabetic retinopathy. Ophthalmologica. 2010;224:230–235. doi: 10.1159/000260229. [DOI] [PubMed] [Google Scholar]
- 19.Hwang JC, Chan JW, Chang S, Smith RT. Predictive value of fundus autofluorescence for development of geographic atrophy in age-related macular degeneration. Invest Ophthalmol Vis Sci. 2006;47:2655–2661. doi: 10.1167/iovs.05-1027. [DOI] [PMC free article] [PubMed] [Google Scholar]


