Abstract.
Determining both bilirubin’s concentration and its spatial distribution are important in disease diagnosis. Here, for the first time, we applied quantitative multiwavelength photoacoustic microscopy (PAM) to detect bilirubin concentration and distribution simultaneously. By measuring tissue-mimicking phantoms with different bilirubin concentrations, we showed that the root-mean-square error of prediction has reached 0.52 and for pure bilirubin and for blood-mixed bilirubin detection (with 100% oxygen saturation), respectively. We further demonstrated the capability of the PAM system to image bilirubin distribution both with and without blood. Finally, by underlaying bilirubin phantoms with mouse skins, we showed that bilirubin can be imaged with consistent accuracy down to in depth. Our results show that PAM has potential for noninvasive bilirubin monitoring in vivo, as well as for further clinical applications.
Keywords: photoacoustic microscopy, photoacoustic spectroscopy, bilirubin, scattering medium
1. Introduction
Bilirubin is a yellow-orange breakdown product of red blood cells. Elevated bilirubin levels ( to ) in blood streams and tissues are always associated with physiological disorders, such as jaundice and hyperbilirubinemia.1,2 A high bilirubin concentration may cause kernicterus, a kind of irreversible brain damage in newborn babies.2,3 Thus, measuring the bilirubin level plays an important role in the diagnosis of jaundice and other diseases. Besides quantifying the average bilirubin level, determination of its spatial distribution provides additional information for such diagnoses. It has been suggested that measuring both the serum and the transcutaneous bilirubin levels concurrently will enable a more accurate identification of jaundice.4,5 In addition, measuring the bilirubin distribution may provide opportunities to study kernicterus (by analyzing the movement of bilirubin across the blood-brain barrier and its deposition into the brain tissue),5,6 to estimate the age of bruises in forensic medicine,7 and to reveal the bilirubin photochemistry interaction during phototherapy.8,9
Current techniques for bilirubin measurement have various limitations. The conventional approach to measuring bilirubin concentration involves extracting blood, which is invasive, and only the total serum bilirubin level can be monitored, without any spatial information. Noninvasive monitoring methods include diffuse reflectance spectroscopy10–13 and hyperspectral imaging.7,14 The former senses the overall concentration of bilirubin in the skin without spatial resolution, whereas the latter maps the relative bilirubin distribution without quantification. Therefore, we still lack a technique for quantitative imaging of bilirubin.
Since it was first introduced in 2005, photoacoustic microscopy (PAM) has been proven to be a promising modality for both structural and functional imaging.15–20 In PAM, the object is irradiated by a short-pulsed laser. Following the absorption of light, a temperature rise generates an initial pressure rise, which is propagated as a photoacoustic wave. This photoacoustic wave is then detected by a focused ultrasonic transducer.21 Because the initial pressure is proportional to the local energy absorbed, photoacoustic measurements with multiple optical wavelengths can provide spectral information of optical absorption. Based on the different absorption spectra of oxyhemoglobin and deoxyhemoglobin, the oxygen saturation of hemoglobin () has been successfully quantified by PAM with high accuracy and spatial resolution.22,23 In addition, PAM has shown its feasibility to detect other intrinsic contrasts in biological tissue, such as DNA and RNA in nuclei,24 water,25 lipid,26 cytochrome ,27 and melanin.28,29
The motivation of this work is to image bilirubin distribution quantitatively by using PAM. We first demonstrated that our PAM system was capable of measuring the absorption spectra of bilirubin and blood (including oxyhemoglobin and deoxyhemoglobin). Based on the absorption spectra, proper wavelengths were chosen to measure pure bilirubin samples and mixed bilirubin-blood samples. Then the root-mean-square error of prediction (RMSEP) in both the pure and mixed samples was measured. Last, the bilirubin distributions in tissue-mimicking samples were imaged both without and with underlaid mouse skins. We showed for the first time that bilirubin, both inside and outside the blood vessels, can be imaged quantitatively by PAM with relatively high accuracy.
2. Materials and Methods
2.1. Experimental System
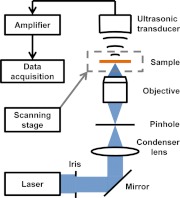
A free-space transmission-mode PAM system was utilized for bilirubin detection, as shown in Fig. 1.27 The laser pulse (5 ns pulse width, 1 KHz pulse repetition rate), with a wavelength tunable from 210 to 2600 nm, was generated by an integrated diode-pumped Q-switched laser and optical parametric oscillator system (NT242-SH, Ekspla). The pulse was then filtered by a 2 mm iris (ID25SS, Thorlabs) to remove the nonuniform rim. After being reflected by a mirror (PF10-03-G01, Thorlabs), focused by a condenser lens (LA4380, Thorlabs), and filtered by a 50 μm pinhole (P50C, Thorlabs), the light beam was focused by an optical objective with 0.3 numerical aperture (NA). The excited photoacoustic waves were detected by a focused ultrasonic transducer (40 MHz central frequency, 80% bandwidth, and 0.5 NA). The ultrasonic transducer and optical objective were aligned coaxially and confocally to achieve high sensitivity. Each laser pulse yielded a one-dimensional depth-resolved image (A-line) by recording the arrival times of photoacoustic signals. A two-dimensional (2-D) scanning stage (PLS-85, MICOS) held the sample and provided lateral scanning. We rendered our result in the form of a 2-D maximum amplitude projection (MAP) image, which was produced by projecting the maximum amplitude of the three-dimensional (3-D) image along the axial direction.
Fig. 1.
Schematic of the PAM system.
2.2. Phantom Preparation
In the experiments, bilirubin powder (B4126, Sigma-Aldrich) was dissolved in dimethyl sulfoxide solution (Fisher Scientific) and further diluted by water. To prepare the pure tissue-mimicking sample, the bilirubin solution was mixed with 5% gelatin (G1890, Sigma-Aldrich) and 1% intralipid (Fresenius Kabi). The congealed sample had a thickness of 0.5 mm and an optical scattering coefficient of approximately . To prepare the mixed sample (to mimic blood vessels), the bilirubin solution was mixed with lysed bovine blood with a 75% (905–250, Quad Five). Oxygenated hemoglobin was prepared by mixing oxygen with lysed bovine blood (905–250, Quad Five) for 2 h. Deoxygenated hemoglobin was prepared by adding 33 mg of sodium hydrosulfite (71699–50, Sigma-Aldrich) to 10 ml of lysed bovine blood (905–250, Quad Five). The 75% blood was prepared by mixing oxyhemoglobin and deoxyhemoglobin at a ratio of and measured by an oximeter for validation. To mimic a blood vessel, the mixture was then contained in a microtube (made of platinum-cured silicone) with an inner diameter of 300 μm and an outer diameter of 600 μm (60985–700, VWR). To mimic the varied physiological levels in real patients, phantoms were prepared with different concentrations of bilirubin.
2.3. Calibration Procedure
The PAM system was calibrated with pure samples with preset bilirubin concentrations of 2, 4, 6, and , and with a preset blood concentration of for quantification. The was set to be . The A-lines from each sample (prepared as described previously) were averaged 10,000 times at each optical wavelength. The peak PA signal amplitude versus the wavelength was used to separately calculate the concentration by weighted least squares fit with the photoacoustic spectra of bilirubin and blood. We repeated this calibration procedure for the samples overlaid with mouse skins of different thicknesses (200, 400, and 600 μm) in order to compensate for the depth-dependent light attenuation and obtain quantitative results at these depths. It is also possible to estimate the light attenuation by Beer’s law when depth-dependent calibration is infeasible (such as in vivo and noninvasive applications).
2.4. Quantification of Bilirubin, Oxyhemoglobin, and Deoxyhemoglobin Concentrations
Both the calibration and concentration measurements can be described by the following equations:
| (1) |
| (2) |
| (3) |
where , , and are the wavelength-dependent photoacoustic signal amplitudes normalized with the laser pulse energy (recorded in ) of bilirubin, oxyhemoglobin, and deoxyhemoglobin, respectively; , , and are the wavelength dependent molar absorption coefficients of bilirubin, oxyhemoglobin, and deoxyhemoglobin, respectively; , , and are the concentrations of bilirubin, oxyhemoglobin, and deoxyhemoglobin, respectively; and , , and are the calibration factors for bilirubin, oxyhemoglobin, and deoxyhemoglobin, respectively. For calibration, , , and were known, while , , and were calculated by weighted least squares fitting. , , and were slightly different due to differences among the samples. For concentration measurement, , , and were from the calibration, while , , and were calculated by weighted least squares fitting. Here the variances of the photoacoustic signals are used in the least squares fits as weighting terms.
For the mixture of bilirubin and blood, we can calculate all bilirubin, oxyhemoglobin, and deoxyhemoglobin concentrations by fitting the bilirubin and blood absorption spectra to the photoacoustic signals:
| (4) |
where is the wavelength-dependent photoacoustic signal amplitude.
To describe the measurement precision, the RMSEP of the concentration can be defined as
| (5) |
where systematic error and random error are defined as
| (6) |
and
| (7) |
respectively. Here, , , and are the preset concentration, mean measured concentration, and measurement standard deviation of the ’th sample, respectively; and is the total number of samples. RMSEP denotes the measurement error by combining in quadrature both the systematic error and random error. The systematic error describes the root-mean-squared difference between the measurement and the actual value, mostly likely originating from instrument calibration errors. The random error describes the measurement fluctuation without averaging, most likely originating from noise.
To quantitatively map the concentration distribution of bilirubin in various samples, the samples were imaged at multiple wavelengths, and each pixel of the co-registered multiwavelength images was analyzed by the above method as described by Eq. (4). To obtain the statistical ‘volume-averaged’ data, we set a threshold of five times the noise level to separate the sample and the background, and then averaged the signals within each sample to get our final mean concentration value.
3. Results
3.1. Photoacoustic Spectra
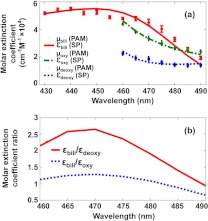
We used PAM to measure the absorption spectra of bilirubin, oxyhemoglobin, and deoxyhemoglobin by using pure bilirubin () and blood () solutions, respectively. The relative optical absorption at each wavelength was calculated from the average PA signal amplitude normalized by the laser pulse energy. Figure 2(a) shows the absorption spectra of bilirubin, oxyhemoglobin, and deoxyhemoglobin measured by the PAM system, all fitting well to the absorption spectra measured with a spectrophotometer (Cary 50 Bio UV/Visible, VARIAN). The residual systematic difference between the bilirubin spectra may have resulted from instrument errors. Because bilirubin has a relatively high absorption in the wavelength range from 430 to 490 nm, we chose this range for the bilirubin measurement. Likewise, because the absorption ratio between bilirubin and blood is relatively high in the wavelength range from 460 to 490 nm [Fig. 2(b)],30–32 which enables an easier differentiation of bilirubin from blood, we chose this range for the blood absorption spectrum detection. Also, the wavelength range from 540 to 545 nm was chosen, where blood has high absorption [Fig. 2(a)], but bilirubin has almost no absorption.31 We used these component spectra measured by PAM as the standard to decompose spectra of mixtures for the concentrations of bilirubin, oxyhemoglobin, and deoxyhemoglobin.
Fig. 2.
Absorption spectra of bilirubin, oxyhemoglobin, and deoxyhemoglobin. (a) Relative absorption spectra of bilirubin, oxyhemoglobin, and deoxyhemoglobin measured by PAM scaled by fitting to the spectrophotometer measurement. (b) The molar extinction coefficient ratio between bilirubin, oxyhemoglobin, and deoxyhemoglobin in the wavelength range from 460 to 490 nm. : relative absorption coefficient of bilirubin. : molar extinction coefficient of bilirubin. : relative absorption coefficient of oxyhemoglobin. : molar extinction coefficient of oxyhemoglobin. : relative absorption coefficient of deoxyhemoglobin. : molar extinction coefficient of deoxyhemoglobin. SP: spectrophotometer.
3.2. Concentration Accuracy
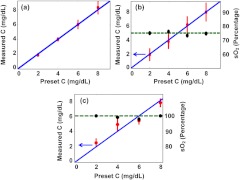
We quantified the accuracy of bilirubin concentration measurements by PAM in both pure and mixed samples. The tissue-mimicking samples for the pure bilirubin measurements were the same as those used in the calibration (bilirubin concentrations of 2, 4, 6, and ; thickness of 200 μm). The optical wavelength was varied from 430 to 460 nm. The bilirubin concentration could be calculated simply from the PA signal amplitudes after calibration, as shown in Fig. 3(a). The RMSEP of the concentration was calculated by Eq. (5) to be for the pure bilirubin samples, where the systematic error is and the random error is .
Fig. 3.
The measured bilirubin concentration (C) of each sample versus the preset concentration. (a) Pure bilirubin phantom. Bilirubin solution mixed with (b) 75% blood and (c) 100% blood. Red circle: experimental measurement of C. Blue solid line: ideal fit if the measured and preset concentrations are identical. Black circle: experimental measurement of . Green dashed line: preset . For the bilirubin blood mixture sample with 75% and 100% , the RMSEP of the concentration for bilirubin is calculated to be and , respectively.
For the mixed-sample measurement, we used four samples with bilirubin-to-blood concentration ratios of 2, 4, 6, and of bilirubin to of blood. Two wavelength ranges were chosen for this experiment. One was from 460 to 490 nm, where the molar extinction coefficient ratio between bilirubin and blood is relatively high, as shown in Fig. 2(b). The other was from 540 to 545 nm, where blood has high absorption, but bilirubin has almost no absorption. The measurements for the mixed samples with 75% and 100% are shown in Fig. 3(b) and 3(c), respectively. According to Eq. (5), the RMSEP value of the bilirubin for the 75% mixed samples was calculated to be , where the systematic error is and the random error is . For the 100% mixed samples, the RMSEP value was , where the systematic error was and the random error was . Also, as shown in Fig. 3(b) and 3(c), the value can be recovered in the mixture.
3.3. Quantitative Bilirubin Mapping with and without Blood
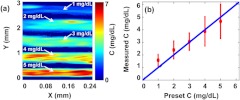
Next, we implemented quantitative PAM of pure bilirubin samples. Five congealed samples with different volume-averaged bilirubin concentrations (1, 2, 3, 4, and ) were prepared as described above, which covered the normal and elevated bilirubin levels in humans. Each sample was cylindrical with a diameter of about 0.5 mm (determined by the inner diameter of the metal tube used as the sample mold), and the space between the samples was filled with ultrasonic gel. With a step size of 2 μm, a 3 mm by 0.3 mm area was scanned at 430 nm wavelength, where bilirubin has a strong absorption, to acquire PAM images of bilirubin distributions. The volume-averaged concentrations of bilirubin in the samples were set to be 1 to , from the top to the bottom of Fig. 4(a). The measured average concentration of bilirubin in each sample was in accordance with the preset concentration, as shown in Fig. 4(b). The results show that the PAM system not only can measure the bilirubin concentration but also can provide its spatial information in the pure bilirubin sample.
Fig. 4.
Quantitative PAM of tissue-mimicking samples containing bilirubin with varied concentrations. (a) Bilirubin distribution image. From top to bottom in the image, the sample concentrations are 1, 2, 3, 4, and , respectively. (b) Volume-averaged bilirubin concentrations from the PAM measurements in each sample. Red circle: experimental measurement. Blue line: ideal fit if the measured and preset concentrations are identical.
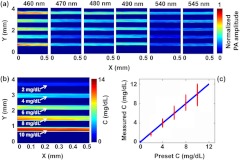
We also detected the bilirubin spatial distribution in the mixed samples with 75% . Wavelengths of 460, 470, 480, 490, 540, and 545 nm were selected. Solutions with bilirubin-to-blood ratios of 2, 4, 6, 8, and to were prepared, corresponding to both normal and elevated ratios in physiology. Five tubes with the same diameters as in the previous experiment held the mixture samples. Here, a 4 mm by 0.5 mm area was scanned with a step size of 2 μm. The PAM images of the mixed solutions acquired at each wavelength are shown in Fig. 5(a). Since blood has much higher absorption than bilirubin, it is difficult to distinguish the bilirubin concentrations based merely on a single image. However, based on the multiwavelength images, the image of the bilirubin concentration distribution can be calculated and is shown in Fig. 5(b). The average bilirubin-to-blood ratios in the sample, from top to bottom, ranged from 2 to of bilirubin to of blood. The measured average concentrations of bilirubin are in fair accordance with the preset concentrations, as shown in Fig. 5(c).
Fig. 5.
Multiwavelength PAM of the mixtures of bilirubin and blood (75% ). (a) Quantitative PAM images at six optical wavelengths. (b) Bilirubin distribution image calculated from the multiwavelength PAM images. From top to bottom in the image, the bilirubin concentrations are 2, 4, 6, 8, and , respectively, whereas the blood concentration is . (c) Volume-averaged bilirubin concentration from the PAM measurements in each tube. Red circle: experimental measurement. Blue line: ideal fit if the measured and preset concentrations are identical.
Similarly, we detected the bilirubin spatial distribution in the mixed samples with 100% . The image of the bilirubin concentration distribution is shown in Fig. 6(a). The measured average concentrations of bilirubin are shown in Fig. 6(b). The results in Figs. 5 and 6 illustrate that PAM can quantitatively image bilirubin distributions in the presence of blood.
Fig. 6.
Multiwavelength PAM of the mixtures of bilirubin and blood (100% ). (a) Bilirubin distribution image calculated from the multiwavelength PAM images. From top to bottom in the image, the bilirubin concentrations are 2, 4, 6, 8, and , respectively, whereas the blood concentration is . (b) Volume-averaged bilirubin concentration from the PAM measurements in each tube. Red circle: experimental measurement. Blue line: ideal fit if the measured and preset concentrations are identical.
3.4. Bilirubin Imaging in Deep Tissue
Finally, to further demonstrate the ability of PAM to measure bilirubin distribution in biological tissue, pure and mixed samples underlaid by mouse skins (light illuminated from the bottom) were imaged simultaneously. Fresh mouse skins, with thicknesses of 200, 400, and 600 μm, were used to underlay the samples. Pure bilirubin samples with concentrations of 2 and and mixed samples with bilirubin-to-blood ratios of 4 and to (75% ) were prepared. In each experiment, a 4 mm by 0.5 mm area was scanned, with a step size of 2 μm (Fig. 7). In every image of Fig. 7, the upper two samples are bilirubin solutions mixed with blood (with concentration ratios of 8 and to ), and the lower two samples are pure bilirubin phantoms (with concentrations of 4 and ). For pure and blood-mixed bilirubin, the detection procedure was the same as discussed before. The skin thicknesses in Fig. 7(a)–7(c) were 200, 400, and 600 μm, respectively. From Fig. 7, we can see that the measured bilirubin concentrations were consistent with the preset values when the skin thicknesses were 200 and 400 μm. However, when the thickness of skin increased to 600 μm, the measurements were less accurate. Table 1 shows bilirubin measurements between phantoms without and with underlaid mouse skins. With skin underlaid (200 and 400 μm), the measurement accuracy is similar to that without skin underlaid. However, when the skin thickness increases to 600 μm, the results are less accurate because of the low signal-to-noise ratio (SNR). Thus, at least a 400 μm penetration depth can be achieved by our method in measuring bilirubin concentration both inside blood vessels (i.e., the mixed samples) and outside blood vessels (i.e., the pure samples).
Fig. 7.
PAM of tissue phantoms with varied bilirubin concentrations. The three images are acquired with underlaid mouse skins with thickness of (a) 200 μm, (b) 400 μm, and (c) 600 μm, respectively. For every image, the upper two tubes are bilirubin solutions mixed with blood. The concentration ratios between bilirubin and blood are : and : , respectively. The lower two samples are pure bilirubin phantoms with concentrations of 4 and , respectively.
Table 1.
Bilirubin concentrations measured by PAM in various phantoms without and with underlaid mouse skins.
| Bilirubin C measured by PAM | ||||
|---|---|---|---|---|
| Pure bilirubin phantoms | Blood mixed solutions | |||
| No skin | ||||
| 200 μm | ||||
| 400 μm | ||||
| 600 μm | ||||
4. Discussion
In these tissue phantom experiments, the quantitative measurements down to 400 μm in depth rely on accurate calibration. The influences of ultrasound refraction/reflection and depth dependence of fluence may be very difficult to calibrate in future in vivo experiments. However, since bilirubin is located shallow in the skin (tens of micrometers, both in the dermis and epidermis), we should be able to map bilirubin distribution in vivo with reasonable accuracy within tens of micrometers of depth, similar to measuring oxygen saturation () in vivo.19,22–23
There are four main types of absorbers in the visible spectral range in the skin: oxyhemoglobin, deoxyhemoglobin, bilirubin, and melanin.10 In blood vessels, absorption mainly originates from oxyhemoglobin, deoxyhemoglobin, and bilirubin; while outside the blood vessel absorption is mainly due to bilirubin and melanin. As our work was focused on demonstrating the feasibility of PAM measurements of bilirubin concentration and distribution, the influence of melanin in the pure bilirubin was not taken into account. However, in principle, if we choose at least four optical wavelengths, each absorber’s concentration can be quantified.21
As discussed above, to measure the pure bilirubin distribution, only one wavelength is needed. For bilirubin mixed with blood, with sufficient SNR, three wavelengths are enough to differentiate the concentration of bilirubin from that of blood. But more wavelengths (as used in our experiments) provide more data to obtain a more accurate least squares fit because the SNR is improved. However, using more wavelengths to measure the sample would take longer, which could be an important concern for in vivo imaging. Thus, there is a trade-off between accuracy and speed. To reduce the measurement time, voice-coil scanning33 or laser scanning34 can be utilized in the future.
A transmission-mode PAM system was used to detect bilirubin distribution in this work. For clinical applications, it is difficult to measure the skin by transmission-mode PAM because of the large thickness of the tissue. Thus, it is preferred to use reflection-mode PAM, which can be achieved by the use of a parabolic mirror with a central hole for light delivery.35
When a healthy human with a very low bilirubin level in blood is imaged, PAM currently may not be able to provide accurate quantitative results. But PAM can complement other techniques, such as blood analysis, by providing the spatial distribution of bilirubin noninvasively. With further development of our technique, we expect to detect relative levels of albumin conjugated bilirubin, which is of clinical significance.36 Blood analyses can be used to measure the total serum bilirubin level for a quantitative validation.
5. Conclusion
To the best of our knowledge, this is the first study to use PAM for quantitative mapping of bilirubin distribution. The RMSEP of concentration was quantified to be for pure bilirubin samples, for bilirubin-blood mixtures with 75% , and for bilirubin-blood mixtures with 100% , respectively. The bilirubin distribution, both in the pure bilirubin samples and in the blood-mixed samples, was imaged by multiwavelength PAM. Finally, imaging bilirubin with underlaid mouse skins illustrated that at least a 400 μm penetration depth can be achieved by PAM without noticeable degradation in accuracy. Therefore, our method shows promise to quantitatively image bilirubin in vivo for further clinical applications, such as the diagnosis of jaundice.
Acknowledgments
The authors gratefully acknowledge the suggestions made by the reviewers of this manuscript, and by Prof. James Ballard at Washington University in St. Louis. This work was sponsored in part by National Institutes of Health grants R01 EB000712, R01 EB008085, R01 CA134539, U54 CA136398, R01 CA157277, and R01 CA159959. L.W. has a financial interest in Microphotoacoustics, Inc. and Endra, Inc., which, however, did not support this work.
References
- 1.Roche S. P., Kobos R., “Jaundice in the adult patient,” Am. Fam. Physician 69(2), 299–304 (2004). [PubMed] [Google Scholar]
- 2.Subcommittee on Hyperbilirubinemia (American Academy of Pediatrics), “Management of hyperbilirubinemia in the newborn infant 35 or more weeks of gestation,” Pediatrics 114(1), 297–316 (2004). 10.1542/peds.114.1.297 [DOI] [PubMed] [Google Scholar]
- 3.Bhutani V. K., Johnson L., “Kernicterus in the 21st century: frequently asked questions,” J. Perinatol. 29(Suppl. 1), S20–S24 (2009). 10.1038/jp.2008.212 [DOI] [PubMed] [Google Scholar]
- 4.Ahlfors C. E., “Criteria for exchange transfusion in jaundiced newborns,” Pediatrics 93(3), 488–494 (1994). [PubMed] [Google Scholar]
- 5.EI-Beshbishi S. N., et al. , “Hyperbilirubinemia and transcutaneous bilirubinometry,” Clin. Chem. 55(7), 1280–1287 (2009). 10.1373/clinchem.2008.121889 [DOI] [PubMed] [Google Scholar]
- 6.Rubaltelli F. F., et al. , “Transcutaneous bilirubin measurement: a multicenter evaluation of a new device,” Pediatrics 107(6), 1264–1271 (2001). 10.1542/peds.107.6.1264 [DOI] [PubMed] [Google Scholar]
- 7.Randeberg L. L., Larsen E., Svaasand L., “Characterization of vascular structures and skin bruises using hyperspectral imaging, image analysis and diffusion theory,” J. Biophoton. 3(1–2), 53–65 (2010). 10.1002/jbio.200910059 [DOI] [PubMed] [Google Scholar]
- 8.Yamauchi Y., Yamanouchi I., “Transcutaneous bilirubinometry: bilirubin kinetics of the skin and serum during and after phototherapy,” Biol. Neonate. 56(5), 263–269 (1989). 10.1159/000243133 [DOI] [PubMed] [Google Scholar]
- 9.Agati G., et al. , “Quantum yield and skin filtering effects on the formation rate of lumirubin,” J. Photochem. Photobiol. B 18(2–3), 197–203 (1993). 10.1016/1011-1344(93)80063-F [DOI] [PubMed] [Google Scholar]
- 10.Jacques S. L., et al. , “Developing an optical fiber reflectance spectrometer to monitor bilirubinemia in neonates,” Proc. SPIE 2975, 115–124 (1997). 10.1117/12.275465 [DOI] [Google Scholar]
- 11.Alla S. K., et al. , “Point-of-care device for quantification of bilirubin in skin tissue,” IEEE Trans. Biomed. Eng. 58(3), 777–780 (2011). 10.1109/TBME.2010.2093132 [DOI] [PubMed] [Google Scholar]
- 12.Maisels M. J., et al. , “Evaluation of a new transcutaneous bilirubinometer,” Pediatrics 113(6), 1628–1635 (2004). 10.1542/peds.113.6.1628 [DOI] [PubMed] [Google Scholar]
- 13.Bertini G., et al. , “Transcutaneous bilirubin measurement: evaluation of Bilitest,” Neonatology 93(2), 101–105 (2008). 10.1159/000107351 [DOI] [PubMed] [Google Scholar]
- 14.Payne G., et al. , “Applying visible hyperspectral (chemical) imaging to estimate the age of bruises,” Med. Sci. Law 47(3), 225–232 (2007). 10.1258/rsmmsl.47.3.225 [DOI] [PubMed] [Google Scholar]
- 15.Maslov K., Stoica G., Wang L. V., “In vivo dark-field reflection-mode photoacoustic microscopy,” Opt. Lett. 30(6), 625–627 (2005). 10.1364/OL.30.000625 [DOI] [PubMed] [Google Scholar]
- 16.Zhang H. F., et al. , “Functional photoacoustic microscopy for high-resolution and noninvasive in vivo imaging,” Nat. Biotechnol. 24(7), 848–851 (2006). 10.1038/nbt1220 [DOI] [PubMed] [Google Scholar]
- 17.Maslov K., et al. , “Optical-resolution photoacoustic microscopy for in vivo imaging of single capillaries,” Opt. Lett. 33(9), 929–931 (2008). 10.1364/OL.33.000929 [DOI] [PubMed] [Google Scholar]
- 18.Wang L. V., “Multiscale photoacoustic microscopy and computed tomography,” Nat. Photon. 3(9), 503–509 (2009). 10.1038/nphoton.2009.157 [DOI] [PMC free article] [PubMed] [Google Scholar]
- 19.Hu S., Wang L. V., “Photoacoustic imaging and characterization of the microvasculature,” J. Biomed. Opt. 15(1), 011101 (2010). 10.1117/1.3281673 [DOI] [PMC free article] [PubMed] [Google Scholar]
- 20.Wang L. V., Hu S., “Photoacoustic tomography: in vivo imaging from organelles to organs,” Science 335(6075), 1458–1462 (2012). 10.1126/science.1216210 [DOI] [PMC free article] [PubMed] [Google Scholar]
- 21.Wang L. V., Wu H., Biomedical Optics: Principles and Imaging, Wiley, Hoboken, NJ: (2007). [Google Scholar]
- 22.Yao J., et al. , “Label-free oxygen-metabolic photoacoustic microscopy in vivo,” J. Biomed. Opt. 16(7), 076003 (2011). 10.1117/1.3594786 [DOI] [PMC free article] [PubMed] [Google Scholar]
- 23.Stein E. W., Maslov K., Wang L. V., “Noninvasive, in vivo imaging of blood-oxygenation dynamics within the mouse brain using photoacoustic microscopy,” J. Biomed. Opt. 14(2), 020502 (2009). 10.1117/1.3095799 [DOI] [PMC free article] [PubMed] [Google Scholar]
- 24.Yao D. K., et al. , “In vivo label-free photoacoustic microscopy of cell nuclei by excitation of DNA and RNA,” Opt. Lett. 35(24), 4139–4141 (2010). 10.1364/OL.35.004139 [DOI] [PMC free article] [PubMed] [Google Scholar]
- 25.Xu Z., Li C. H., Wang L. V., “Photoacoustic tomography of water in phantoms and tissue,” J. Biomed. Opt. 15(3), 036019 (2010). 10.1117/1.3443793 [DOI] [PMC free article] [PubMed] [Google Scholar]
- 26.Wang H. W., et al. , “Label-free bond-selective imaging by listening to vibrationally excited molecules,” Phy. Rev. Lett. 106(23), 238106 (2011). 10.1103/PhysRevLett.106.238106 [DOI] [PMC free article] [PubMed] [Google Scholar]
- 27.Zhang C., et al. , “Label-free photoacoustic microscopy of cytochrome c in cells,” Proc. SPIE 8223, 82231W (2012). 10.1117/12.906202 [DOI] [Google Scholar]
- 28.Wang Y., et al. , “Fiber-laser-based photoacoustic microscopy and melanoma cell detection,” J. Biomed. Opt. 16(1), 011014 (2011). 10.1117/1.3525643 [DOI] [PMC free article] [PubMed] [Google Scholar]
- 29.Zhang C., Maslov K., Wang L. V., “Subwavelength-resolution label-free photoacoustic microscopy of optical absorption in vivo,” Opt. Lett. 35(19), 3195–3197 (2010). 10.1364/OL.35.003195 [DOI] [PMC free article] [PubMed] [Google Scholar]
- 30.Schmitt J. M., “Optical measurement of blood oxygen by implantable telemetry,” PhD Dissertation, Stanford University (1986). [Google Scholar]
- 31.Agati G., Fusi F., “New trends in photobiology recent advances in bilirubin photophysics,” J. Photochem. Photobiol. 7(1), 1–14 (1990). 10.1016/1011-1344(90)85138-M [DOI] [PubMed] [Google Scholar]
- 32.Dixon J. M., Taniguchi M., Lindsey J. S., “PhotochemCAD 2. A refined program with accompanying spectral databases for photochemical calculations,” Photochem. Photobiol. 81(1), 212–213 (2005). 10.1562/2004-11-06-TSN-361.1 [DOI] [PubMed] [Google Scholar]
- 33.Wang L., et al. , “Fast voice-coil scanning optical-resolution photoacoustic microscopy,” Opt. Lett. 36(2), 139–141 (2011). 10.1364/OL.36.000139 [DOI] [PMC free article] [PubMed] [Google Scholar]
- 34.Rao B., et al. , “Real-time four-dimensional optical-resolution photoacoustic microscopy with Au nanoparticle-assisted subdiffraction-limit resolution,” Opt. Lett. 36(7), 1137–1139 (2011). 10.1364/OL.36.001137 [DOI] [PMC free article] [PubMed] [Google Scholar]
- 35.Zhang C., et al. , “Reflection-mode submicron-resolution in vivo photoacoustic microscopy,” J. Biomed. Opt. 17(2), 020501 (2012). 10.1117/1.JBO.17.2.020501 [DOI] [PMC free article] [PubMed] [Google Scholar]
- 36.Mullon C., Langer R., “Determination of conjugated and total bilirubin in serum of neonates, with use of bilirubin oxidase,” Clin. Chem. 33(10), 1822–1825 (1987). [PubMed] [Google Scholar]


