

Abstract
The hemoglobinopathies, disorders of hemoglobin structure and production, protect against death from malaria1. In sub-Saharan Africa, two such conditions occur at particularly high frequencies: presence of the structural variant hemoglobin S and α+-thalassemia, a condition characterized by reduced production of the normal α-globin component of hemoglobin. Individually, each is protective against severe Plasmodium falciparum malaria2–4, but little is known about their malaria-protective effects when inherited in combination. We investigated this question by studying a population on the coast of Kenya and found that the protection afforded by each condition inherited alone was lost when the two conditions were inherited together, to such a degree that the incidence of both uncomplicated and severe P. falciparum malaria was close to baseline in children heterozygous with respect to the mutation underlying the hemoglobin S variant and homozygous with respect to the mutation underlying α+-thalassemia. Negative epistasis could explain the failure of α+-thalassemia to reach fixation in any population in sub-Saharan Africa.
The mutation underlying the hemoglobin S variant (HbS) is a prototypical example of a balanced polymorphism: its frequency in populations is determined both by positive selection for heterozygosity (HbAS)5 and negative selection for homozygosity (HbSS), which causes sickle cell disease, a debilitating condition associated with chronic anemia and premature death. Negative selection has not been shown to affect the frequency of α+-thalassemias. Perhaps as a consequence, these conditions approach fixation in a number of populations; for unknown reasons, however, frequencies remain relatively low in much of sub-Saharan Africa1.
Despite conclusive evidence that both HbAS and α+-thalassemia protect against severe and fatal P. falciparum malaria2–4, the mechanisms underlying this protection are poorly understood. The mechanism of HbAS protection probably relates to either the physical or the biochemical properties of HbS-containing erythrocytes: in vitro, invasion, growth and development of P. falciparum parasites are all diminished in such cells at reduced oxygen tension6,7, and parasite-infected HbAS erythrocytes also seem to be targeted for premature destruction by the spleen6,8,9. These hypothetical mechanisms are supported by both the reduced incidence of clinical malaria and the lower parasite densities observed in children with HbAS erythrocytes when they suffer from clinical attacks3,10. Much less is known about α+-thalassemia. Although both heterozygosity (–α/αα) and homozygosity (–α/–α) with respect to the underlying mutation protect against severe and fatal malaria2,4, neither protects against uncomplicated malaria11 or affects parasite densities during incident episodes2,12. We believe that a better understanding of how these conditions protect against malaria might provide insights into both the pathophysiology of severe malaria and the host-parasite relationship more generally10. Accordingly, we studied the effects of both HbAS and α+-thalassemia on the epidemiology of malaria in children living on the coast of Kenya.
We measured the incidence of P. falciparum malaria in two cohorts of children from Kilifi District, where almost 15% of the population has HbAS and the allele frequency of α+-thalassemia is 0.50. In this area, malaria transmission occurs throughout the year, although most clinically evident infections present after the seasonal rains, which generally fall twice each year13. Individually, both HbAS and α+-thalassemia were associated with protection both from uncomplicated malaria, detected in the community by active clinical surveillance (Table 1 and Fig. 1), and from more severe attacks resulting in hospital admission (Table 2 and Fig. 1). For example, compared with a baseline group (children with both HbAA and normal thalassemia genotype, αα/αα), HbAS was >80% protective (incidence rate ratio (IRR) = 0.19; 95% confidence interval (c.i.) = 0.08–0.47; P < 0.0001) and –α/–α was >30% protective (IRR = 0.67; 95% c.i. = 0.46–0.98; P = 0.038) against hospital admission due to malaria (Table 2 and Fig. 1). But we found evidence for a negative, epistatic interaction between the effects of HbAS and α+-thalassemia on the incidence of malaria infection in both studies. In the case of each malaria outcome, the incidence was lowest in HbAS children with αα/αα; no additional advantage derived from coinherited –α/αα, and the protection afforded by HbAS was lost with coinherited –α/–α (Tables 1–3 and Fig. 1). Notably, of the 113 children in the birth cohort study with HbAS and αα/αα, none were admitted to hospital with severe malaria during almost 436 child years of follow-up (cyfu), whereas 5 of 46 HbAS and –α/–α children were admitted during only 183 cyfu (incidence = 27.33 episodes per 1,000 cyfu; P = 0.0017 by Fisher’s exact test), an incidence similar to that observed in the baseline group. Given the small number of participants with these two-locus geno-types, this observation should be treated with caution, but it suggests that HbAS may be more protective than has been appreciated so far, failing to protect against malaria only when inherited with epistatic genes.
Table 1.
The incidence of uncomplicated malaria by hemoglobin type and α+-thalassemia genotype
| Hb | α+-thalassemia | n | cyfu | Episodes | Incidence* | IRR (95% c.i.) | P |
|---|---|---|---|---|---|---|---|
| HbAA | αα/αα | 103 | 165.0 | 421 | 2.55 | 1.00 | |
| –α/αα | 157 | 272.3 | 647 | 2.37 | 0.89 (0.69–1.14) | 0.343 | |
| –α/–α | 57 | 93.0 | 183 | 1.97 | 0.76 (0.55–1.03) | 0.079 | |
| HbAS | αα/αα | 16 | 25.5 | 38 | 1.49 | 0.56 (0.35–0.97) | 0.039 |
| –α/αα | 26 | 53.0 | 80 | 1.51 | 0.61 (0.39–0.84) | 0.004 | |
| –α/–α | 11 | 13.5 | 29 | 2.16 | 0.85 (0.50–1.42) | 0.530 |
Episodes per cyfu.
Wald test for interaction between hemoglobin type and α+-thalassemia genotype on the incidence of mild clinical P. falciparum malaria (P = 0.0315). IRRs were calculated by Poisson regression, adjusting for age (as a continuous variable), sex and ethnic group and for the interaction between hemoglobin type (HbAS or HbAA) and α+-thalassemia genotype (αα/αα, –α/αα or –α/–α). We took account of potential clustering of events in individual study participants using the sandwich estimator
Figure 1.
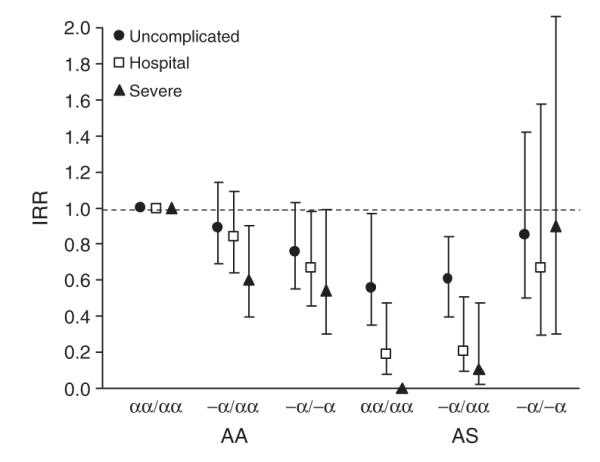
IRRs for malaria by hemoglobin type and α+-thalassemia genotype. Derived from data described in Tables 1 and 2.
Table 2.
Hospital admissions with malaria and severe malaria by hemoglobin type and α+-thalassemia genotype
| Hb | α+-thalassemia | n | cyfu | Malaria admission | Incidence* | IRR (95% c.i.) | P | Severe malaria | Incidence* | IRR (95% c.i.) | P |
|---|---|---|---|---|---|---|---|---|---|---|---|
| HbAA | αα/αα | 626 | 2429.8 | 168 | 69.14 | 1.00 | 67 | 27.57 | 1.00 | ||
| –α/αα | 867 | 3357.6 | 187 | 55.69 | 0.84 (0.64–1.09) | 0.199 | 53 | 15.78 | 0.60 (0.39–0.90) | 0.015 | |
| –α/–α | 302 | 1186.0 | 56 | 47.22 | 0.67 (0.46–0.98) | 0.038 | 17 | 14.33 | 0.54 (0.30–0.99) | 0.045 | |
| HbAS | αα/αα | 113 | 435.6 | 6 | 13.77 | 0.19 (0.08–0.47) | <0.0001 | 0 | 0 | 0 | |
| –α/αα | 150 | 589.0 | 9 | 15.28 | 0.21 (0.09–0.51) | 0.001 | 2 | 3.40 | 0.11 (0.02–0.47) | 0.003 | |
| –α/–α | 46 | 183.0 | 10 | 54.67 | 0.67 (0.29–1.58) | 0.364 | 5 | 27.33 | 0.90 (0.30–2.74) | 0.858 |
Episodes per 1,000 cyfu.
Wald test for interaction between hemoglobin type and α+-thalassemia genotype on the incidence of hospital admission with P. falciparum malaria (P = 0.026) and hospital admission with severe malaria (defined27 and modified25 as previously described) (P = 0.0012). IRRs were calculated as described in Table 1, with adjustment for age (as a continuous variable), sex, ethnic group, bed-net usage (by randomization arm) and area (defined as proximity to the nearest health center) and for the interaction between hemoglobin type (HbAS or HbAA) and α+-thalassemia genotype (αα/αα, –α/αα or –α/–α).
Table 3.
Parasite densities by hemoglobin type and α+-thalassemia genotype
| Uncomplicated malariaa |
Hospital admissionb |
Severe malariab |
||||||||
|---|---|---|---|---|---|---|---|---|---|---|
| Hb | α+-thalassemia | Episodes | Parasite density (95% c.i.)c | P c | Episodes | Parasite density (95% c.i.)c | Pd | Episodes | Parasite density (95% c.i.)c | Pd |
| HbAA | αα/αα | 421 | 16,596 (13,397–20,559) | 168 | 45,186 (32,659–62,373) | 67 | 81,283 (52,119–127,057) | 0.898 | ||
| –α/αα | 647 | 16,452 (12,432–21,774) | 0.952 | 187 | 46,538 (28,961–74,784) | 0.903 | 53 | 77,211 (35,083–169,923) | 0.998 | |
| –α/–α | 183 | 16,540 (11,120–24,600) | 0.987 | 56 | 41,711 (20,942–83,077) | 0.819 | 17 | 81,377 (27,050–244,811) | ||
| HbAS | αα/αα | 38 | 5,796 (2,693–12,474) | 0.007 | 6 | 4,325 (1,874–9,983) | <0.001 | 0 | – | – |
| –α/αα | 80 | 8,047 (4,349–14,891) | 0.021 | 9 | 17,674 (3,577–87,313) | 0.249 | 2 | 4,388 (1,344–14,318) | <0.001 | |
| –α/–α | 29 | 17,918 (7,252–44,271) | 0.868 | 10 | 36,125 (8,760–148,969) | 0.756 | 5 | 116,537 (20,641–657,960) | 0.681 | |
Because previous work has shown that parasite densities are reduced by HbAS3,10 but not by α+-thalassemia2,4,12, we also analyzed parasitemia data. In keeping with our previous findings, we found that parasite densities were reduced during incident malaria infections in children with HbAS but not in children with α+-thalassemia; however, in the case of all three clinical malaria outcomes, the density effect of HbAS was lost when coinherited with α+-thalassemia (Table 3). Taken together, these observations are compatible with the conclusion that these two genes may be acting epistatically with regard to their malaria-protective effects. Individually, these observations might be considered somewhat weak, as several of the two-locus genotypes include relatively few individuals (reflected in the wide confidence intervals of our estimates for some of these groups). But we believe that our conclusion is strengthened both by the existence of a similar pattern in two separate studies, each involving different participants and measuring different outcomes, and by the independent observation of an effect at the level of parasite density.
The concept of epistasis holds that the fitness effect of an allele at one locus depends on the genotype coinherited at a second, unrelated locus. Although classic examples have been described in model systems14, few descriptions are available in humans. This might be because both the outcome (e.g., for diseases such as myocardial infarction15, diabetes16,17 or inflammatory bowel disease18) and the exposure (e.g., disease-susceptibility genes) are rare, making it difficult to test for epistasis without carrying out very large studies14. The situation with malaria is different: several malaria-protective genes are found at high population frequencies, and the outcomes of interest, malaria or severe malaria, are relatively common. Therefore, malaria presents a unique opportunity to test for epistatic effects.
Epistasis is important for several reasons. On one hand, if it occurs commonly, epistatic interactions could make malaria-protective associations more difficult to detect and could complicate the search for mechanisms. On the other hand, epistatic interactions could provide a powerful tool for dissecting the mechanisms of protection afforded by known malaria-protective genes. For example, studying subjects with mixed genotypes for α+-thalassemia and HbS could prove to be a valuable way to test specific hypotheses regarding the mechanisms of malaria protection in these conditions, such as reduced intracellular growth6,7, reduced rosetting19 or increased opsonic phagocytosis8,9,20. Our data, therefore, suggest a fresh approach to investigating malaria-protective mechanisms: studying the effects of genes when inherited in combination.
The frequencies of alleles underlying the hemoglobinopathies vary widely between malaria-endemic populations1. For example, the α+-thalassemias reach extreme frequencies in several populations in Oceania1,2 and South Asia21, but despite levels of malaria transmission that are equally intense, they are much less common in sub-Saharan Africa12,22. We asked whether the current balance of HbAS and α+-thalassemia in malaria-endemic populations might be determined by epistasis. We addressed this question with a simple mathematical model, which we used to determine the allele frequencies at which HbS and α+-thalassemia might equilibrate under different schedules of mortality, reflecting differing levels of negative epistasis. Under this model, increasing degrees of negative epistasis would affect equilibrium frequencies given scenarios of low (Fig. 2a) or high (Fig. 2b) ‘background’ rates of non-malaria-related mortality. Our simulations suggest that if epistasis were operating, it could result in a range of outcomes, including a state of equilibrium between α+-thalassemia and HbAS at allele frequencies that depend on the selective forces involved. At low levels of epistasis, α+-thalassemia could reach fixation; this situation would also be predicted to occur in the absence of HbS. Our simulations also suggest that if the selective advantage of HbAS alone were less pronounced (e.g., because the rate of non-malaria-related mortality was very high; Fig. 2b), negative epistasis could result in the extinction of HbAS. These results suggest, therefore, that epistasis might be one explanation for the wide variation in the frequency of these genes in malaria-endemic populations, a possibility that warrants further investigation.
Figure 2.

The evolutionary consequences of negative epistasis between the malaria-protective effects of HbS and α+-thalassemia. The equilibrium frequencies of HbS (filled diamonds) and α+-thalassemia (unfilled circles) are shown under various schedules of relative mortality, reflecting an increase in epistasis along the x axis. The balance between mortality rates is altered between the graphs by an additional component of non-malaria-specific mortality of (a) μ = 0.034 and (b) μ = 0.05, which we added to the suite of malaria-associated mortality values (μ11 = 0.02757, μ12 = 0.01578, μ13 = 0.01433, μ21 = 0 and μ22 = 0.034, Table 2.)
If this epistatic effect exists, the question of how it might be mediated remains. Several explanations seem plausible, two of which can be summarized as follows. First, the concentration of HbS is lower than that of HbA in erythrocytes from subjects with HbAS because α-globin has a greater affinity for normal (β) than for mutant (βs) β-globin chains. With coexistent α+-thalassemia, the relative deficiency of α-globin chains seems to magnify this affinity effect, such that the intraerythrocytic concentration of HbS is roughly halved in individuals with the two-locus genotype HbAS and –α/–α compared with those with HbAS and αα/αα23. The malaria-protective effects of HbAS might include increased binding of hemichromes (degradation products of hemoglobin) to the cytoplasmic aspect of the erythrocyte membrane9, leading to aggregation of the structural protein band 3. This, in turn, could result in opsonization by autologous IgG and complement C3c fragments and in the accelerated removal of infected erythrocytes by phagocytosis. This cascade could be critically dependent on the intracellular concentration of HbS; this possibility could easily be tested using cells from subjects with mixed genotypes. A second potential explanation relates to erythrocyte membrane physiology. The potential for P. falciparum merozoite invasion might be critically dependent on the hydration status of target erythrocytes24, a property determined by the physiological properties of their membrane. Although both α+-thalassemia and HbS have predictable membrane effects individually, the effect of these conditions inherited in combination is less well understood and is an area of potential interest for future studies.
In summary, our data are compatible with the existence of an epistatic interaction between two common genetic conditions in humans, a situation that could explain, to some extent, the relative prevalence of HbAS and α+-thalassemia in malaria-endemic areas. Although such epistatic effects might impede the search for new malaria-protective associations, they might also provide needed insights into the mechanisms of action of malaria-protective genes.
METHODS
Study design
We investigated the interaction between HbAS and α+-thalassemia in two cohort studies, carried out in populations from the coast of Kenya, both of which were described in detail previously10. The birth cohort study formed the basis of a community randomized controlled trial of insecticide-impregnated bed nets, in which the main outcome of interest was the incidence of hospital admission with malaria and severe malaria25,26. All children born in a defined rural study area, to the north of Kilifi District Hospital, between May 1992 and April 1995 were recruited through a system of demographic surveillance that was completed every 6 weeks. Between May 1992 and December 1997, members of this cohort were identified on admission to the pediatric wards at Kilifi District Hospital, the closest hospital facility to the study area. Routine blood sampling was not a part of the original study; however, between May and October 2000, 2,695 resident surviving members of the original cohort of 3,995 were identified and invited to provide a sample for hemoglobin and α+-thalassemia genotyping. Full typing for both HbAS and α+-thalassemia were completed successfully on 2,104 children.
The main outcome of interest in the second study, the mild disease cohort study, was the incidence of mild clinical malaria in the community, detected by active surveillance for incident episodes of fever. This surveillance ran from September 1998 until August 2001 and involved more than 800 children and adults residing in the Ngerenya area of Kilifi District. The current analysis includes 370 children who were <8 years old for >1 week during the study period.
Ethical permission for both studies was granted by the Kenya Medical Research Institute National Ethical Review Committee. Individual written informed consent was provided by all study participants or their parents.
Clinical definitions
In the mild disease cohort, we defined malaria as fever (axillary temperature >37.5 °C) in conjunction with a slide positive for blood stage asexual P. falciparum parasites at any density at all ages. In the birth cohort, malaria was considered the primary diagnosis on hospital admission if P. falciparum parasites were found in the peripheral blood and other likely causes for clinical presentation could be excluded10. Severe malaria was defined according to standard criteria27 with minor modifications, as described previously25.
Laboratory procedures
We stained blood films and examined them for malaria parasites using standard methods. Parasite densities were recorded as a ratio of parasites to white blood cells or to red blood cells for heavier infections. Densities (parasites per μl of whole blood) were calculated using data from full hematological assessments, if available, or by assuming a white blood count of 8 × 10³ per μl or a red cell count of 5 × 10⁶ per μl. Hemoglobin types were characterized by electrophoresis, and α+-thalassemia genotyping was done by PCR analysis as described previously28.
Statistical analysis
We used Poisson regression analysis to derive IRRs for malaria in children grouped according to HbAS and α+-thalassemia genotype compared with the baseline group (HbAA without α+-thalassemia, HbAA and αα/αα). We carried out analyses for each cohort separately. In both studies our final models included the explanatory variables hemoglobin type (HbAS or HbAA), α+-thalassemia genotype (αα/αα, –α/αα or –α/–α), age (as a continuous variable), sex and ethnic group. In the birth cohort, we also adjusted for bed net usage (by randomization arm) and area (defined as proximity to the nearest health center). We checked for interactions between explanatory variables using the Wald test and took account of potential clustering of events in individual study participants using the sandwich estimator29, which inflates confidence intervals and adjusts significance values as appropriate. For the purpose of this analysis, subjects involved in the cohort study of mild disease were considered not at risk of malaria (and dropped from both numerator and denominator populations) for 21 days after receiving treatment with an antimalarial drug. We controlled for the duration of follow-up in all our analyses by using STATA v 8.0 (Timberlake).
Modeling allele frequencies
The population can be subdivided into nine groups according to two-locus genotypes. The dynamics of the frequency distributions of these two-locus genotypes, xij, can be described by the following set of differential equations:
ordered such that 1 = normal, 2 = heterozygous and 3 = homozygous with respect to the trait in question30. The input term
where μij is the death rate associated with genotype ij, thus keeping the population size constant. In reality, we only need to take into account six genotypes, because historically, in tropical populations, virtually all individuals with HbSS will have died before reaching reproductive age. Mixing functions fi(p), where p = α or σ, are given as f1(p) = (1 – p)2, f2(p) = 2p(1 – p), f3(p) = p2, with the frequencies of α+-thalassemia (α) and sickle cell trait (σ) in the population given as
and
respectively. The mortality schedules were constructed by adding a component of ‘background’ mortality to the rates of severe disease (Table 2). The outcome of this conceptual exercise is determined by the relative mortalities rather than their absolute values.
ACKNOWLEDGMENTS
We thank the field workers, clinical and medical officers and nursing staff of the Kenya Medical Research Institute Centre for their help with this study and N. Peshu, B. Lowe, N. Alexander and D. Roberts for support and advice. This study received financial support from the Wellcome Trust. T.N.W., R.W.S. and K.M. are supported by the Wellcome Trust. D.J.W. is supported by a grant from the Leverhulme Trust. This paper is dedicated to Steve Bennett. This paper is published with permission from the Director of the Kenya Medical Research Institute.
Footnotes
COMPETING INTERESTS STATEMENT The authors declare that they have no competing financial interests.
Reprints and permissions information is available online at http://npg.nature.com/reprintsandpermissions/
References
- 1.Flint J, Harding RM, Boyce AJ, Clegg JB. The population genetics of the haemoglobinopathies. Baillieres Clin. Haematol. 1998;11:1–51. doi: 10.1016/s0950-3536(98)80069-3. [DOI] [PubMed] [Google Scholar]
- 2.Allen SJ, et al. Alpha(+)thalassemia protects children against disease caused by other infections as well as malaria. Proc. Natl. Acad. Sci. USA. 1997;94:14736–14741. doi: 10.1073/pnas.94.26.14736. [DOI] [PMC free article] [PubMed] [Google Scholar]
- 3.Aidoo M, et al. Protective effects of the sickle cell gene against malaria morbidity and mortality. Lancet. 2002;359:1311–1312. doi: 10.1016/S0140-6736(02)08273-9. [DOI] [PubMed] [Google Scholar]
- 4.Williams TN, et al. Both heterozygous and homozygous alpha+ thalassemias protect against severe and fatal Plasmodium falciparum malaria on the coast of Kenya. Blood. 2005;106:368–371. doi: 10.1182/blood-2005-01-0313. [DOI] [PubMed] [Google Scholar]
- 5.Allison AC. Polymorphism and natural selection in human populations. Cold Spring Harb. Symp. Quant. Biol. 1964;24:137–149. doi: 10.1101/sqb.1964.029.01.018. [DOI] [PubMed] [Google Scholar]
- 6.Friedman MJ. Erythrocytic mechanism of sickle cell resistance to malaria. Proc. Natl. Acad. Sci. USA. 1978;75:1994–1997. doi: 10.1073/pnas.75.4.1994. [DOI] [PMC free article] [PubMed] [Google Scholar]
- 7.Pasvol G, Weatherall DJ, Wilson RJ. Cellular mechanism for the protective effect of haemoglobin S against P. falciparum malaria. Nature. 1978;274:701–703. doi: 10.1038/274701a0. [DOI] [PubMed] [Google Scholar]
- 8.Shear HL, et al. Transgenic mice expressing human sickle hemoglobin are partially resistant to rodent malaria. Blood. 1993;81:222–226. [PubMed] [Google Scholar]
- 9.Ayi K, Turrini F, Piga A, Arese P. Enhanced phagocytosis of ring-parasitized mutant erythrocytes. A common mechanism that may explain protection against falciparum-malaria in sickle-trait and beta-thalassemia-trait. Blood. 2004;104:3364–3371. doi: 10.1182/blood-2003-11-3820. [DOI] [PubMed] [Google Scholar]
- 10.Williams TN, et al. Sickle cell trait and the risk of Plasmodium falciparum malaria and other childhood diseases. J. Infect. Dis. 2005;192:178–186. doi: 10.1086/430744. [DOI] [PMC free article] [PubMed] [Google Scholar]
- 11.Williams TN, et al. High incidence of malaria in alpha-thalassaemic children. Nature. 1996;383:522–525. doi: 10.1038/383522a0. [DOI] [PubMed] [Google Scholar]
- 12.Mockenhaupt FP, et al. α+thalassaemia protects African children from severe malaria. Blood. 2004;104:2003–2006. doi: 10.1182/blood-2003-11-4090. [DOI] [PubMed] [Google Scholar]
- 13.Snow RW, et al. Relation between severe malaria morbidity in children and level of Plasmodium falciparum transmission in Africa. Lancet. 1997;349:1650–1654. doi: 10.1016/S0140-6736(97)02038-2. [DOI] [PubMed] [Google Scholar]
- 14.Carlborg O, Haley CS. Epistasis: too often neglected in complex trait studies? Nat. Rev. Genet. 2004;5:618–625. doi: 10.1038/nrg1407. [DOI] [PubMed] [Google Scholar]
- 15.Tiret L, et al. Synergistic effects of angiotensin-converting enzyme and angiotensin-II type 1 receptor gene polymorphisms on risk of myocardial infarction. Lancet. 1994;344:910–913. doi: 10.1016/s0140-6736(94)92268-3. [DOI] [PubMed] [Google Scholar]
- 16.Cordell HJ, Todd JA, Bennett ST, Kawaguchi Y, Farrall M. Two-locus maximum lod score analysis of a multifactorial trait: joint consideration of IDDM2 and IDDM4 with IDDM1 in type 1 diabetes. Am. J. Hum. Genet. 1995;57:920–934. [PMC free article] [PubMed] [Google Scholar]
- 17.Cox NJ, et al. Loci on chromosomes 2 (NIDDM1) and 15 interact to increase susceptibility to diabetes in Mexican Americans. Nat. Genet. 1999;21:213–215. doi: 10.1038/6002. [DOI] [PubMed] [Google Scholar]
- 18.Cho JH, et al. Identification of novel susceptibility loci for inflammatory bowel disease on chromosomes 1p, 3q, and 4q: evidence for epistasis between 1p and IBD1. Proc. Natl. Acad. Sci. USA. 1998;95:7502–7507. doi: 10.1073/pnas.95.13.7502. [DOI] [PMC free article] [PubMed] [Google Scholar]
- 19.Cockburn IA, et al. A human complement receptor 1 polymorphism that reduces Plasmodium falciparum rosetting confers protection against severe malaria. Proc. Natl. Acad. Sci. USA. 2004;101:272–277. doi: 10.1073/pnas.0305306101. [DOI] [PMC free article] [PubMed] [Google Scholar]
- 20.Shear HL. Transgenic and mutant animal models to study mechanisms of protection of red cell genetic defects against malaria. Experientia. 1993;49:37–42. doi: 10.1007/BF01928786. [DOI] [PubMed] [Google Scholar]
- 21.Modiano G, et al. Protection against malaria morbidity: near-fixation of the alpha-thalassemia gene in a Nepalese population. Am. J. Hum. Genet. 1991;48:390–397. [PMC free article] [PubMed] [Google Scholar]
- 22.Allen SJ, et al. A prospective study of the influence of alpha thalassaemia on morbidity from malaria and immune responses to defined Plasmodium falciparum antigens in Gambian children. Trans. R. Soc. Trop. Med. Hyg. 1993;87:282–285. doi: 10.1016/0035-9203(93)90129-e. [DOI] [PubMed] [Google Scholar]
- 23.Brittenham G, et al. Sickle cell anemia and trait in southern India: further studies. Am. J. Hematol. 1979;6:107–123. doi: 10.1002/ajh.2830060203. [DOI] [PubMed] [Google Scholar]
- 24.Tiffert T, et al. The hydration state of human red blood cells and their susceptibility to invasion by Plasmodium falciparum. Blood. 2005;105:4853–4860. doi: 10.1182/blood-2004-12-4948. [DOI] [PMC free article] [PubMed] [Google Scholar]
- 25.Snow RW, et al. Paediatric survival and re-admission risks following hospitalization on the Kenyan coast. Trop. Med. Int. Health. 2000;5:377–383. doi: 10.1046/j.1365-3156.2000.00568.x. [DOI] [PubMed] [Google Scholar]
- 26.Snow RW, et al. The effect of delivery mechanisms on the uptake of bed net re-impregnation in Kilifi District, Kenya. Health Policy Plan. 1999;14:18–25. doi: 10.1093/heapol/14.1.18. [DOI] [PubMed] [Google Scholar]
- 27.World Health Organization Expert Committee on Malaria World Health Organ. Tech. Rep. Ser. 2000;892:1–74. [PubMed] [Google Scholar]
- 28.Chong SS, Boehm CD, Higgs DR, Cutting GR. Single-tube multiplex-PCR screen for common deletional determinants of alpha-thalassemia. Blood. 2000;95:360–362. [PubMed] [Google Scholar]
- 29.Armitage P, Berry G, Matthews JNS. Statistical Methods in Medical Research. 4th edn Blackwell Scientific Publications; Oxford: 2001. Using STATA’s robust cluster command as appropriate. [Google Scholar]
- 30.Ruwende C, et al. Natural selection of hemi- and heterozygotes for G6PD deficiency in Africa by resistance to severe malaria. Nature. 1995;376:246–249. doi: 10.1038/376246a0. [DOI] [PubMed] [Google Scholar]