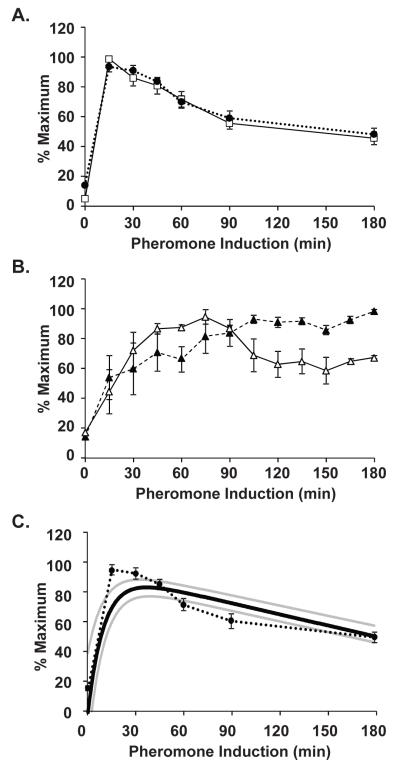
Figure 4.
Comparison of pheromone induction profiles for FUS1 and reporter gene expression. (A) Plot comparing pheromone induction profiles for FUS1 ( ) and GFP* (
 ) mRNA in PFUS1-UBI-MΔkGFP* (C699-198) and PFUS1-UBI-YΔkGFP* (C699-199) strains. Data points are the average from six independent induction time courses (three with strain C699-198 and three with strain C699-199). Error bars show 95% confidence limits. (B) Plot comparing the pheromone induction profile for GFP* fluorescence in the PFUS1-UBI-MΔkGFP* (C699-198) (
 ) and PFUS1-UBI-YΔkGFP* (C699-199)
  reporter strains. More than 25 or 50 individual cells were scored for each time point in a single time course with strain C699-198 or C699-199, respectively. Each data point is the average from four independent time courses. Error bars show 95% confidence limits. (C) Model prediction of the pheromone induced FUS1 mRNA profile using YΔkGFP* fluorescence measurements as input. Plot compares the model mean (
 ) and range (min, max
  ) to the empirically determined reporter GFP* mRNA profile
  from (A).

