Abstract
Objectives
To determine whether cervical vestibular evoked myogenic potential (cVEMP) thresholds or ocular VEMP amplitudes are more sensitive and specific in the diagnosis of superior semicircular canal dehiscence syndrome (SCDS).
Study design
Prospective case-control study
Setting
Tertiary referral center
Subjects and Methods
29 patients with SCDS (mean age 48y; range 31–66y) and 25 age-matched controls (mean age 48y; range 30–66y).
Intervention(s)
cVEMP and oVEMP in response to air-conducted sound (ACS). All patients underwent surgery for repair of SCDS.
Main outcome measure(s)
cVEMP thresholds; oVEMP n10 and peak-to-peak amplitudes.
Results
cVEMP threshold results showed sensitivity and specificity ranging from 80–100% for the diagnosis of SCDS. In contrast, oVEMP amplitudes demonstrated sensitivity and specificity >90%.
Conclusions
oVEMP amplitudes are superior to cVEMP thresholds in the diagnosis of SCDS.
Keywords: oVEMP, cVEMP, SCD, vestibular, tone bursts
Introduction
Superior canal dehiscence syndrome (SCDS) was originally described by Minor and colleagues (1998) and is characterized by a combination of vestibular and auditory signs and symptoms.1 Vestibular manifestations include vertigo and oscillopsia in response to sound and/or pressure (Tullio and/or Hennebert sign, respectively) and chronic disequilibrium, while auditory complaints include autophony, bone-conductive hyperacusis and pulsatile tinnitus.1–3 The diagnostic work-up includes physical examination, audiometric testing,1 vestibular evoked myogenic potential (VEMP) testing4 and imaging by means of high resolution computed tomography (CT).5
The cervical VEMP (cVEMP) is an inhibitory electromyographic (EMG) signal measured over the contracted sternocleidomastoid (SCM) muscle ipsilateral to the ear being stimulated with sound. Evidence suggests that the cVEMP is a consequence of saccular activation.6,7 The cVEMP has been found to show abnormally low thresholds and enlarged peak-to-peak amplitudes in SCDS.4,8 The rationale provided for this phenomenon is that the dehiscent semicircular canal lowers the impedance of the vestibular system resulting in a lower resistance for pressure and sound transmission.9,10 Thus, cVEMP signals are enhanced in patients with SCDS.
More recently, the use of ocular VEMP has been studied for the diagnosis of SCDS.7,11–13 The oVEMP is an excitatory EMG response generated primarily by the inferior oblique muscle 14 contralateral to the stimulated ear, and literature suggests that it is the result of otolith (predominantly utricular) activation.15–17 In the setting of SCDS, oVEMPs also depict lower thresholds and increased amplitudes even to a greater extent to that observed in cVEMP responses.7,11 Indeed, recent work from our laboratory confirmed these findings in ears with surgically-confirmed SCDS, in which cVEMP amplitudes in response to 500 Hz tone bursts (TB) showed approximately a 2-fold mean increase compared with controls, whereas oVEMP amplitudes in response to the same stimulus showed a 10-fold increase.12
Despite these recent findings that suggest the greater utility of oVEMPs for the diagnosis of SCDS, cVEMP testing protocols remain more widely practiced than oVEMP tests. Specifically, many centers still rely on cVEMP thresholds as the principal physiologic test for SCDS, since this was the original VEMP abnormality described in SCDS.4 The present work investigates specifically whether oVEMP amplitudes are more sensitive and specific than cVEMP thresholds for the diagnosis of SCDS.
Methods
Subjects
We performed a prospective case-control study at a tertiary academic medical center.
Twenty-nine individuals in the SCDS group had surgically-confirmed dehiscence of the superior canal (mean age 48y; range 31–66y) and 25 age-matched healthy volunteers (mean age 48y; range 30–66y) with no prior history of neurotological complaints were enrolled in this study (Table 1). All patients with SCDS were tested pre-operatively, and only the ears affected with SCDS were analyzed. Of note, three patients from the SCDS group underwent surgical repair of SCD in both ears and were included in this study as independent cases (total n = 29). VEMP recordings from both ears of controls (n = 50) were evaluated and analyzed. The investigator performing the VEMP testing was not formally blinded but did not have access to the CT scans or reports before or at the time of testing. Furthermore, in many cases the CT was actually obtained after the VEMP test.
Table 1.
Study Population and age distribution
| Age decade | SCDS patients1 | Controls (ears) |
|---|---|---|
|
| ||
| 30s | 5 | 6(12) |
| 40s | 12 | 8 (16) |
| 50s | 10 | 9(18) |
| 60s | 2 | 2(4) |
|
| ||
| Total N (ears) | 29 | 50 |
Only affected ears are included
All participants gave informed consent for the VEMP testing through a protocol approved by the Institutional Review Board at the Johns Hopkins University School of Medicine (Protocol number NA 00035749).
VEMP testing
A commercial electromyographic (EMG) system (Medelec Synergy, Care Fusion, software version 14.1, Dublin, OH) was used for VEMP testing. Air conducted sound (ACS) stimuli were delivered monaurally via TDH-49 calibrated headphones. Two types of ACS stimuli were delivered: (1) 0.1-ms, 105 dB nHL (140 dB peak SPL) clicks of positive polarity at a repetition rate of 5 per second; and (2) 500 Hz, 125 dB SPL TB of positive polarity, with a linear envelope (1 ms rise/fall time, 2 ms plateau), at a repetition rate of 5 per second. One hundred sweeps were averaged for each VEMP stimulus. EMG signals were amplified (2500 μV) and band-pass filtered (20 Hz – 2000 Hz).
VEMP responses were recorded with disposable, self-adhesive, pre-gelled, Ag/AgCl electrodes with attached 100 cm safety leadwires from GN Otometrics (Schaumburg, IL).
cVEMP protocol
CVEMP thresholds were recorded by presenting clicks in decrements of 5 dB nHL. Participants lay semi-recumbent on an examination table with the torso elevated at a 30-degree angle from horizontal. They were instructed to lift their heads from the head rest by flexing their necks to provide tonic background muscle activity. To ensure adequate SCM activation, the tester monitored that the rectified EMG activity was kept at or above 50 μV. The electrode montage consisted of a non-inverting electrode placed at the midpoint of the SCM muscle belly, an inverting electrode placed on the sternoclavicular junction, and a ground electrode placed on the manubrium sterni. The p13 potential was identified as the first distinctive trough in the waveform, occurring approximately 10–14 ms after stimulus onset, and the n23 potential was identified as the first negative peak in the waveform, occurring approximately 19–23 ms after stimulus onset.18
oVEMP protocol
OVEMPs were recorded in response to 500 Hz TB in all subjects. A subset of 17 SCDS and 11 controls (22 ears) also underwent click-evoked oVEMP testing. Participants lay semi-recumbent with their upper bodies elevated at a 30 degree angle from horizontal. Twenty-degree (+ and −) vertical saccades from the line of primary gaze orientation were performed to ensure that symmetrical signals were recorded from both eyes before recording oVEMP results, and if the signal change showed > 25% asymmetry the electrodes were replaced. For oVEMP, subjects were instructed to fix their gaze on a line on the ceiling that was located 30-degrees up from their primary gaze orientation. The electrode montage consisted of a non-inverting electrode placed on the cheek approximately 5 mm below the eyelid and centered beneath the pupil, an inverting electrode placed centered 2 cm below the non-inverting electrode, and a ground electrode placed on the manubrium sterni.
The n10 potential was identified as the first distinctive negative peak in the waveform occurring 7–11 ms after stimulus onset, and the p16 potential was identified as the first distinctive positivity in the waveform occurring 12–16 ms after stimulus onset. The n10 amplitude was calculated as the amplitude from baseline to the peak of the n10 response, and the peak-to-peak amplitude was calculated as the sum of the n10 and p16 amplitudes.18
Surgical procedure
The SCDS patients included in the present study underwent surgical canal plugging plus resurfacing through the middle cranial fossa approach.19 Image guidance and an operating microscope at 10–20X magnification were used to confirm the presence and location of the dehiscent canal. The canal was then plugged with fascia and bone pate, filling the perilymphatic space and thus compressing the membranous canal without disruption. Once plugged, a layer of Hydroset Bone Cement (Stryker Corporation) several millimeters thick was placed over the repair and allowed to set until palpably firm. Finally, a fascia graft was overlaid and sealed in place with fibrin glue.
Statistical Analysis
Differences in VEMP results between SCDS and control ears were analyzed using Mann-Whitney U test. Receiver Operating Characteristic (ROC) Curves were analyzed for each VEMP test modality. All results were considered significant at the P < 0.05 level. SPSS version 18, (IBM SPSS, Chicago, IL) was used for statistical analyses.
Results
At the time of surgical exploration, all 29 SCDS patients had an obvious patent superior canal dehiscence viewed under the operating microscope at 10–20X magnification.
cVEMP thresholds
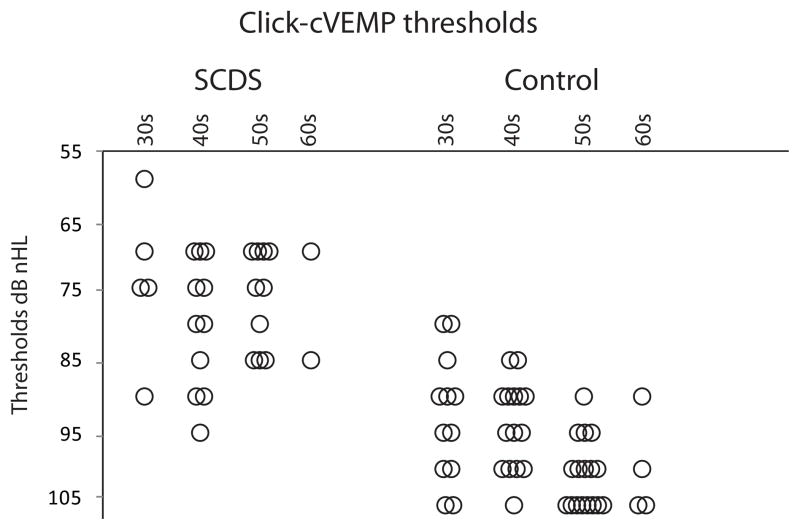
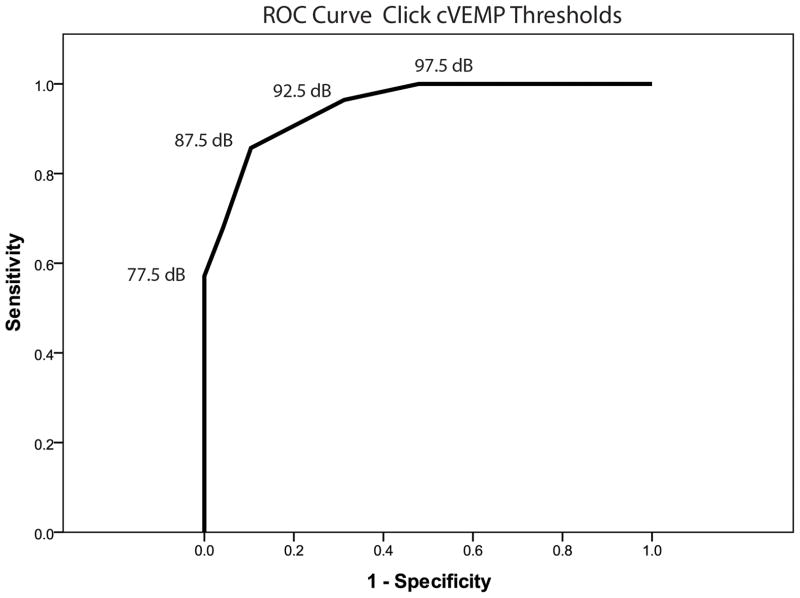
CVEMP responses were absent in 1 SCDS ear and 1 control ear (Table 2). As expected, thresholds of SCDS patients were significantly lower (median = 75 dB nHL) relative to controls (median = 95 dB nHL; U = 69.5, p < 0.001 – Figure 1). The ROC curve revealed that the area under the curve (standard error) was 0.95 (0.023), where an area of 1 represents a perfect test and an area of 0.5 represents a worthless test (Figure 2). A cut-off threshold value of ≤ 85 dB nHL provided the combination of best sensitivity (86%) and specificity (90%) (Table 3). These results can be optimized when further analyzing age-specific results by decade (Table 4). Of note, many patients with SCDS present in their 40s, where the cVEMP thresholds showed fair sensitivity (73%) and good specificity (87%).
Table 2.
VEMP testing Response rates (%)
| click-cVEMP | oVEMP TB | oVEMP clicks | ||||
|---|---|---|---|---|---|---|
| SCDS | Controls | SCDS | Controls | SCDS | Controls | |
| Tested (N) | 29 | 50 | 29 | 50 | 16 | 22 |
| Responses observed (%) | 28 (97%) | 49(98%) | 29 (100%) | 50(100%) | 16 (100%) | 22 (100%) |
Figure 1.
Click-cVEMP thresholds binned by decade of age. Overlapping results are distributed horizontally for better appreciation.
Figure 2.
ROC curve of click-cVEMP thresholds.
Table 3.
VEMP Sensitivity and Specificity for the diagnosis of SCDS
| Cut-off value | Sensitivity (%) | Specificity (%) | ||
|---|---|---|---|---|
| Click-CVEMP | Thresholds (clinical equivalence) | |||
| ≤75 | ≤77.5 | 57% | 100% | |
| ≤80 | ≤ 83 | 68% | 96% | |
| ≤85 | ≤87 | 86% | 90% | |
| ≤90 | ≤92 | 97% | 69% | |
|
| ||||
| TB-OVEMP | peak-to-peak amplitudes | ≥11.7 | 100% | 88% |
| ≥17.1 | 100% | 98% | ||
| ≥ 20.3 | 97% | 100% | ||
|
|
||||
| N1 amplitudes | ≥7.5 | 100% | 94% | |
| ≥9.3 | 100% | 100% | ||
| ≥ 9.9 | 93% | 100% | ||
|
| ||||
| Click-OVEMP | peak-to-peak amplitudes | ≥9.9 | 100% | 100% |
|
|
||||
| N1 amplitudes | ≥2.5 | 100% | 68% | |
| ≥6.6 | 94% | 100% | ||
Table 4.
VEMP Sensitivity and Specificity for the diagnosis of SCDS per decade of age
| Age decade | OVEMP TB: peak-to-peak amplitudes | CVEMP thresholds | ||||
|---|---|---|---|---|---|---|
|
| ||||||
| Cut-off value | Sensitivity (%) | Specificity (%) | Cut-off value | Sensitivity (%) | Specificity (%) | |
| 30s | >17.5 | 100% | 100% | <75 | 80% | 100% |
| <85 | 80% | 73% | ||||
| <90 | 100% | 46% | ||||
|
| ||||||
| 40s | >22 | 100% | 100% | <75 | 45% | 100% |
| <85 | 73% | 87% | ||||
| <90 | 90% | 54% | ||||
|
| ||||||
| 50s | >16.6 | 100% | 94% | <75 | 55% | 100% |
| <85 | 100% | 100% | ||||
| 21.3 | 90% | 100% | <90 | 100% | 60% | |
|
| ||||||
| 60s | >14.8 | 100% | 100% | <75 | 50% | 100% |
| <85 | 100% | 100% | ||||
| <90 | 100% | 75% | ||||
Shaded area highlights the most common age range of SCDS patients
TB-evoked oVEMP results
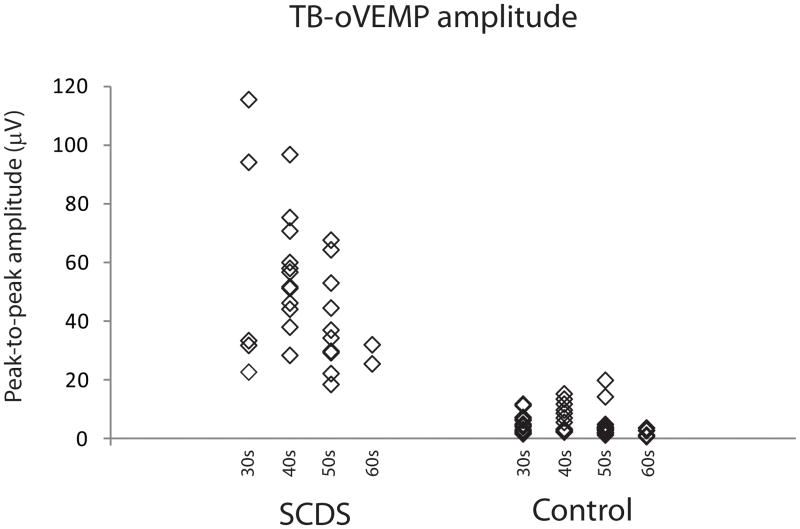
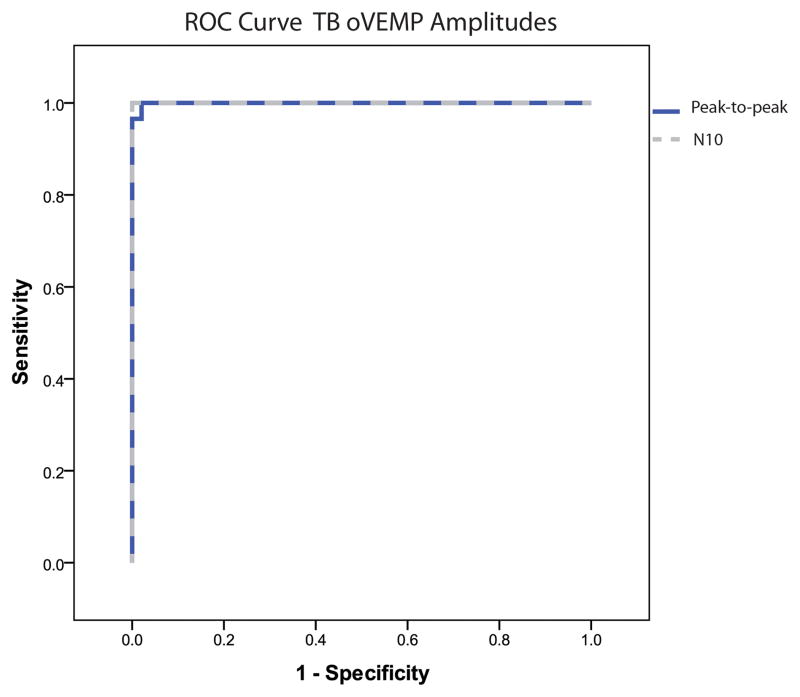
OVEMP response rates for 500 Hz TB are summarized in Table 2. OVEMP results effectively segregated SCDS patients from controls given the significantly higher n10 in the SCDS group (median: SCDS 23.7 μV; controls 2.3 μV. U < 0.001, p < 0.001 – data not shown). The same was true when analyzing peak-to-peak amplitudes (median: SCDS 48.9 μV; controls 3.8 μV. U = 1.0, p < 0.001 – Figure 3). The ROC curve revealed that the area under the curve (standard error) for n10 amplitude was 1.0 (<0.001) and for peak-to-peak amplitude was 0.999 (0.001) (Figure 4). N10 amplitudes ≥ 9.3μV showed an excellent sensitivity (100%) and specificity (100%) and peak-to-peak amplitudes ≥ 17.1 μV also showed excellent sensitivity (100%) and specificity (100%) (Table 3). For peak-to-peak amplitude, decade-specific results showed cut-off values that allowed excellent (>90%) sensitivity and specificity for all ages 30–70 (Table 4).
Figure 3.
TB-oVEMP peak-to-peak amplitudes binned by decade of age.
Figure 4.
ROC curve of TB-oVEMP n10 (dashed line) and peak-to-peak (solid dark line) amplitudes binned by decade of age.
Click-evoked oVEMP results
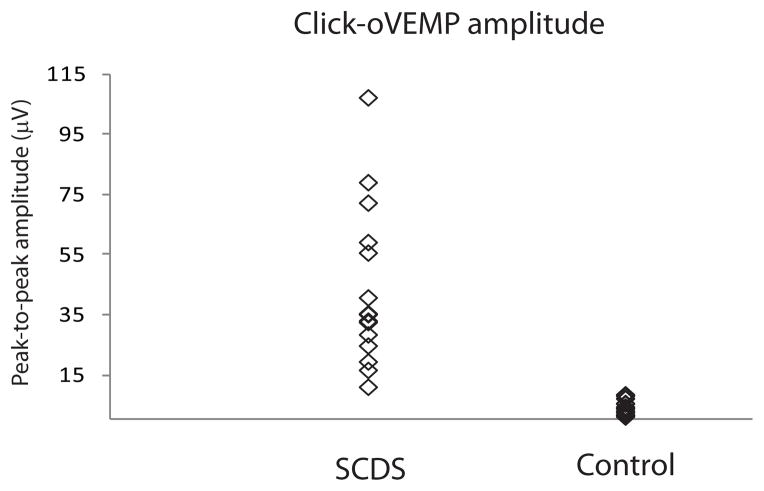
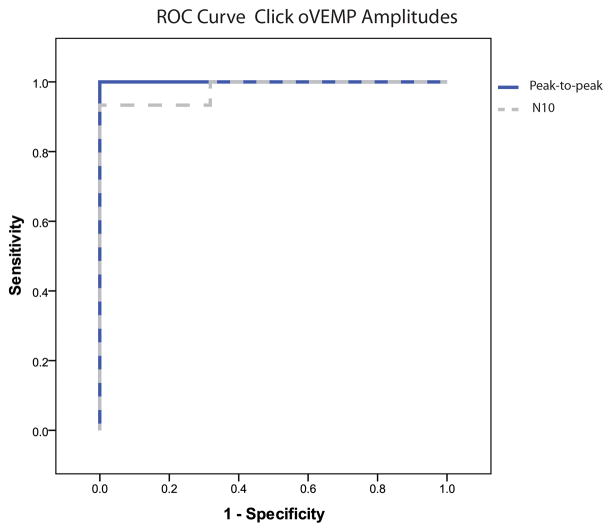
Sixteen SCDS patients also underwent oVEMP testing in response to clicks (Table 2). This stimulus also resulted in oVEMP amplitudes that were significantly higher for ears in SCDS relative to controls (n10 median: SCDS 18.4μV; controls 1.65μV. U = 7.0, p < 0.001; Peak-to-peak median: SCDS 35.2 μV; controls 3.55μV. U < 0.001, p < 0.001 – Figure 5). As shown in Table 3, peak-to-peak amplitudes ≥ 9.9 μV had a sensitivity and specificity of 100% for SCDS (Figure 6). Further analyses based on decade of age were not performed for this test modality given the smaller number of results available.
Figure 5.
Click-oVEMP peak-to-peak amplitudes.
Figure 6.
ROC curve of click-oVEMP n10 (dashed line) and peak-to-peak (solid dark line) amplitudes.
Discussion
This study compared the traditional cVEMP testing protocols (i.e., thresholds) to more recently described oVEMP methods for the diagnosis of SCDS. While both tests have been proven effective in segregating SCDS from controls, amplitude analyses have shown a greater increment in SCDS for oVEMP vs cVEMP responses. However, it was previously not clear if for the diagnosis of SCDS oVEMP amplitudes represent a more effective test modality than cVEMP thresholds.
In this study, both VEMP modalities demonstrated excellent sensitivity and specificity, ranging from 80–100% and 90–100%, respectively. Because VEMP responses can decrease with age, our study incorporated an age-matched control for each SCDS patient. A further advantage of this approach was that it allowed analysis of sensitivity and specificity by decade (Table 4). Our findings demonstrate that TB-evoked oVEMP amplitudes achieved both sensitivity and specificity ≥ 90% for all decades. In contrast, for click-evoked cVEMP thresholds to achieve ≥ 90% sensitivity, specificity had to be compromised, or vice versa. This difference between c- and oVEMP sensitivity/specificity cannot be attributed to the stimulus modality (TB vs clicks), as data from the subset of patients that also underwent oVEMP testing in response to clicks also showed 100% sensitivity and specificity. These findings are in agreement of those previously observed in our laboratory.12
While high-resolution CT will remain essential to the final diagnosis of SCDS, these results show that oVEMP testing in response to ACS provides an excellent screening test without radiation exposure. In addition, as a practical note, the oVEMP amplitude measurement requires considerably less effort and time for the patients than the cVEMP threshold measurement. To measure oVEMP amplitudes, patients need to maintain a standardized upgaze during delivery of a stimulus for ~100 trials (20 seconds). Typically, one to two oVEMP amplitudes are generated in response to a maximum intensity. In contrast for cVEMPs, patients need to effectively contract the SCM muscle continuously during ~100 trials; however typically four to five cVEMP amplitudes must be generated to define the threshold. Thus, the cVEMP threshold determination is significantly more time consuming and tiring for the subject. Finally, patients with SCDS frequently report sensitivity to the sound being either painful or vertiginous. Thus, minimizing the number of trials is desirable in this patient population, and is another argument in favor of oVEMP amplitude measures.
Conclusion
OVEMP amplitudes in response to ACS are superior to cVEMP thresholds in the diagnosis of SCDS. OVEMPs in response to ACS offer an excellent one-step screening for SCDS before CT imaging.
Acknowledgments
Acknowledgement and Funding sources: Authors are grateful for the support of NIH/NIDCD R01 DC005040 (JPC), a Training Grant in Hearing and Balance (PI: Eric Young) T32DC000023 (KLJ) and a grant from the Doris Duke Charitable Foundation to the Johns Hopkins University School of Medicine to fund a Clinical Research Fellow (KDN).
Footnotes
The present work was presented at ANS-COSM 2012 meeting.
References
- 1.Minor LB, Solomon D, Zinreich JS, Zee DS. Sound- and/or pressure-induced vertigo due to bone dehiscence of the superior semicircular canal. Arch Otolaryngol Head Neck Surg. 1998;124(3):249–258. doi: 10.1001/archotol.124.3.249. [DOI] [PubMed] [Google Scholar]
- 2.Minor LB, Cremer PD, Carey JP, Della Santina CC, Streubel SO, Weg N. Symptoms and signs in superior canal dehiscence syndrome. Ann N Y Acad Sci. 2001;942:259–273. doi: 10.1111/j.1749-6632.2001.tb03751.x. [DOI] [PubMed] [Google Scholar]
- 3.Minor LB. Clinical manifestations of superior semicircular canal dehiscence. Laryngoscope. 2005;115(10):1717–1727. doi: 10.1097/01.mlg.0000178324.55729.b7. [DOI] [PubMed] [Google Scholar]
- 4.Brantberg K, Bergenius J, Tribukait A. Vestibular-evoked myogenic potentials in patients with dehiscence of the superior semicircular canal. Acta Otolaryngol. 1999;119(6):633–640. doi: 10.1080/00016489950180559. [DOI] [PubMed] [Google Scholar]
- 5.Belden CJ, Weg N, Minor LB, Zinreich SJ. CT evaluation of bone dehiscence of the superior semicircular canal as a cause of sound- and/or pressure-induced vertigo. Radiology. 2003;226(2):337–343. doi: 10.1148/radiol.2262010897. [DOI] [PubMed] [Google Scholar]
- 6.Colebatch JG, Halmagyi GM, Skuse NF. Myogenic potentials generated by a click-evoked vestibulocollic reflex. J Neurol Neurosurg Psychiatry. 1994;57(2):190–197. doi: 10.1136/jnnp.57.2.190. [DOI] [PMC free article] [PubMed] [Google Scholar]
- 7.Welgampola MS, Myrie OA, Minor LB, Carey JP. Vestibular-evoked myogenic potential thresholds normalize on plugging superior canal dehiscence. Neurology. 2008;70(6):464–472. doi: 10.1212/01.wnl.0000299084.76250.4a. [DOI] [PubMed] [Google Scholar]
- 8.Streubel SO, Cremer PD, Carey JP, Weg N, Minor LB. Vestibular-evoked myogenic potentials in the diagnosis of superior canal dehiscence syndrome. Acta Otolaryngol Suppl. 2001;545:41–49. doi: 10.1080/000164801750388090. [DOI] [PubMed] [Google Scholar]
- 9.Rosowski JJ, Songer JE, Nakajima HH, Brinsko KM, Merchant SN. Clinical, experimental, and theoretical investigations of the effect of superior semicircular canal dehiscence on hearing mechanisms. Otol Neurotol. 2004;25(3):323–332. doi: 10.1097/00129492-200405000-00021. [DOI] [PubMed] [Google Scholar]
- 10.Chien W, Ravicz ME, Rosowski JJ, Merchant SN. Measurements of human middle-and inner-ear mechanics with dehiscence of the superior semicircular canal. Otol Neurotol. 2007;28(2):250–257. doi: 10.1097/01.mao.0000244370.47320.9a. [DOI] [PMC free article] [PubMed] [Google Scholar]
- 11.Rosengren SM, Halmagyi GM, Colebatch JG. Vestibular hypersensitivity to sound in superior canal dehiscence: large evoked responses in the legs produce little postural sway. Clin Neurophysiol. 2008;119(7):1674–1682. doi: 10.1016/j.clinph.2008.03.021. [DOI] [PubMed] [Google Scholar]
- 12.Janky KL, Nguyen KD, Zuniga MG, Welgampola MS, Carey JP. Air-conducted oVEMPs provide the best separation between the intact and dehiscent labyrinth. doi: 10.1097/MAO.0b013e318271c32a. Submitted to Otol Neurotol. [DOI] [PMC free article] [PubMed] [Google Scholar]
- 13.Manzari L, Burgess AM, McGarvie LA, Curthoys IS. Ocular and Cervical Vestibular-Evoked Myogenic Potentials to 500 Hz Fz Bone-Conducted Vibration in Superior Semicircular Canal Dehiscence. Ear Hear. 2012 doi: 10.1097/AUD.0b013e3182498c09. [DOI] [PubMed] [Google Scholar]
- 14.Rosengren SM, Weber KP, Michels R, Sturm V, Laundau K, Straumann D. Single motor unit recordings of ocular vestibular evoked myogenic potentials in human extraocular muscles. 21st Meeting of the European Neurological Society; March, 2011; Lisbon, Portugal. [Google Scholar]
- 15.Rosengren SM, McAngus Todd NP, Colebatch JG. Vestibular-evoked extraocular potentials produced by stimulation with bone-conducted sound. Clin Neurophysiol. 2005;116(8):1938–1948. doi: 10.1016/j.clinph.2005.03.019. [DOI] [PubMed] [Google Scholar]
- 16.Iwasaki S, McGarvie LA, Halmagyi GM, et al. Head taps evoke a crossed vestibulo-ocular reflex. Neurology. 2007;68(15):1227–1229. doi: 10.1212/01.wnl.0000259064.80564.21. [DOI] [PubMed] [Google Scholar]
- 17.Manzari L, Tedesco A, Burgess AM, Curthoys IS. Ocular vestibular-evoked myogenic potentials to bone-conducted vibration in superior vestibular neuritis show utricular function. Otolaryngol Head Neck Surg. 2010;143(2):274–280. doi: 10.1016/j.otohns.2010.03.020. [DOI] [PubMed] [Google Scholar]
- 18.Nguyen KD, Welgampola MS, Carey JP. Test-retest reliability and age-related characteristics of the ocular and cervical vestibular evoked myogenic potential tests. Otol Neurotol. 2010;31(5):793–802. doi: 10.1097/MAO.0b013e3181e3d60e. [DOI] [PMC free article] [PubMed] [Google Scholar]
- 19.Crane BT, Carey JP, Minor LB. Chapter 42: Superior Semicircular Canal Dehiscence Syndrome. In: Brackmann D, Shelton C, Arriaga MA, editors. Otologic Surgery. 3. Elsevier Health Sciences; 2009. p. 512-513-515. [Google Scholar]


