Abstract
A fluorescence-based enzyme activity assay has been demonstrated within a small-core microstructured optical fiber (MOF) for the first time. To achieve this, a reflection-based automated alignment system has been developed, which uses feedback and piezoelectric actuators to maintain optical alignment. The auto-alignment system provides optical stability for the time required to perform an activity assay. The chosen assay is based on the enzyme proprotein convertase 5/6 (PC6) and has important applications in women’s health.
OCIS codes: (060.2370) Fiber optics sensors, (060.4005) Microstructured fibers, (280.1415) Biological sensing and sensors
1. Introduction
Optical fibers are a promising technology for biological sensing, with benefits such as multiplexing and a small size that allows them to be used as minimally invasive probes [1]. In particular, microstructured optical fibers (MOFs), which contain air holes along their length, provide the additional advantage of being both a sensitive intrinsic sensor and a small volume (nL-µL) sample collector [2–8]. A subset of MOFs are suspended-core fibers (SCFs) that are of particular interest as they are relatively simple to fabricate and fill [9–14], while still enabling small volume, high efficiency fluorescence sensing to be performed [15,16]. High sensitivities are achieved by reducing the core diameter to values well below the dimensions of standard single-mode fiber, and this effect has been demonstrated for both fluorescence sensing [16] and surfaced enhanced Raman scattering (SERS) sensing [17,18]. For example, a core diameter of approximately 500 nm for silica SCFs has been shown to yield the maximum possible fluorescence sensing performance [16]. In addition, the high nonlinearity of subwavelength core SCFs could potentially be utilized for refractive index sensing as has been shown for other MOFs [19,20]. To achieve these goals and others, SCFs with sub-micron core diameters as small as 800 nm in silica glass [11], 480 nm in tellurite glass [13], 450 nm in bismuth glass [21], and 400 nm in lead silicate glass [12] have been fabricated.
One clear drawback in using such small-core fibers is the difficulty in maintaining a stable optical alignment, meaning that over time the efficiency with which light is coupled into the core changes significantly. This is a particular issue for sensing applications involving intensity-based measurements, such as absorption [9,11] or fluorescence spectroscopy [14,22]. This becomes critical for applications such as enzyme activity assays that require measurement over longer time periods, as considered in this paper. One possible technique to improve coupling stability is to splice the MOF to a conventional single-mode fiber, and this has been demonstrated for a variety of different structures [23–26]. Splicing conventional single-mode fiber to large-hole small-core SCFs is particularly challenging, and while this has been demonstrated for core diameters as small as 2.5 µm with splice losses reported to be 1.55 dB [25] and 3.09 dB [26], these core diameters are up to five times larger than the optimum core diameter for sensing [16]. Another issue is that splicing closes fluid and gas access for one end of the fiber, interfering with capillary filling. While methods have been proposed to provide access, such as focused ion beam milling of the fiber end facet prior to splicing [27], these are non-trivial techniques.
In this work, we demonstrate a practical alternative to splicing for improving coupling stability into small-core MOFs based on optical feedback from the reflection of light from the end face of the fiber core. This auto-alignment system uses piezoelectric actuators to maintain the optimum coupling position into a small-core fiber and thus allows intensity-based measurements to be made over long time scales, while still providing one free fiber end for sample collection. This auto-alignment technique has been deployed experimentally to perform a fluorescence-based enzyme activity assay on the enzyme proprotein convertase 5/6 (PC6). This is the first time an enzyme activity assay has been demonstrated within an optical fiber.
Women’s infertility is an increasing problem due at least partly from the increasing prevalence of pregnancies occurring later in life. For example, the mean age at first birth in the United States has increased by 3.5 years from 1970 to 2000 [28]. While many causes of infertility are understood a significant proportion are not, and the receptivity of the endometrium (the inner lining of the uterus) is believed to be a significant factor [29,30]. PC6 is an important potential biomarker of endometrial receptivity as it has been shown to be elevated in the uterine lavage in the secretory (luteal) phase of fertile women and reduced in a subgroup of women with unexplained infertility [31]. There is a dearth of tools available to assess the receptivity of the endometrium for diagnosing infertility and assisting decisions on IVF implantation, particularly ones that will not disrupt the endometrium [29]. Current techniques on extracting endometrial fluid involve either aspiration or lavage, and both techniques can be damaging to the endometrium [32]. A MOF sensor, by which receptivity markers can be assessed within the uterine cavity (which contains only low µl volumes of uterine fluid) is attractive for this application due to the small sample volumes required and thus the potential to not damage the endometrium, as well as the suitability of the MOF for minimally invasive in-vivo applications. For example, it may be possible to perform a receptivity measurement and IVF implantation within the sample cycle, which is currently not possible with available diagnostic methods. Thus, it is anticipated that the sensor described in this paper could provide a new diagnostic tool to assess women’s endometrial receptivity: an important aspect of fertility.
2. Automated alignment system
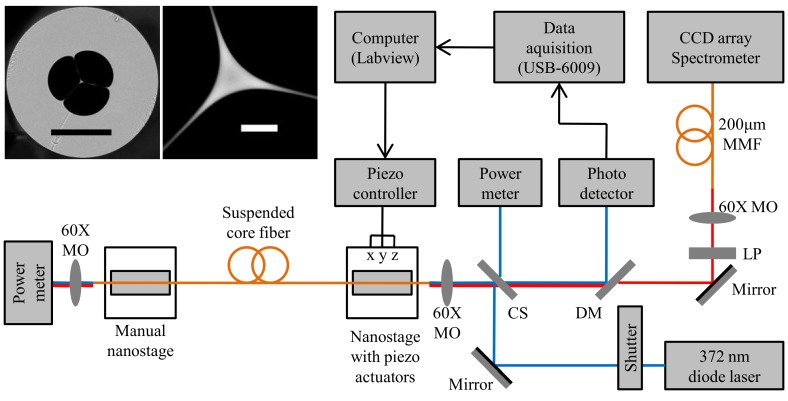
The auto-alignment system used to maintain coupling into the MOF is shown in Fig. 1 . Light from a 372 nm diode laser (Toptica iBeamSmart 375-S, set to 1 mW output) was passed through a 1.65 optical density neutral density filter (not shown), reflected off a mirror, and then approximately 17% was reflected off primarily the back surface of a silica cover slip. The transmitted laser power was collected on a power meter and this measurement was used to normalize the laser power. It should be noted that while up to 83% of the laser power is lost at the cover slip this is not addressed since the optical power required to perform fluorescence measurements using MOFs is low, usually significantly less than that provided by the laser. Indeed, in practice the power often needs to be substantially attenuated to reduce photobleaching when using organic fluorophores [15,33,34]. The laser light was then directed to a 60X microscope objective and focused onto a 2.1 µm silica suspended-core fiber, shown in the inset of Fig. 1. The output of the SCF was directed onto a power meter and logged using the analogue output and a data acquisition (DAQ) card (National Instruments, USB-6009, connection not shown).
Fig. 1.
Auto-alignment experimental setup used to perform an enzyme activity assay within a suspended-core optical fiber. MO = microscope objective, CS = cover slip, DM = dichroic mirror with 50% reflection at 405 nm, LP = 405 nm long pass filter, MMF = multi-mode fiber patch cable. Blue lines indicate the propagation of the 372 nm light while red lines indicate the propagation of fluorescence when the fiber is filled with a fluorophore. Inset figures are scanning electron microscope (SEM) images of the suspended-core fiber used in these experiments. The black scale bar in the left inset SEM image is 50 µm and the white scale bar in the right inset SEM image is 2 µm.
The SCF was fabricated by ultrasonic drilling to create the preform and then drawn using the cane-in-tube technique. The inner core and holes structure was fabricated from Heraeus Suprasil F300HQ to ensure a low fiber loss, while the outer cladding was fabricated from lower quality LWQ silica. The preforms were cleaned with acetone and Milli-Q water following drilling and soaked overnight in nitric acid to remove surface impurities. The caning of the inner structure and final fiber drawing were performed using a 6 m tower with a graphite resistance furnace and pressurization system.
To optimize the coupling efficiency, the fiber was mounted on a nanostage with both manual and piezoelectric actuators (Thorlabs, MAX311D/M). To achieve alignment the fiber was first positioned manually using differential drives until the optical coupling was near maximum, as determined by monitoring the power transmitted through the fiber’s core. The alignment was then optimized and maintained using the piezoelectric actuators. These were driven using a piezo driver (Thorlabs TPZ001) for each of the three linear axes, which in turn was controlled using a LabVIEW program (National Instruments). This program was set to vary the piezoelectric actuators by 0.5 V in the transverse direction and 2.0 V in the longitudinal direction, one axis at a time. For each location, the measured reflected power was compared, and the new axis position set to enable increased reflected power. This was driven at a rate of approximately 5 Hz, that is, five complete alignment steps were performed for each axis per second. Feedback was provided via the Fresnel reflection of the incident laser light from the fiber core, which was subsequently detected by a photo-detector (Newport, 2051-FS-M) and inputted into the computer using the DAQ card. This reflected spot was separated from fluorescence generated from a fluorophore filled fiber (see Sec. 4) using a dichroic mirror (Semrock, LF405/LP-A) and the fluorescence was then filtered using a long pass filter (Semrock, LF405/LP-A) and directed into a spectrometer (Horiba iHR550) with cooled CCD detector using a multi-mode fiber.
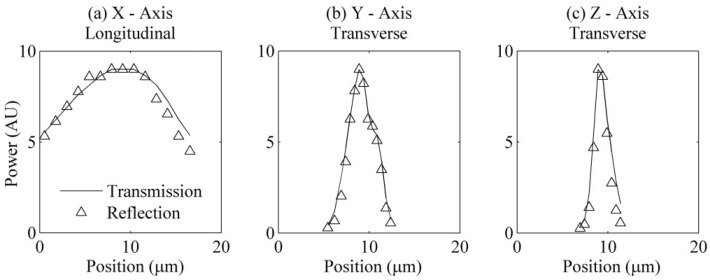
When the laser light strikes the fiber core, approximately 4% is reflected via Fresnel reflection. Unlike the case of reflection from a homogeneous plane, the fiber has an abrupt refractive index difference between the core and the air holes that will reflect and scatter light in a complex manner. Thus, it cannot simply be assumed that the reflected power will be directly proportional to the coupled power. However, when the focused input beam diameter closely matches the fiber diameter, it is observed in practice that there is a unique coupling position for maximizing the transmitted power, which is assumed to correlate to centering a focused beam on the fiber core. It is then hypothesized that centering the focused beam on the fiber core will also maximize the reflected power. To demonstrate experimentally that the reflected power is at a maximum at the same position as when the transmitted power is maximized, both were measured and are plotted against each other in Fig. 2 , where displacement was recorded using strain gauge readers (Thorlabs, TPS002). Figure 2 shows that both the transmitted and reflected powers are close to proportional to each other and, most importantly, the maximum for each occurs at the same location. The reflected power can thus effectively be used as feedback into the alignment program. Note that for this optical system the loss of coupling efficiency is most dramatic for variations in the transverse alignment; for example, a loss of up to 80% can result from a misalignment of only 1 µm in the transverse direction, but only 4% in the longitudinal direction.
Fig. 2.
Comparison of the reflected and transmitted power for 372 nm light coupled into a 2.1 μm core fiber. Results show that the position of maximum power is the same for both the reflected and transmitted power and thus reflected power can be utilized for an auto-alignment system.
3. Coupling stability results
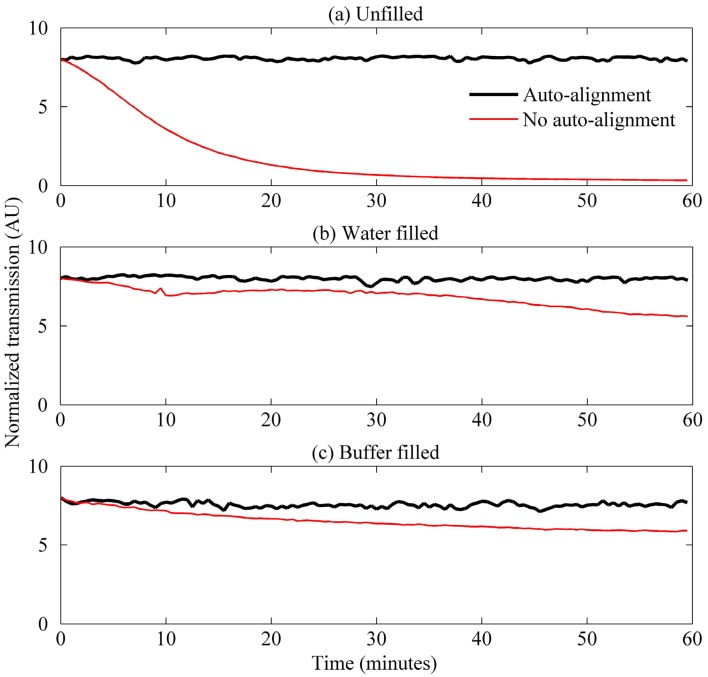
The auto-alignment setup was tested by recording the transmitted power over a period of one hour. The alignment procedure was run for two seconds once every 30 seconds for one hour for unfilled, water filled, and buffer filled SCFs. The buffer used was a pH = 6.5 20 mM bis-tris buffer with 2 mM CaCl2 that was used later for the enzyme reaction (Sec. 4). The results are shown in Fig. 3 and compared to examples of the same measurement when the auto-alignment program was not run.
Fig. 3.
Transmitted power measured when coupling into a 2.1 µm core suspended-core fiber when the fiber is filled with (a) air, (b) water, and (c) bis-tris buffer. Thick black lines indicate the power transmitted when the auto-alignment program was run for two seconds every 30 seconds, while thin red lines indicate the transmitted power when no active coupling was applied.
The results of Fig. 3 show that coupling efficiency can be actively maintained to within a standard deviation measured to be 1.3% for the air-filled fiber, 1.7% for the water-filled fiber, and 2.3% for the buffer-filled fiber. Note that a five-minute moving average falls by 0.91%, 0.15%, and 2.5% for the air, water, and buffer-filled fibers, respectively. The larger drop for the buffer filled fiber may indicate scattering caused by crystallization of the buffer salt, as has previously been observed in MOFs [14]. However, the drops observed when the auto-alignment procedure is used are small compared to the transmission when the SCF was not actively aligned. Red curves in Fig. 3 show that reductions in coupling efficiency of up to 95% can occur over an hour when the coupling is not actively maintained. For this particular set of experiments the largest reduction in power was seen for an unfilled fiber, however, the rate of reduction was not repeatable and no consistent correlation between filled or unfilled fibers was observed. This is because the reduction in coupling efficiency is due to a variety of factors including, but not limited to, air movements at the tip of the fiber, laser beam drift, and thermal expansion or contraction of mechanical components. The results here demonstrate that all these factors can be successfully countered by actively aligning the MOF using reflected power as the feedback, thus allowing assays that require long measurement times, such as enzyme activity assays, to be performed within these small-core fibers.
4. Enzyme activity assay
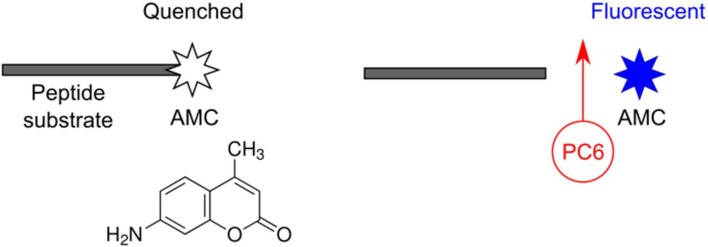
PC6 can be measured via its enzymatic activity [31]. Previous work measured PC6 activity via the cleavage of a fluorogenic peptide substrate (Pyr-Arg-Thr-Lys-Arg-AMC) in solution as indicated in Fig. 4 . In this reaction, the PC6 releases a quenched fluorophore (7-amino-4-methylcoumarin, AMC) from a peptide substrate, which then becomes fluorescent. Here we demonstrate a platform suitable for conducting this measurement based on a suspended-core fiber (Fig. 1 inset). The advantage of this approach is that it allows the enzymatic assay to occur with unprecedentedly low sample volumes (210 nL here compared to 100 µL in [31]) and, potentially, in-vivo.
Fig. 4.
The sensing mechanism. The enzyme (PC6) can release a quenched 7-amino-4-methylcoumarin (AMC) molecule from the peptide substrate. When released, the AMC is no longer quenched and can emit fluorescence upon ultra-violet (UV) excitation. The rate of increase in fluorescence indicates enzyme activity, and, if calibrated, enzyme concentration.
In these experiments, the activity assay was performed by pre-mixing the enzyme and peptide substrate and then filling this solution into the fiber via capillary action. The light guided within the fiber modes that have significant energy within the MOF holes then excite fluorescence from AMC that has been cleaved from the peptide substrate. A portion of the excited fluorescence is then captured by the guided modes of the fiber and directed to a spectrometer, as shown in Fig. 1. The rate of increase of fluorescence intensity measured on the spectrometer thus gives a measure of the enzyme activity rate.
4.1. Cuvette results
Prior to fiber experiments (Sec. 4.2), the fluorescence properties of the enzyme assay were characterized in-cuvette. This was to confirm the function of the assay when excited at 372 nm and at room temperature. Previous studies used an excitation wavelength of 355 nm [31], close to the absorption maximum. However, compact, low-power laser sources are more readily available at 372 nm and the transmission of the silica glass used as the material for the fiber-based sensing architecture is greater at this wavelength. The assay was previously performed at 37°C, and ultimately an in-vivo assay would operate at this temperature. However, for simplicity MOF based trials were performed at room temperature.
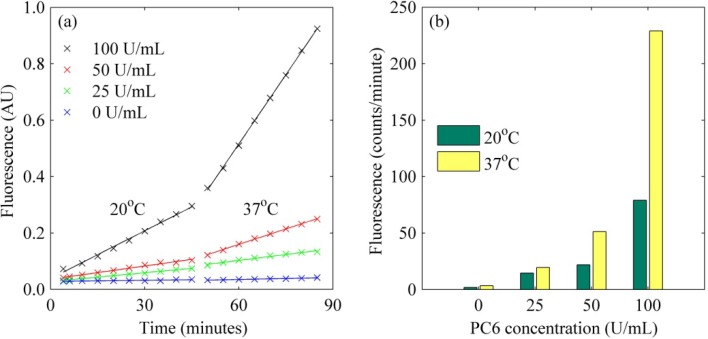
To test the effect of the reduced temperature on the activity assay, trials were first performed in cuvette. A 50 µL micro-cuvette fluorescence emission measurement was performed using a Cary Eclipse Fluorescence Spectrophotometer. The samples were prepared to have a final volume of 50 µL with 100 µM substrate (Bachem, Torrance, California) and various concentrations of PC6 (Pheno-Switch BioSciences Inc., Quebec, Canada) dissolved in a pH = 6.5, 20 mM bis-tris buffer with 2 mM CaCl2 (Sigma-Aldrich). The results shown in Fig. 5 confirm the function of the activity assay and it is clear that the activity is correspondingly higher for higher concentrations of enzyme. The results also show that the assay has an approximately 60% reduction in efficiency when performed at room temperature (20°C) compared to 37°C. While this is undesirable, the results show that the assay can be performed at a lower temperature and thus subsequent fiber measurements were performed at room temperature.
Fig. 5.
Enzyme activity assay for proprotein convertase 5/6 (PC6) in 50 µL cuvettes. The concentration is shown in the legend of (a), where U = enzyme unit = µmol/min of substrate conversion. In (a) the first nine measurements were run at 20°C while the last eight were measured at 37°C. Crosses indicate measured values while lines indicate a line of best fit, separated for each temperature and PC6 concentration. The slope of the lines of best fit in (a), that is, the enzyme activity, are shown in (b).
4.2. Suspended-core fiber results
The enzyme activity assay was performed by filling a SCF with a pre-mixed sample containing the enzyme substrate and PC6 as described for the cuvette measurements in Sec. 4.1. The 100 mm long fibers were filled via capillary action for 1 minute, which ensures complete filling of the fiber. Prior to filling, the fibers were mounted in the experimental setup shown in Fig. 1 and the coupling maximized. After filling, the auto-alignment program was run for two seconds once every five minutes beginning at 4 minutes after mixing of the sample. Spectrometric scanning was performed for 100 ms once every five minutes for one hour (12 scans in total); with the first measurement occurring five minutes after the sample was mixed. Note that the laser light was shuttered between measurements and alignment steps to reduce photobleaching, which was measured as negligible for these conditions.
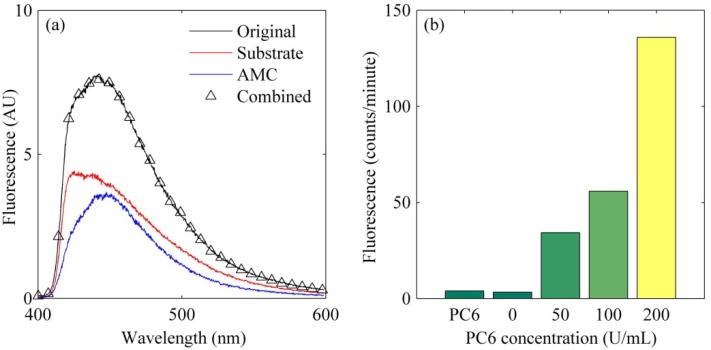
An example of the spectra measured is shown in Fig. 6(a) for the 100 U/mL sample, 30 minutes after the first scan. Note that substantial background arising from the substrate was measured. This is thought to originate from substrate molecules that attach to the surface during filling, resulting in a high signal due to their close proximity to the fiber core (and thus proximity to regions with high light intensity) relative to released AMC. This substrate background was subtracted as follows. First, it was assumed that the spectral shape of the substrate background is proportional to the first measured spectra (Eq. (1), red curve in Fig. 6(a)) as at this point the enzyme should not have released a significant amount of AMC. The spectral shape of the AMC is then found by subtraction of the last and first spectra (Eq. (2), blue curve in Fig. 6(a)) as this difference should primarily be attributed to released AMC. For measurements where the spectra did not increase significantly during the course of the assay, as was the case for the control samples, the AMC reference spectrum was obtained from the 100 U/mL sample. The components of the spectra for scans between the first and last measured scans were then determined by numerically finding the values of βsub and βamc that minimize the expression in Eq. (3). The βamc thus gives the enzyme activity with the substrate background removed:
Fig. 6.
(a) Example spectrum for the enzyme activity assay within the suspended-core MOF, measured 30 minutes after the first scan for the 100 U/ml sample. The black (upper) curve indicates the raw spectrum, the red (middle) curve is the reference spectrum for the substrate background (first scan, Eq. (1), the blue (lower) curve is the AMC reference spectrum (final scan, Eq. (2), and the triangles show that the determined values for βsub and βamc in Eq. (3) yield the correct spectrum. (b) The enzyme activity measured for a filled SCF where the background signal from the substrate has been subtracted.
| (1) |
| (2) |
| (3) |
Figure 6(a) shows representative spectra where the black curve is the raw measured spectrum, the red curve indicates the first scan (substrate background, Eq. (1), the blue curve indicates the AMC reference spectrum (Eq. (2), and the triangles show that the determined values for βsub and βamc yield the correct spectrum. Figure 6(b) shows the values of βamc for various concentrations of PC6, plus the controls showing either only the substrate or only PC6. As anticipated, an increase in enzyme activity is observed with increasing enzyme concentration, with negligible response observed in the control samples. This intensity-based measurement was only possible because the optical alignment was actively maintained during the one-hour long measurement. The smallest concentration of PC6 that could be measured was 50 U/mL, below which the fluorescence increase could not be reliably distinguished from the substrate background.
5. Discussion and conclusions
We have developed a method for maintaining alignment into small-core MOFs using piezoelectric actuators with optical feedback from reflection off the fiber core. This auto-alignment system has been shown to maintain coupling into a 2.1 µm core fiber for at least one hour with a deviation of transmitted power less than 2.5%. This system improves the ability of small-core MOFs to be used for intensity-based sensing, such as absorption and fluorescence spectroscopy. This is particularly important for applications where measurements need to be carried out over long time scales, such as enzyme activity assays. Here we successfully demonstrate the system, based on a microstructured optical fiber, for the particular application of measuring the enzyme activity of PC6, an important biomarker for women’s fertility. This system is shown to measure PC6 concentrations down to 50 U/mL and is limited by the background of the enzyme substrate. This background appears higher than a corresponding measurement in cuvette, where a concentration of 25 U/mL could be measured, noting that this cuvette measurement was not optimized and previously reported results have shown measurement of 10 U/mL using 100 µL samples [31]. The lower sensitivity in the fiber likely results from interactions between the substrate and the fiber surface due to the high surface-to-volume ratio of MOFs.
The SCF sensor allows for the detection of very small sample volumes, in this case 210 nL, and potentially significantly lower, suggesting that the probe could be used in-vivo without adversely affecting the endometrium. This is a significant improvement on previous studies where either 5-10 µL aspirates or 2-5 mL lavage samples have been used [32]. Note that sample volume size can be reduced further by using fibers with fewer or smaller filling holes, at the expense of filling speed. For example, fluorescence based sensing with 9 nL samples has previously been demonstrated in suspended-core optical fibers [35]. Thus, it is anticipated that the SCF enzyme sensor demonstrated in this paper can provide a new minimally invasive and non-disruptive diagnostic tool for assessing endometrial receptivity.
Acknowledgments
We acknowledge Robert Norman from the Robinson Institute at The University of Adelaide for originally suggesting the concept of using IPAS’s fiber dip sensors for endometrial sensing, Jeremy Thompson from the Robinson Institute at The University of Adelaide for useful discussions, Peter Henry and Roman Kostecki from the Institute for Photonics & Advanced Sensing for assistance in fiber drawing, Jens Kobelke from the Institute of Photonic Technology (IPHT) in Jena, Germany, for providing silica suspended-core fibers that were used in preliminary experiments, and Sophea Heng from Prince Henry’s Institute for PC6 sample preparation. This work is supported via the Sensing Technologies for Advanced Reproductive Research (STARR) laboratory, supported by the SA State Government via the Premier's Science & Research Fund (PSRF) scheme. Stephen Warren-Smith acknowledges the support of an Australian Research Council (ARC) Super Science Fellowship and Tanya Monro acknowledges the support of an ARC Federation Fellowship. Guiying Nie and Lois Salamonsen are funded by the National Health and Medical Research Council of Australia, Project grant #611804 (G. N.) and Fellowships #1002028 (L. A. S.) and #494808 (G. N.) and by the Victorian Government’s Operational Infrastructure Program.
References and links
- 1.Wolfbeis O. S., “Fiber-optic chemical sensors and biosensors,” Anal. Chem. 78(12), 3859–3874 (2006). 10.1021/ac060490z [DOI] [PubMed] [Google Scholar]
- 2.Monro T. M., Warren-Smith S. C., Schartner E. P., Francois A., Heng S., Ebendorff-Heidepriem H., Afshar S., V, “Sensing with suspended-core optical fibers,” Opt. Fiber Technol. 16(6), 343–356 (2010). 10.1016/j.yofte.2010.09.010 [DOI] [Google Scholar]
- 3.Emiliyanov G., Jensen J. B., Bang O., Hoiby P. E., Pedersen L. H., Kjaer E. M., Lindvold L., “Localized biosensing with Topas microstructured polymer optical fiber,” Opt. Lett. 32(5), 460–462 (2007). 10.1364/OL.32.000460 [DOI] [PubMed] [Google Scholar]
- 4.Jensen J. B., Hoiby P. E., Emiliyanov G., Bang O., Pedersen L. H., Bjarklev A., “Selective detection of antibodies in microstructured polymer optical fibers,” Opt. Express 13(15), 5883–5889 (2005). 10.1364/OPEX.13.005883 [DOI] [PubMed] [Google Scholar]
- 5.Jensen J. B., Pedersen L. H., Hoiby P. E., Nielsen L. B., Hansen T. P., Folkenberg J. R., Riishede J., Noordegraaf D., Nielsen K., Carlsen A., Bjarklev A., “Photonic crystal fiber based evanescent-wave sensor for detection of biomolecules in aqueous solutions,” Opt. Lett. 29(17), 1974–1976 (2004). 10.1364/OL.29.001974 [DOI] [PubMed] [Google Scholar]
- 6.Rindorf L., Høiby P. E., Jensen J. B., Pedersen L. H., Bang O., Geschke O., “Towards biochips using microstructured optical fiber sensors,” Anal. Bioanal. Chem. 385(8), 1370–1375 (2006). 10.1007/s00216-006-0480-8 [DOI] [PubMed] [Google Scholar]
- 7.Rindorf L., Jensen J. B., Dufva M., Pedersen L. H., Høiby P. E., Bang O., “Photonic crystal fiber long-period gratings for biochemical sensing,” Opt. Express 14(18), 8224–8231 (2006). 10.1364/OE.14.008224 [DOI] [PubMed] [Google Scholar]
- 8.Myaing M. T., Ye J. Y., Norris T. B., Thomas T., Baker J. R., Jr, Wadsworth W. J., Bouwmans G., Knight J. C., Russell P. S. J., “Enhanced two-photon biosensing with double-clad photonic crystal fibers,” Opt. Lett. 28(14), 1224–1226 (2003). 10.1364/OL.28.001224 [DOI] [PubMed] [Google Scholar]
- 9.Webb A. S., Poletti F., Richardson D. J., Sahu J. K., “Suspended-core holey fiber for evanescent-field sensing,” Opt. Eng. 46(1), 010503 (2007). 10.1117/1.2430505 [DOI] [Google Scholar]
- 10.Zhu Y., Bise R. T., Kanka J., Peterka P., Du H., “Fabrication and characterization of solid-core photonic crystal fiber with steering-wheel air-cladding for strong evanescent field overlap,” Opt. Commun. 281(1), 55–60 (2008). 10.1016/j.optcom.2007.08.071 [DOI] [Google Scholar]
- 11.Euser T. G., Chen J. S. Y., Scharrer M., Russell P. S. J., Farrer N. J., Sadler P. J., “Quantitative broadband chemical sensing in air-suspended solid-core fibers,” J. Appl. Phys. 103(10), 103108 (2008). 10.1063/1.2924408 [DOI] [Google Scholar]
- 12.Ebendorff-Heidepriem H., Warren-Smith S. C., Monro T. M., “Suspended nanowires: fabrication, design and characterization of fibers with nanoscale cores,” Opt. Express 17(4), 2646–2657 (2009). 10.1364/OE.17.002646 [DOI] [PubMed] [Google Scholar]
- 13.Liao M., Chaudhari C., Yan X., Qin G., Kito C., Suzuki T., Ohishi Y., “A suspended core nanofiber with unprecedented large diameter ratio of holey region to core,” Opt. Express 18(9), 9088–9097 (2010). 10.1364/OE.18.009088 [DOI] [PubMed] [Google Scholar]
- 14.Ruan Y., Schartner E. P., Ebendorff-Heidepriem H., Hoffmann P., Monro T. M., “Detection of quantum-dot labelled proteins using soft glass microstructured optical fibers,” Opt. Express 15(26), 17819–17826 (2007). 10.1364/OE.15.017819 [DOI] [PubMed] [Google Scholar]
- 15.Afshar S., V, Warren-Smith S. C., Monro T. M., “Enhancement of fluorescence-based sensing using microstructured optical fibres,” Opt. Express 15(26), 17891–17901 (2007). 10.1364/OE.15.017891 [DOI] [PubMed] [Google Scholar]
- 16.Warren-Smith S. C., Afshar S., V, Monro T. M., “Fluorescence-based sensing with optical nanowires: a generalized model and experimental validation,” Opt. Express 18(9), 9474–9485 (2010). 10.1364/OE.18.009474 [DOI] [PubMed] [Google Scholar]
- 17.Khaing Oo M. K., Han Y., Kanka J., Sukhishvili S., Du H., “Structure fits the purpose: photonic crystal fibers for evanescent-field surface-enhanced Raman spectroscopy,” Opt. Lett. 35(4), 466–468 (2010). 10.1364/OL.35.000466 [DOI] [PubMed] [Google Scholar]
- 18.Han Y., Tan S., Oo M. K. K., Pristinski D., Sukhishvili S., Du H., “Towards full-length accumulative surface-enhanced Raman scattering-active photonic crystal fibers,” Adv. Mater. (Deerfield Beach Fla.) 22(24), 2647–2651 (2010). 10.1002/adma.200904192 [DOI] [PubMed] [Google Scholar]
- 19.Ott J. R., Heuck M., Agger C., Rasmussen P. D., Bang O., “Label-free and selective nonlinear fiber-optical biosensing,” Opt. Express 16(25), 20834–20847 (2008). 10.1364/OE.16.020834 [DOI] [PubMed] [Google Scholar]
- 20.Frosz M. H., Stefani A., Bang O., “Highly sensitive and simple method for refractive index sensing of liquids in microstructured optical fibers using four-wave mixing,” Opt. Express 19(11), 10471–10484 (2011). 10.1364/OE.19.010471 [DOI] [PubMed] [Google Scholar]
- 21.Afshar S., V, Zhang W. Q., Ebendorff-Heidepriem H., Monro T. M., “Small core optical waveguides are more nonlinear than expected: experimental confirmation,” Opt. Lett. 34(22), 3577–3579 (2009). 10.1364/OL.34.003577 [DOI] [PubMed] [Google Scholar]
- 22.Ruan Y., Foo T. C., Warren-Smith S. C., Hoffmann P., Moore R. C., Ebendorff-Heidepriem H., Monro T. M., “Antibody immobilization within glass microstructured fibers: a route to sensitive and selective biosensors,” Opt. Express 16(22), 18514–18523 (2008). 10.1364/OE.16.018514 [DOI] [PubMed] [Google Scholar]
- 23.Xiao L., Demokan M. S., Jin W., Wang Y., Zhao C.-L., “Fusion splicing photonic crystal fibers and conventional single-mode fibers: microhole collapse effect,” J. Lightwave Technol. 25(11), 3563–3574 (2007). 10.1109/JLT.2007.907787 [DOI] [Google Scholar]
- 24.Xiao L., Jin W., Demokan M. S., “Fusion splicing small-core photonic crystal fibers and single-mode fibers by repeated arc discharges,” Opt. Lett. 32(2), 115–117 (2007). 10.1364/OL.32.000115 [DOI] [PubMed] [Google Scholar]
- 25.Jaroszewicz L. R., Murawski M., Nasilowski T., Stasiewicz K., Marc P., Szymanski M., Mergo P., “Methodology of splicing large air filling factor suspended core photonic crystal fibres,” Opto-Electron. Rev. 19(2), 256–259 (2011). 10.2478/s11772-011-0004-8 [DOI] [Google Scholar]
- 26.Jaroszewicz L. R., Murawski M., Nasilowski T., Stasiewicz K., Marc P., Szymanski M., Mergo P., Urbanczyk W., Berghmans F., Thienpont H., “Low-loss patch cords by effective splicing of various photonic crystal fibers with standard single mode fiber,” J. Lightwave Technol. 29(19), 2940–2946 (2011). 10.1109/JLT.2011.2163384 [DOI] [Google Scholar]
- 27.Wang F., Yuan W., Hansen O., Bang O., “Selective filling of photonic crystal fibers using focused ion beam milled microchannels,” Opt. Express 19(18), 17585–17590 (2011). 10.1364/OE.19.017585 [DOI] [PubMed] [Google Scholar]
- 28.Mathews T. J., Hamilton B. E., “Mean age of mother, 1970-2000,” Natl. Vital Stat. Rep. 51(1), 1–13 (2002). [PubMed] [Google Scholar]
- 29.Casper R. F., “It’s time to pay attention to the endometrium,” Fertil. Steril. 96(3), 519–521 (2011). 10.1016/j.fertnstert.2011.07.1096 [DOI] [PubMed] [Google Scholar]
- 30.Lessey B. A., “Assessment of endometrial receptivity,” Fertil. Steril. 96(3), 522–529 (2011). 10.1016/j.fertnstert.2011.07.1095 [DOI] [PubMed] [Google Scholar]
- 31.Heng S., Hannan N. J., Rombauts L. J. F., Salamonsen L. A., Nie G., “PC6 levels in uterine lavage are closely associated with uterine receptivity and significantly lower in a subgroup of women with unexplained infertility,” Hum. Reprod. 26(4), 840–846 (2011). 10.1093/humrep/der002 [DOI] [PubMed] [Google Scholar]
- 32.Hannan N. J., Nie G., Rainzcuk A., Rombauts L. J., Salamonsen L. A., “Uterine lavage or aspirate: which view of the intrauterine environment?” Reprod. Sci. 19(10), 1125–1132 (2012). 10.1177/1933719112443879 [DOI] [PubMed] [Google Scholar]
- 33.Englich F. V., Foo T. C., Richardson A. C., Ebendorff-Heidepriem H., Sumby C. J., Monro T. M., “Photoinduced electron transfer based ion sensing within an optical fiber,” Sensors (Basel) 11(10), 9560–9572 (2011). 10.3390/s111009560 [DOI] [PMC free article] [PubMed] [Google Scholar]
- 34.Rajapakse C., Wang F., Tang T. C. Y., Reece P. J., Leon-Saval S. G., Argyros A., “Spectroscopy of 3D-trapped particles inside a hollow-core microstructured optical fiber,” Opt. Express 20(10), 11232–11240 (2012). 10.1364/OE.20.011232 [DOI] [PubMed] [Google Scholar]
- 35.Schartner E. P., Ebendorff-Heidepriem H., Warren-Smith S. C., White R. T., Monro T. M., “Driving down the detection limit in microstructured fiber-based chemical dip sensors,” Sensors (Basel) 11(3), 2961–2971 (2011). 10.3390/s110302961 [DOI] [PMC free article] [PubMed] [Google Scholar]


