Abstract
Decoding the wiring diagram of the retina requires simultaneous observation of activity in identified neuron populations. Available recording methods are limited in their scope: electrodes can access only a small fraction of neurons at once, whereas synthetic fluorescent indicator dyes label tissue indiscriminately. Here, we describe a method for studying retinal circuitry at cellular and subcellular levels combining two-photon microscopy and a genetically encoded calcium indicator. Using specific viral and promoter constructs to drive expression of GCaMP3, we labeled all five major neuron classes in the adult mouse retina. Stimulus-evoked GCaMP3 responses as imaged by two-photon microscopy permitted functional cell type annotation. Fluorescence responses were similar to those measured with the small molecule dye OGB-1. Fluorescence intensity correlated linearly with spike rates >10 spikes/s, and a significant change in fluorescence always reflected a significant change in spike firing rate. GCaMP3 expression had no apparent effect on neuronal function. Imaging at subcellular resolution showed compartment-specific calcium dynamics in multiple identified cell types.
Introduction
The mammalian retina comprises five neuron classes (photoreceptors, horizontal cells, bipolar cells, amacrine cells, and ganglion cells) that each contain between 2 and 30 morphological types (Masland, 2001). Types in one class connect selectively to types in another class, forming pathways that signal specific aspects of the visual input (e.g., contrast, color, motion, diurnal cycle) to the brain (Casagrande and Xu, 2004). Although some signaling pathways are known in reasonable detail (Wässle, 2004), how many pathways exist or how discrete they are at the functional level is unknown, and a comprehensive map of their underlying circuits is lacking. Consequently, our knowledge of functional connectivity between the retina and the brain is mostly incomplete.
Given the ∼60 retinal cell types, the number of potential circuits is large. The challenge to resolve circuits is compounded by the fact that a single cell type might contribute to multiple circuits. Because of this complexity, mapping retinal circuits efficiently requires a method that permits simultaneous monitoring of the activity in many neurons and across neuron classes. Although single-cell patch recording is the gold standard, it does not permit efficient simultaneous targeting of multiple cells. A planar multielectrode array (Meister et al., 1989) can record from many neurons at once but permits spike recordings from only the (superficial) ganglion cell layer; a penetrating multielectrode method (Jones et al., 1992) does not solve this problem because most retinal neurons are nonspiking.
Functional optical imaging can potentially overcome these limitations, contingent on a two-photon-excitable indicator that can be targeted to neuronal subpopulations, and reports neuronal activity reliably, both in spiking and nonspiking neurons. This is the promise of genetically encoded calcium indicators (GECIs) (Palmer and Tsien, 2006), which have already shown their potential in other parts of the mouse brain (Pologruto et al., 2004; Yasuda et al., 2004; Mao et al., 2008), and in other species (Wang et al., 2004; Dreosti et al., 2009; Tian et al., 2009).
We evaluate the genetically encoded calcium indicator GCaMP3 (Tian et al., 2009) as a tool for dissecting neural circuits in the adult mouse retina. Transgene expression could be targeted to all five major retinal neuron classes, with different combinations of adenoassociated virus (AAV) serotype and promoter elements used to drive expression.
Ganglion cells that expressed GCaMP3 had normal light responses. Simultaneous electrophysiological and optical recordings of light-evoked calcium responses showed that a significant change in fluorescence always signaled a significant change in spike rate. A specific functional type, direction-selective (DS) ganglion cells, could be detected among a larger labeled population based on the stimulus-evoked fluorescence response.
GCaMP3 can be used to detect correlated activity across neuron populations. It allows generation of new hypotheses pertaining to connectivity between cells. We demonstrate how whole-cell patch-clamp recording-based hypotheses can be validated through subcellular optical imaging of amacrine cell and bipolar cell neurites. Optical recordings from somas, dendrites, and presynaptic terminals of neuron types across the retina demonstrate the potential of GCaMP3 as a tool for mapping retinal circuits.
Materials and Methods
Gene constructs.
Retinal neurons were targeted using different AAV serotype/promoter combinations. The promoters used in this study were the murine synapsin-1 (syn1; the 1200 bp before the translation start codon), the 200 bp enhancer for mGluR6 followed by an SV40 polyadenylation site (Kim et al., 2008), and a synthetic mGluR1 promoter. The latter was generated as follows.
Cross-species alignment (ECR browser; ecrbrowser.decode.org) (Ovcharenko et al., 2004) of the genomic sequences flanking the mouse metabotropic glutamate receptor 1 gene (mGluR1/Grm1) using ECR setting 350/77 (length/similarity) revealed five conserved domains 200–600 bp in length. Two of these were found ∼6 kb upstream of the transcription start site; three were in the untranslated region and in the first intron of mGluR1. The conserved domains were fused in silico, forming the synthetic 1200 bp promoter (see Notes), which was synthesized de novo (DNA 2.0). In the viral constructs, the syn1 and mGluR1 promoters were preceded by the 350 bp CMV-IE enhancer (Niwa et al., 1991); the mGluR1 construct did not contain an enhancer. GCaMP3 coding sequence was inserted immediately after a promoter and Kozak sequence, and followed by a woodchuck hepatitis virus posttranscriptional regulatory element (WPRE) and SV40 [full sequence shown (see Notes)]. Viral particles were assembled using a modified helper-free system (Stratagene) as a serotype 2/1, 2/2, 2/5, 2/7, or 2/9 (rep/cap genes) AAV, and harvested and purified over sequential cesium chloride gradients as previously described (Grieger et al., 2006).
Viral transfection.
Adult (age, 1.5–6 months) C57BL/6J mice (Charles River Laboratories) of either sex were injected intravitreally with AAV as follows. First, a mouse was anesthetized with isoflurane (3%) and placed under a dissection microscope. Ventilation with isoflurane (1.5%) was continued for the duration of the procedure (5–10 min). A drop of the topical analgesic Proparacaine (0.5%; Bausch & Lomb) was applied to each eye, followed by a drop of Tropicamide (0.5%; Bausch & Lomb) to dilate the pupil and paralyze the ciliary muscle. Then, a 30 gauge sharp needle (BD Biosciences) was used to make a single puncture through the sclera at the level of the ora serrata. Through this puncture, we inserted a 33 gauge blunt-tipped needle mounted on a Hamilton syringe (Hamilton) to inject 0.8–1.0 μl of virus [AAV; 108–109 genome copies/μl; University of Pennsylvania Vector Core, Philadelphia, PA; or assembled per published protocols (Grieger et al., 2006)] in dH2O into the vitreous humor over the central retina. After 2–4 weeks, the animal was killed, its eyes removed, and the retinas harvested for optical imaging and recording.
In vivo electroporation.
Plasmid DNA was electroporated into the retina of postnatal day 0 (P0) to P1 mouse pups using published methods (Matsuda and Cepko, 2004). Briefly, a pup was anesthetized by chilling on ice, the eyelid covering one eye opened, and plasmid DNA (0.3–0.4 μl, 2.2 μg/μl) injected with a blunt-tipped 33 gauge needle, inserted through a small incision in the sclera. Subretinal injection was followed by five square wave pulses (80 V, 50 ms duration, 950 ms interval) applied to the eyes. Retinas were harvested for recording 4–6 weeks after electroporation.
Tissue preparation.
After enucleation, an eye was placed in oxygenated (95% O2–5% CO2) Ames medium (Sigma-Aldrich), hemisected, and the anterior half and lens discarded. The posterior half was carefully removed from the pigment epithelium and incised radially to permit flattening of the tissue. For whole-mount preparation, the isolated retina was then mounted on filter paper and placed under an upright microscope for imaging and recording. Five 1.0 mm apertures in the filter paper permitted bright-field imaging and visual stimulation through the condenser lens. For retinal slice preparation, the isolated retina was placed on a nitrocellulose filter membrane (item no. HAWP01300; Millipore) and cut into 200-μm-thick slices with a tissue slicer (Narishige). Retinal slices attached to the cellulose filter membrane were transferred to a recording chamber, secured with vacuum grease, and then moved to the microscope stage for imaging and recording.
Tissue was continuously perfused (3–6 ml min−1) with oxygenated Ames medium without recycling and imaged with a two-photon microscope (see below). Each retina was fixed after recording (4% paraformaldehyde, 1 h, 20°C), mounted on a glass slide, and counterstained with the nuclear dye 4′,6-diamidino-2-phenylindole (DAPI) (Vector Laboratories) for confocal imaging [Zeiss 510 laser-scanning microscope; 10×, 0.45 numerical aperture (NA), and 40×, 1.3 NA objectives].
Electrophysiological recording.
Extracellular spike recordings were obtained with glass microelectrodes in loose-patch configuration (electrode impedance, 8–12 MΩ; Flaming/Brown P-97 pipette puller; Sutter Instrument). Electrodes were filled with Ames medium (see above) and a red fluorescent dye (Alexa Fluor 568; Invitrogen) for visual guidance under two-photon imaging. The electrode signal was conventionally amplified (Neurodata IR-283; Cygnus Technologies) and filtered, spikes detected in hardware (custom built analog window discriminator), and their time of occurrence recorded with 0.5 ms precision using a data acquisition board (PCI 1200; National Instruments), Apple Macintosh G4, and custom software (Metroworks Codewarrior; Freeware Semiconductors). After recording, a fluorescent dye (Alexa Fluor 568) was electrophoresed into the recorded cell to verify cell identity (±1 nA square wave current pulses through the electrode, 1 Hz duty cycle; 1 min).
Loading of small molecule calcium dye.
Oregon Green 488 BAPTA-1 acetoxymethyl ester [OGB-1-AM (OGB)] [synthesized according to published protocols (U.S. Patent 6,162,931)] was dissolved in 20% Pluronic F-127/DMSO (Invitrogen) and diluted to a final concentration of 1.0 mm in Ames solution. A 0.1 μl bolus of OGB-1-AM in solution was injected under the inner limiting membrane into the intracellular space of the ganglion cell layer. Fluorescent labeling in ganglion cell somas first became apparent ∼15 min after injection of the dye. Fluorescence intensity gradually increased until reaching steady state ∼1 h after injection. All OGB-1-mediated calcium recordings were performed between 1 and 3 h after dye injection.
Optical recording.
Fluorescence measurements were obtained with a modified Olympus BX microscope controlled with ScanImage software (Pologruto et al., 2003) (www.ephus.org) and an Olympus 60×, 0.9 NA, LUMPlanFl/IR objective. Two-photon excitation of GCaMP3 was evoked with a laser (Chameleon Vision II; Coherent) tuned to 910 nm. Epifluorescence emission was separated into “green” and “red” channels with a 565 nm dichroic mirror and BG22 (green channel) and HQ620/90 (red channel) emission filters, respectively, and collected using separate photomultiplier tubes (Hamamatsu). Images were acquired at a resolution of 512 × 128 pixels, at 8 or 16 frames per second and represented between 20 × 20 μm (single cell or dendrites) and 75 × 75 μm (neuron population) on the retina.
Fluorescence responses in somas and dendrites were calculated with custom, ScanImage-compatible algorithms in Matlab. Fluorescent structures were outlined by hand using the roipoly function (Signal Processing Toolbox; The MathWorks). Annotating ∼30 somas in a 75 × 75 μm area required <5 min, obviating the development of a more sophisticated, automated method for our purposes.
The fluorescence intensity of a neuron is reported throughout as the average intensity of all pixels over its soma, including the nucleus. Fluorescence intensity in the nucleus of recorded neurons was always more than threefold dimmer than the cytosol [consistent with short-term expression of GCaMP3 in neurons distal to the viral injection site (Tian et al., 2009)]. Calculations showed that including pixels representing the nucleus had a negligible effect on our measurement of fluorescence change (<5%), which was confirmed experimentally (see Notes). To reduce analysis effort, we forfeited this small margin for improvement.
At all magnifications, a soma was represented by >500 pixels in each image frame. Where subcellular compartments were measured in isolation, this is indicated in the text. Fluorescence responses are reported as normalized increases as follows:
where F is instantaneous fluorescence and F0 is starting fluorescence. Dark noise of the photomultiplier tube was omitted from the calculations because for all recorded cells it was smaller than F0 by >100-fold.
Simultaneous optical and electrophysiological recordings showed that a GCaMP3-labeled cell that modulated its spike rate by 5 spikes or less over the course of a 5 s trial (530 of 747 trials, 71%; n = 42 neurons) showed a 6.9 ± 7.4% decrease in fluorescence intensity from the first to the last 750 ms of recording. The same decrease was observed in ganglion cells labeled with OGB-1 (data not shown). Most of the decrease occurred during the first 250 ms after scan onset. This is consistent with local bleaching of the fluorophore, which monotonically decreases fluorescence until dynamic equilibrium is reached between bleached and unbleached sensor at the focal point. As such, this fluorescence change does not reflect a change in intracellular calcium caused by a change in neuronal activity. For population analyses in which we relied on the fluorescence signal alone to determine what fraction of neurons responded to the flash, we therefore set our threshold for significant response at this average nonspike evoked change plus 1 SD (i.e., 15% ΔF/F).
Signal-to-noise ratio (SNR) of the fluorescence response was calculated as the average ratio of the flash-response amplitude and the SD of the baseline fluorescence as follows:
where i is the image frame where the fluorescence signal after a light flash peaked (window-averaged over 100 ms), and σbaseline is the SD of the fluorescence response during a 2 s time window (>15 image frames), starting 3 s after scan onset, in trials in which no light flash was presented.
Visual stimulation.
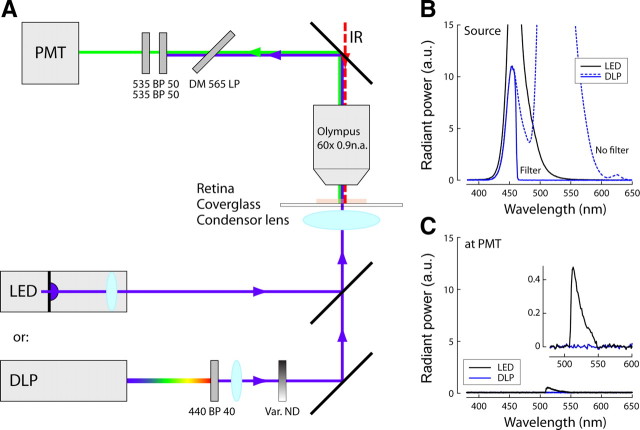
Light responses were evoked with visual stimuli delivered through the condenser lens of the microscope focused on the photoreceptors. A schematic overview of the stimulus setup is shown in Figure 1. Stimuli included (1) spatially uniform flashes from a linearized, calibrated light-emitting diode (LED) (maximum light output, 20 mW/cm2 at the retina; peak emission at 458 nm; Luxeon) and (2) spatiotemporal patterns generated with a miniature digital light projector (DLP) (Pico; Texas Instruments). DLP stimulus spectrum was 420–460 nm; light intensity ranged from 0.1 to 1 mW/cm2 at the retina.
Figure 1.
Schematic of the visual stimulation method. A–C, The retina was stimulated with one of the following two methods: (1) a LED light source to present brief, spatially uniform flashes; or (2) a miniature DLP to present spatiotemporal patterns. Light emitted by the blue LED (peak wavelength at 458 nm) was not filtered before the retina (B, black curve). The broad-spectrum light output of the DLP projector (B, blue dotted line) was bandpass filtered to block wavelengths >460 nm (Brightline 440/40; Semrock). Stimulus light was passed through a variable neutral density filter to control average intensity at the retina. Light entering the “green” PMT was filtered with two dichroic mirrors (DMs) (Chroma Technology), with bandpasses set to collect GCaMP fluorescence [long wavelength (“red”) collecting photon multiplier tube (PMT) omitted for clarity]. The long-wavelength tail of the LED emission extended into the green, and a significant amount of its light entered the PMT (C) (inset shows same data in detail). This precluded fluorescence data collection during LED stimulation but permitted stimulating both UV and green cone photoreceptors. DLP emission at wavelengths >460 nm was blocked after the projector, and DLP light reaching the PMT was negligible at intensities <1 mW/cm2 at the retina (equivalent to ambient light under a clouded sky at noon).
Spatial stimuli included drifting sine wave gratings and contrast edges. Receptive field maps were obtained with a binary checkerboard stimulus (Chichilnisky, 2001) with 15 × 15 patches (40 × 40 μm each; 70% Michelson contrast), updated every 30 ms according to a binary random sequence, followed by spike-triggered averaging (Chichilnisky, 2001).
Data analysis.
Data were analyzed with custom software (Matlab; The MathWorks). Unless otherwise indicated, all trial-averaged values are given as the mean ± SD. Statistical tests were implemented using the standard functions in Matlab.
Results
Targeting GCaMP3 expression to genetically defined cell types in rodent retina
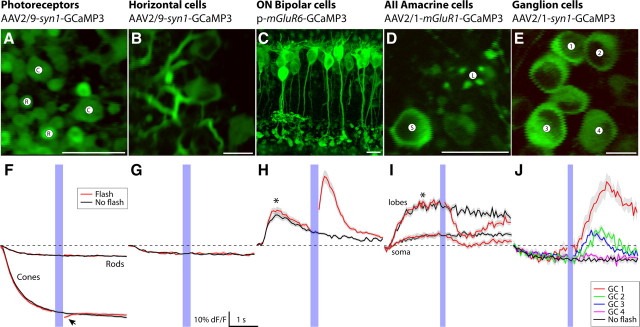
In search of a concise set of vectors that gives genetic access to each neuron class in the mouse retina, we injected a series of AAVs with different serotype and promoter combinations into the mouse eye. The gene expression pattern was assessed after 10–14 d [summarized (see Notes)]. As shown in Figure 2A–E, neurons in each of five major cell classes of the retina can be successfully labeled with GCaMP3 driven by an appropriate combination of serotype and promoter. AAV2/9 with the mouse synapsin-1 (syn1) promoter expressed GCaMP3 in both rod and cone photoreceptors (Fig. 2A). Horizontal cells were also labeled with AAV2/9 and the syn1 promoter (Fig. 2B). These two cell classes could be independently targeted for optical recording because of their distinct morphologies and adequate spatial separation. Attempts to transfect ON-type bipolar cells with a viral vector and the mGluR6 promoter (AAV2/1-mGluR6-SV40) were not successful (data not shown). This is possibly attributable to incompatibility of the bipolar cell surface receptors with the AAV2/1 capsid serotype. However, when the same mGluR6 construct was electroporated into P0 mouse pups, it gave broad labeling exclusively in ON-type bipolar cells (Fig. 2C) (see Notes). AAV2/1 with a synthetic mGluR1 promoter (see Materials and Methods) (see Notes) expressed strongly and almost exclusively in type AII amacrine cells (Fig. 2D). Ganglion cells were labeled with both AAV2/1 and 2/9 combined with the syn1 promoter.
Figure 2.
Summary of vectors and their target neurons in mouse retina. For each retinal neuron class (top), we identified a vector that targets gene expression to some or all of its constituent neuron types. A–E, Fluorescence images of GCaMP3-expressing neurons representative for each class. Two-photon microscopy resolved all labeled structures with submicrometer resolution. Images represent the average fluorescence image obtained from 3 to 10 no-flash trials (<2 min recording time). Scale bar, 10 μm. D, Cross section through soma (S) and lobular appendage (L) of a labeled type AII amacrine cell. F–J, Stimulus evoked fluorescence responses representative for the labeled neuron types shown in A–E. Flash, Fluorescence response to a brief blue light flash (458 nm LED, 125 ms duration, 100 μW/cm2); no flash, scan laser only (red and black solid lines; average ± 1 SD shown in gray). The traces show the fluorescence response measured from the respective images shown in A–E, except the bipolar cells, where an image obtained from retinal slice is shown for clarity, while fluorescence was recorded from a dendritic arbor in a whole-mount retina [arbor shown (see Notes)]. F, Fluorescence signal in cone terminals decreased from scan laser onset; the arrowhead indicates additional fluorescence decrease in response to the LED stimulus. H, I, The asterisks indicate fluorescence response evoked by scan laser onset. J, Responses recorded from four different ganglion cells (annotated in E; not all cells shown for clarity). Fluorescence signals show response heterogeneity expected from different ganglion cell types. Movie clips for these recordings can be viewed online (see Notes).
To test whether GCaMP3 is functional in each of the cell classes, we presented a brief blue light flash (125 ms duration; 458 nm LED; 100 μW/cm2), delivered 2 s after two-photon scan onset. Strong (>20% ΔF/F) light stimulus-evoked fluorescence changes were detected in cone photoreceptors, ON-type bipolar cells, AII amacrine cells and ganglion cells, but not in rod spherules or horizontal cells (Fig. 2E–J) (see Notes).
Characterization of GCaMP3 expression in ganglion cells
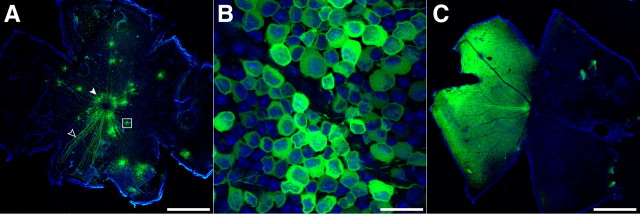
Intravitreal injection of AAV2/1-syn1-GCaMP3 into an adult mouse retina typically gave patchy labeling, with 10–25 clusters of 20–100 strongly labeled cells distributed across the retina (Fig. 3A). Within a cluster, >70% of all somas were labeled (Fig. 3B). In addition to distributed clusters, often a “hot spot” of strongly labeled neurons was visible around the injection site (see Notes). Larger injection volumes (up to 2.0 μl) labeled a similar fraction of cells, but over a larger area (Fig. 3C). We characterized the performance of GCaMP3 in ganglion cells in terms of expression pattern, cytotoxicity, fluorescence response to light stimuli, and correlation to neural signaling. Furthermore, we compared properties of GCaMP3 with those of the calcium indicator OGB.
Figure 3.
AAV2/1-synapsin-1-mediated expression patterns in the mouse retina. Laser-scanning confocal microscope images of GCaMP3 expression (green) 2 weeks after intravitreal injection of AAV2/1-syn1-GCaMP3 into adult mouse eyes. Tissues were counterstained with the nuclear stain DAPI (blue). A, An injection volume of 0.75 μl typically gave a spotted transfection pattern, with several clusters of ∼20–100 brightly labeled cells (white box magnified in B) distributed across the retina. The superficial fiber layer showed bundles of fluorescent axons converging on the optic disc (open arrowhead). Almost all transfected retinas showed labeled cells concentrated at the perimeter of the optic disc (solid arrowhead). B, Higher magnification of the boxed area in A. C, A greater injection volume (1.0–2.0 μl) often gave more uniform labeling, faster expression, and generally higher expression levels (not quantified). Scale bars: A, C, 1.0 mm; B, 25 μm.
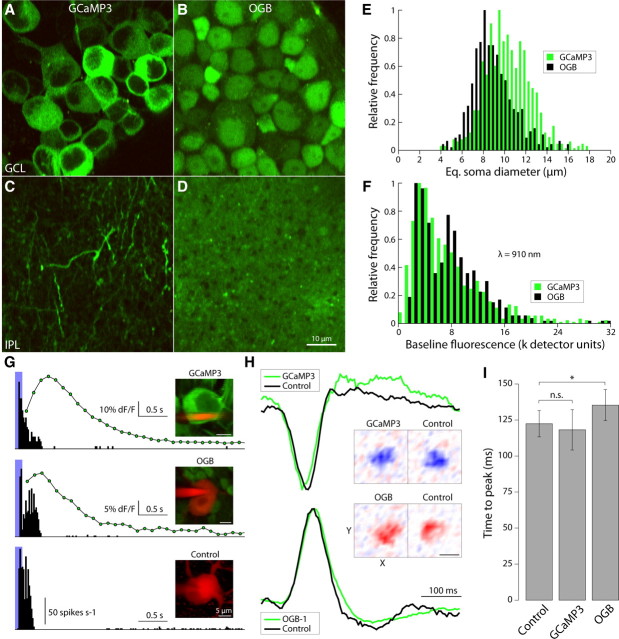
The ganglion cell layer contains ganglion cells as well as numerous somas of starburst amacrine cells. We found that GCaMP3 was selectively targeted to ganglion cells because all labeled cells were axon bearing. Amacrine cells, whose somas are smaller than those of most ganglion cells, were absent or grossly underrepresented in the labeled population, in agreement with known selectivity of the syn1 promoter (Mandell et al., 1992). In the inner plexiform layer (IPL), GCaMP3 resolved individual dendritic processes that could typically be traced back to the soma of a neuron (Fig. 4A,C).
Figure 4.
AAV2/1-syn1-GCaMP3 labels a subset of neurons in the ganglion cell layer and permits imaging with tolerably low laser power. A–D, Two-photon fluorescence images of neuronal somas in the ganglion cell layer (GCL) (A, B) and their dendrites in the IPL (C, D). A, B, Image at the level of the GCL showing somas of GCaMP3-expressing ganglion cells (A) and somas of ganglion cells 60 min after bulk loading with OGB-1-AM (B). C, D, Inner plexiform layer of a retina with GCaMP3-expressing ganglion cells (C) and a retina 60 min after bulk loading with OGB-1-AM (D). E, Distribution of soma sizes of neurons in the ganglion cell layer labeled with GCaMP3 (green) and OGB (black). Soma size is expressed as the equivalent soma diameter (i.e., the diameter of a disc with surface area equal to that of the soma in the fluorescence image). F, Distribution of baseline (nonstimulated) fluorescence intensity for each soma, at typical laser power (∼25 mW after objective). G, Extracellularly recorded spike responses (peristimulus time histogram) of an α-type (brisk transient) ganglion cell expressing GCaMP3 (top), one bulk loaded with OGB-1-AM (middle), and a control cell (nontransfected retina; bottom), stimulated with a brief light flash (458 nm, 125 ms duration, 100 μW/cm2; indicated in blue). For the GCaMP3- and OGB-labeled cells, graphs include the simultaneously recorded fluorescence response (7 Hz frame rate; green circles and black curve). H, Spatiotemporal filters calculated from OFF-type (top) and ON-type ganglion cells (bottom) stimulated with a binary white noise stimulus. Curves show spike temporal response characteristic of the receptive field center; X–Y plots represent the spatial weighting function measured at the temporal response peak of each cell. Scale bar, 200 μm. I, Filter time-to-peak across the recorded ganglion cell population (all brisk transient-type; each group n = 6). n.s., Not significant (t test, p = 0.34). *Significant (t test, p = 0.002). Error bars indicate SEM.
Bulk loading of OGB under the inner limiting membrane, however, labeled all ganglion cells and amacrine cells in the imaged volume indiscriminately (Fig. 4B,E). It also labeled the entire IPL diffusely, with almost no discernable structure (Fig. 4D). The fluorescence intensity of both GCaMP3- and OGB-labeled neurons was similar at the same laser power and wavelength (25 mW at the sample; λ = 910 nm) (Fig. 4F).
GCaMP3 has no apparent effect on ganglion cell function
To test whether GCaMP3 expression interferes with cell function (e.g., through interference with endogenous calcium dynamics), we compared electrophysiological recordings from GCaMP3-labeled cells with unlabeled neurons of the same type (ON α ganglion cells). First, spike responses to a brief light flash were similar (Fig. 4G). Second, spatiotemporal filters recorded with a white noise stimulus matched (Fig. 4H). Finally, using a white noise stimulus and spike-triggered averaging methods (Chichilnisky, 2001), we found that unlabeled and GCaMP3-expressing neurons showed no significant differences in the receptive field and time-to-peak of their temporal filter characteristics (Fig. 4H) (120 ± 8.8 ms, n = 15; vs 120 ± 13.5 ms, n = 13, respectively; t test, p = 0.34). These data suggest that buffering of intracellular Ca2+ by the sensor did not affect the spatiotemporal response properties of a ganglion cell, consistent with a previous report (Margolis et al., 2010). Temporal filters recorded from OGB-labeled neurons, however, peaked slightly later than control neurons and this difference was significant (136 ± 10.4 ms, n = 12; ∼10% increase; t test, p = 0.002) (Fig. 4I).
Adapting light reduces scan laser-evoked light responses
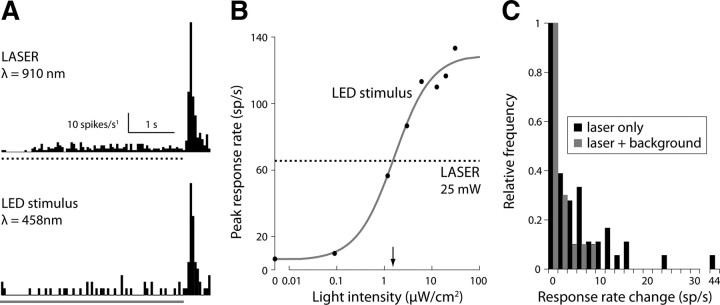
In the dark-adapted retina, photoreceptor activation by the infrared scan laser evoked significant spike responses from ON- and OFF-type ganglion cells (Fig. 5A). Scanning retinas in the absence of fluorophore gave the same pattern and strength of activation (data not shown), demonstrating that the scan laser, and not fluorescence emission, is responsible for the scan artifact. Because the dark-adapted retina is extremely sensitive (Barlow et al., 1971), adding light-adapting background illumination reduced photoreceptor activation by the scan laser. With a constant background stimulus set at the measured laser-equivalent intensity (2.5 μW/cm2) (Fig. 5B), the laser-evoked response never exceeded 10 spikes s−1 and in >80% of cells was 1 spike s−1 or less (Fig. 5C).
Figure 5.
Light-adapting background minimized scan laser-evoked light responses. A, Peristimulus time histogram of an OFF-type ganglion cell spike response to the scan laser (top, dotted line) and blue LED (bottom, blue line). The cell responds strongly when either stimulus is turned off. B, Peak amplitude of the response evoked by the scan laser (dotted line), and LED stimulus at increasing intensity (black dots; blue curve, sigmoidal fit: basis e−1/x expanded with two offset parameters and one linear scale parameter). Response amplitudes matched at a visible light intensity of ∼1.7 μW/cm2 (arrow), equivalent to 400 photoisomerizations/s per M-cone. C, Changes in ganglion cell spike rate evoked by the scanning laser in the presence (n = 16 cells; blue) and absence (n = 48 cells; black) of adapting background illumination (2.5 μW/cm2; 440 ± 20 nm; LED light source). Adding the background eliminated the high spike frequencies characteristic of the response to laser scanning.
GCaMP3 shows functional differences between ganglion cells in a labeled population
To measure light-evoked calcium dynamics in a neural population, we stimulated the whole-mount retina with full-field stimuli and measured the fluorescence response of a population of GCaMP3- or OGB-labeled ganglion cells.
Fluorescence responses during light stimulation showed a variety of response dynamics: slow and fast responses, and responses of opposite sign (Fig. 6B), thus reflecting the known diversity of ganglion cell types that includes sluggish and brisk, ON and OFF (Masland, 2001). Averaged across populations, the amplitude of a light flash-evoked response signaled by GCaMP3 and OGB was similar, 22 ± 1.8% (n = 816) and 17 ± 0.6% ΔF/F (n = 449), respectively (Fig. 6C). Of all GCaMP3-labeled neurons, 27% showed a light response >15% ΔF/F, compared with 28% of neurons for OGB. Amplitude distributions were nearly identical, except for a group of cells with very large response amplitude (>80% ΔF/F) in the GCaMP3 population that was not present in the OGB population. Accordingly, of cells that showed >15% ΔF/F, the average response amplitudes were 59 ± 5.7% (GCaMP3; n = 221) and 35 ± 1.2% (OGB; n = 126).
Figure 6.
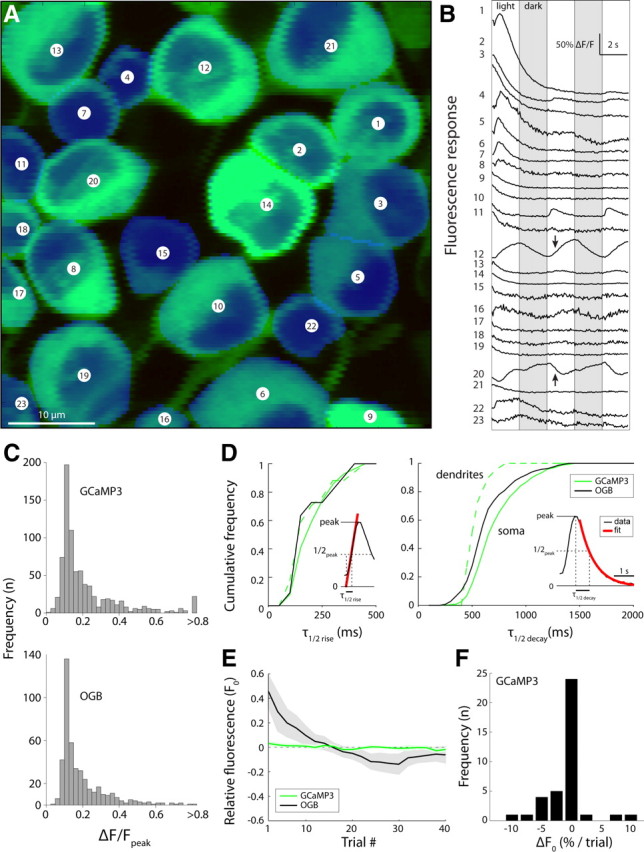
Light-evoked response dynamics of GCaMP3- and OGB-labeled neuronal populations are similar. A, Two-photon laser-scanning image of GCaMP3-expressing retinal ganglion cells counterstained with DAPI. Responses to full-field flicker (2 s switch interval) were imaged for the 23 retinal ganglion cell somas in the field of view. B, Fluorescence responses recorded during stimulation with full-field flicker (respective light and dark phases indicated by white and gray columns) recorded from the 23 cells shown in A. Responses are ordered by the sign (ON, top; OFF, bottom), magnitude, and delay (sluggish top, brisk middle) of the light-evoked fluorescence response. C, Peak fluorescence response histograms for GCaMP3 (top)- and OGB (bottom)-labeled cells are similar. D, Cumulative frequency histograms of fluorescence response kinetics for GCaMP3 (solid green)- and OGB (black)-labeled somas, and for GCaMP3-labeled dendrites (dashed green). Left, Rise kinetics; right, decay kinetics. Insets, Fits for t1/2 (rise) and t1/2 (decay). E, Change in basal fluorescence intensity during repeated laser scanning. Scan duration was 5 s with a 1.5 s interval between scans. Relative fluorescence was calculated as the fractional change in the fluorescence intensity of a cell relative to its fluorescence intensity averaged over all trials (ΔF0/〈F0〉). The shaded areas represent mean ± 1 SEM (GCaMP3, n = 42; OGB-1, n = 11). F, Histogram of basal fluorescence change per trial. Average percentage change was obtained from a linear fit to the fluorescence intensity of a cell in subsequent 5 s trials (GCaMP3 data only; n = 42).
Temporal kinetics of the GCaMP3 fluorescence response in ganglion cells was slightly slower than those of OGB (half-rise: 200 ± 8 ms for GCaMP3, n = 139; 170 ± 30 ms for OGB, n = 11; not significant, p = 0.39, t test; half-decay: 710 ± 8 ms for GCaMP3, n = 854; 630 ± 10 ms for OGB, n = 464; significant, p < 0.0001, t test) (Fig. 6D).
GCaMP3 was more photostable than OGB. Repetitive scanning of GCaMP3-labeled ganglion cells at adequate laser power (25 mW at specimen) gave a minor reduction in baseline fluorescence. In most cells, average fluorescence decreased <2% per trial (Fig. 6E), and 40 continuous, 5 s frame scans, separated by 1.5 s nonscanning intervals, reduced average fluorescence intensity <7% (n = 42 cells) (Fig. 6F). The same experiment with bulk-loaded OGB showed much more pronounced bleaching, >40% (Fig. 6F).
Above detection threshold, the GCaMP3 signal is linear with spike response amplitude
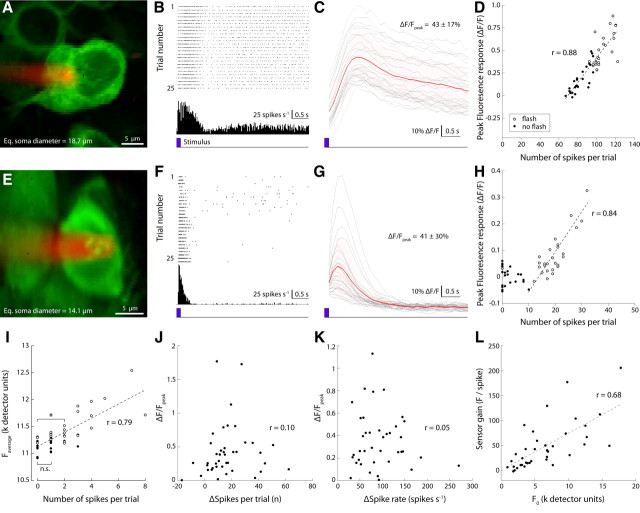
To further characterize the fluorescence changes in response to neural signaling [action potential (AP) firing], we targeted labeled ganglion cells for simultaneous electrophysiological and optical recording (Fig. 7). The number of APs (spikes) evoked by a brief light flash varied from trial to trial, in accordance with known neural response properties of retinal ganglion cells (Dhingra et al., 2003) (Fig. 7A,B,E,F). Average fluorescence intensity of the soma covaried with the number of spikes fired during each 5 s trial. Average SNR (ratio of fluorescence response amplitude to SD of the baseline fluorescence) (see Materials and Methods) of the light-evoked response for cells that showed a >5% change in spike rate was 19.7 ± 21.2 (range, 0.98–114; n = 37).
Figure 7.
GCaMP3 signal gain and linearity vary across the recorded ganglion cell population. A, Two-photon image of an extracellularly recorded GCaMP3-expressing retinal ganglion cell (RGC) (green); Alexa Fluor 568-filled pipette (red). B, Raster plot of the response of the cell to stimulation with a brief light flash (458 nm LED; 125 ms duration; 100 μW/cm2) at trial onset (bottom trace, blue). Twenty-five single trial spike trains are shown. C, Change in fluorescence intensity (ΔF/F) recorded simultaneously with the spike responses shown in B (red, average; shaded light red, SEM of average; gray, single trials). D, Average fluorescence change during each trial (5 s duration) plotted against the total number of spikes fired during that trial. Open circles, Trials in which a brief light flash was presented; filled circles, control trials (no light flash). E–H, Results from a different RGC. Note rectification of the GCaMP3 signal at spike counts <10. I, Example of a ganglion cell recording (morphology not shown) with negligible rectification at low spike counts. The fluorescence intensity during trials in which the cell fired two spikes was significantly greater than during trials in which the cell fired no spikes (p = 0.006, t test). The signal difference between trials with no spikes and trials with a single spike was not significant (p = 0.099, t test). Detector units represent the 12 bit fluorescence intensity value signaled by the photomultiplier tube. J, Correlation between the change in number of spikes fired relative to spontaneous rate and peak fluorescence change of the recorded population (n = 42). Each dot represents a single neuron, with the spike count and peak fluorescence change averaged over all recorded trials (4–30 repeats) (for details, see Results). K, Correlation between change in fluorescence and change in peak spike rate (same data as shown in J). L, Correlation between fluorescence gain (slope of linear fits as shown in D and H) and baseline fluorescence (see text for details).
In most cells, the relationship was distinctly linear (Fig. 7A–D), evidenced by a value of R > 0.7 in 25 of 42 cells. In some cells, responses comprising less than ∼10 spikes did not show a significant response in the fluorescence signal (Fig. 7E–H). This apparent rectification of the sensor at low spike rates was not ubiquitous, as we encountered at least one case in which the average fluorescence response for trials with zero and two spikes differed significantly (p = 0.006, t test) (Fig. 7I).
Next, we compared the gain of the sensor (change in fluorescence for a given change in spiking) for all recorded cells. We tested three related measures of the gain: (1) peak fluorescence response against the flash-dependent change in the total number of spikes fired (Fig. 7J), (2) peak fluorescence response against the flash-dependent change in spike rate (Fig. 7K), and (3) sensor gain against baseline fluorescence (Fig. 7L). All three measures varied strongly between cells. The third measure produced a weakly linear relationship (Fig. 7L), suggesting that, at high expression levels, free Ca2+ is in excess relative to the sensor binding sites.
Because intracellular calcium dynamics might vary between ganglion cell types, we compared the fluorescence gain of cells of the same apparent functional type. Recorded cells (n = 42) were grouped based on the similarity, S, of their flash-evoked spike responses, where
 |
and x and y represent the respective spike rates of cell x and cell y, broken into n time bins (50 ms time bins, 5 s trials). A conservative threshold applied to S (>5) grouped only highly similar cells, gave four groups of two or more cells and left >50% of recorded cells unsorted (Fig. 8A,B). Fluorescence response amplitude within a group could differ by more than threefold—despite near-identical spike responses (Fig. 8C–E). The cause of this variation is not known and may reflect expression level changes resulting from stochastic differences in viral infection, sensor transcription and translation rates, or physiological heterogeneity between cells with similar spike response patterns (i.e., same apparent functional type).
Figure 8.
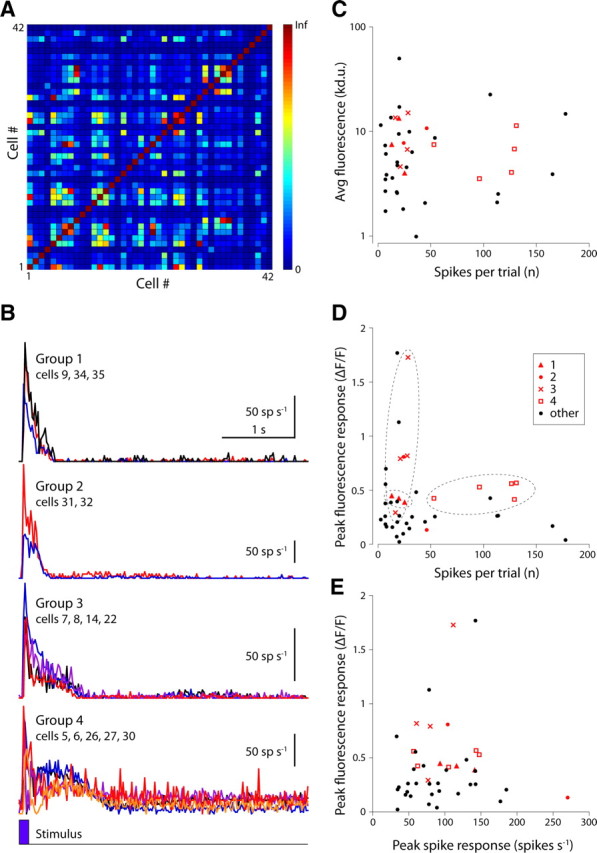
Sensor gain varied across ganglion cells of the same functional type. Ganglion cells were grouped by functional type based on their spike response to a brief light flash. A, Similarity (see Results for details) of flash-evoked spike responses for all pairwise combinations of recorded cells (n = 42). B, Spike responses of all cells in each of four different groups (averaged into 50 ms bins). Each trace represents the average flash-evoked spike response (>10 repeats) of a single ganglion cell. The plot includes data shown in Figure 7. C–E, Scatter plots of various representations of the fluorescence response gain for all recorded cells (n = 42). Red symbols, Cells identified in the clusters shown in B; black symbols, all other cells.
Fluorescence responses in dendrites are larger and faster than in soma
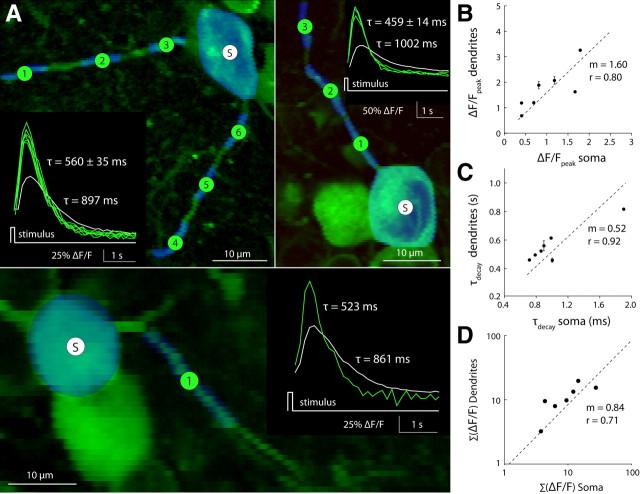
Dendritic arbors of GCaMP3-expressing neurons could be resolved at high spatial resolution (<1 μm) and traced from the ganglion cell into the specific sublamina in the IPL where they stratified (Fig. 9) (see Notes). To compare dendritic and somatic GCaMP3 signals, we simultaneously recorded light-evoked fluorescence responses from the soma and primary dendrites of a cell. The response amplitude in the primary dendrites was always larger than in the soma (1.89 ± 0.61-fold difference; n = 7). The slope of a linear fit to the data constrained to pass through the origin was 1.6 (Fig. 9A,B). The fluorescence signal in the dendrites also peaked earlier and had faster temporal dynamics (see Notes), reflected by a nearly twofold shorter decay time constant in dendrites compared with their respective somas (1.79 ± 0.32-fold difference; n = 7). Here, the slope of a linear fit to the data constrained to pass through the origin was 0.52 (Fig. 9C). Stimulated with a full-field flash, the speed and amplitude of the fluorescence response scaled such that the total response (integral of the fluorescence change over time) in soma and dendrites was the same (Fdendrite:Fsoma = 0.97 ± 0.42; n = 7) (Fig. 9D).
Figure 9.
Calcium responses in dendrites are twofold larger and faster than in somas. Light flash-evoked fluorescence responses measured in ganglion cells where soma and dendrites were visible in the same focal plane. A, Two-photon images of optically recorded neurons. Measured regions (ROIs) (see Materials and Methods) are shown in blue overlaid on the green fluorescence image. S, Soma; 1–6, dendritic segments. Inset, Fluorescence response for all ROIs (soma, white; dendrites, green). Curves show the fluorescence response after a brief light flash (full-field LED, 458 nm, 125 ms duration, 100 μW/cm2; >10 repeats). Decay time constants (τ) were calculated from a single exponential fit to each curve. Different panels represent different examples. B, C, Comparison of fluorescence response amplitude (B) and decay time constant (C) recorded simultaneously from the dendrites and soma of a ganglion cell (plot includes all data shown in A). D, Time integral of the stimulus evoked fluorescence response recorded in dendrites versus soma (n = 7 cells). B–D, Dotted line, Least-squares linear fit to the data, constrained to pass through the origin. m = fit slope; r values calculated from linear regression.
GCaMP3 response can identify known functional types
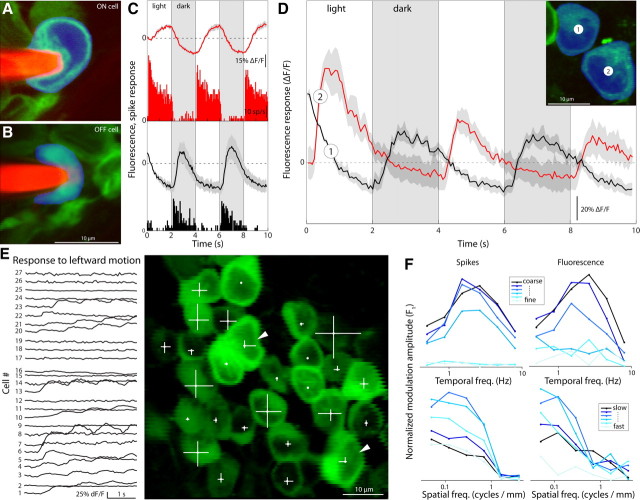
To efficiently study a specific neural circuit (or part thereof), one would ideally label just a single type of neuron within a class with a genetically encoded calcium indicator for optical measurement. For want of genetic markers, most neuron types cannot currently be targeted exclusively and specifically. An alternate approach to achieve specificity uses the fluorescence response of a broadly expressed neural activity indicator to detect a specific functional type in a larger labeled population. Extracellular spike recordings confirmed that ganglion cells with respectively ON- and OFF-type fluorescence responses (as in Fig. 6) were indeed ON- and OFF-type cells based on their spike response (Fig. 10A–D). Since GCaMP3 labeled all ganglion cells, we tested whether we could differentiate DS ganglion cells based on their fluorescence response evoked by motion stimuli.
Figure 10.
Stimulus-evoked GCaMP3 responses identify distinct functional types. A, B, Two-photon fluorescence image of a GCaMP3-expressing ganglion cell (green) targeted for recording with an extracellular glass electrode (red). C, Simultaneously recorded fluorescence (trace, top) and spike responses (PSTH, bottom) obtained from the cells shown in A (red) and B (black). Cells were stimulated with a full-field light stimulus that switched from dim to bright and vice versa every 2 s. Polarity of the spike response identified the cells as ON and OFF type, respectively. D, Example of a simultaneously recorded, adjacent OFF and ON cell pair (1 and 2, respectively). E, Fluorescence responses (left) of GCaMP3-expressing ganglion cells (right) stimulated with square wave gratings (0.5 cycle mm−1, 1 Hz) drifting in different directions (motion direction orthogonal to grating orientation; response to leftward motion shown). Length of each of the four white bars over each cell in the fluorescence image (right) reflects the Fourier amplitude of the fluorescence response of the cell at 1 Hz for motion in each direction. Direction-selective retinal ganglion cells are indicated by white arrowheads. F, Spatiotemporal tuning functions recorded from a brisk-transient type ganglion cell (data not shown). The cell was stimulated with sine wave gratings of different spatial frequencies and temporal frequencies (70% Michelson contrast; 5 s per trial, 6 repeats) and tuning curves calculated from the simultaneously recorded spike response (left panels) and fluorescence response (right panels).
DS ganglion cells represent a subset of ganglion cells that respond selectively to contrast edges moving in a preferred direction (Barlow and Levick, 1965; Oyster, 1968) (for review, see Demb, 2007). To detect DS ganglion cells among their non-DS neighbors, we presented low spatial frequency square wave gratings drifting in four orthogonal directions, and compared the fluorescence response of ∼30 GCaMP3-expressing cells in the stimulated region (Fig. 10E). Although cells differed in the modulation amplitude (F1) of their fluorescence response, most cells showed no significant difference in the modulation amplitude evoked by the different directions of motion. However, among the recorded population, two cells did show a significant (>1.5 SD) asymmetry in their response to the different motion directions (Fig. 10E, white arrowheads), suggesting that these are DS ganglion cells.
Next, we tested the feasibility of optically measuring spatiotemporal tuning curves, which vary between ganglion cell types and are an established means to discriminate between retinal ganglion cells of different types in cat (X vs Y) (Derrington and Lennie, 1984) and primate (P vs M) (Frishman et al., 1987). We presented drifting sine wave gratings of different spatial and temporal frequencies, recorded the fluorescence response of a cell, and compared it with the simultaneously recorded spike response (Fig. 10F).
The peaks of spatiotemporal tuning curves recorded optically and electrophysiologically broadly matched (Fig. 10F). Tuning curves were similar except at low spike rates, where response modulation that was apparent in the spike response could not be resolved from the fluorescence signal. Furthermore, because GCaMP3 has a fluorescence decay time constant of ∼700 ms (see above) (Tian et al., 2009), frequencies above ∼2 Hz were increasingly attenuated. The absence of modulation in the fluorescence response at high temporal frequencies may be attributable to signal integration by the sensor (see Notes). Signal integration is apparent in the recordings (Fig. 10E) (see Notes) and can be used to discriminate between a cell that is not activated by the stimulus and a cell whose response modulation exceeds the temporal bandwidth of the sensor (see Notes).
Compartmentalized calcium dynamics in a nonspiking neuron
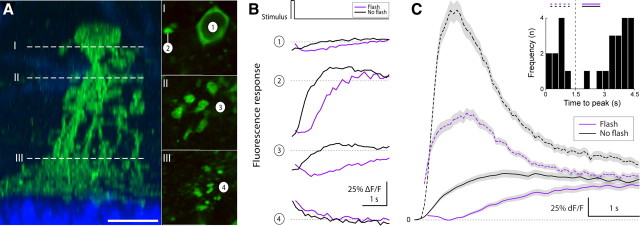
As shown in Figure 2D, AAV2/1 with a synthetic mGluR1 promoter drove expression strongly in type AII amacrine cells. Because these were the only labeled neurons with processes in the IPL, the dendritic arbor of each cell could be traced unambiguously from the soma to the distal dendrites (Fig. 11A), and calcium responses could be recorded at different distances from the soma.
Figure 11.
Type AII amacrine cells feature calcium dynamics localized to subcellular compartments that can operate in two apparently distinct response modes. A, Confocal image of a GCaMP3-expressing type AII amacrine cell 14 d after infection with AAV2/1-mGluR1-GCaMP3 (left, radial view). The dotted lines (I–III) indicate approximate focal planes at the level of the soma, proximal dendrites, and distal dendrites shown in the two-photon fluorescence images (right, top-down view). Scale bar, 10 μm. B, Fluorescence response of the four labeled regions shown in A (right panels). Responses were evoked with a brief light flash (full-field LED, 458 nm, 125 ms duration, 100 μW/cm2; magenta lines). Also shown is the response during control trials, when no light flash was presented (black). Laser scanning started at trial onset and ended at the conclusion of each trial (5 s duration). Flash and no-flash trials were presented in a random interleaved order and trials were separated by 500 ms. C, Fluorescence responses recorded from the lobular appendages fell into two nonoverlapping groups based on the time to peak of the light-evoked response (inset). Plot shows flash and no-flash responses for recordings in which the fluorescence response peaked early (dotted lines) and late (solid lines). In all cases, the no-flash response (laser stimulation only) was larger than the flash response, in which laser onset was paired with the full-field LED light flash.
Light-evoked fluorescence responses recorded from labeled AII amacrine cells differed distinctly between different subcellular compartments (n = 12). In response to a brief light flash, a small decrease was observed in the soma, a large increase in the lobular appendages, and a small decrease in the distal dendrites (Fig. 11B). Our data agree with an earlier measurement of calcium dynamics in lobular appendages and distal dendrites in a slice preparation (Habermann et al., 2003), with the reported distribution of L-type voltage-gated calcium channels of the AII (Habermann et al., 2003), and with the presence of glycinergic synapses in the lobes of type AII amacrine cells (Xin and Bloomfield, 1999; Wässle et al., 2009). Calcium signals measured in the lobular appendages likely reflect the presynaptic calcium influx that drives synaptic glycine release onto OFF bipolar and OFF-type ganglion cells (Liang and Freed, 2010).
For the first time, we were able to observe two distinct calcium responses in the lobular appendages, which differed in time course and amplitude. In one apparent response mode, the fluorescence response amplitude was high, the response time-to-peak was short (<1.0 s), and the signal returned to baseline with a time constant <2 s (Fig. 11C, dashed lines). In the other, the calcium response recorded in the same dendrite was slower (time to peak, >1.5 s), and for a light flash paired with scan onset showed a dip followed by a slow rise (half-rise time, >1 s) (Fig. 11C, solid lines). In all recordings, GCaMP3-expressing AII cells in a local population shared the same response dynamic. This dynamic switched over time, possibly after changes in the light-adapted state of the retina, which could change from dark-adapted (rod-mediated) signaling to light-adapted (cone-mediated) signaling during experiments. The exact relationship between light adaptation and response mode has not yet been resolved. The function of the two apparent “response modes” and the neuronal mechanism that underlies them are unknown, but can now be studied.
Discussion
We analyzed the properties of GCaMP3 and the feasibility of its application for mapping rodent retinal circuits. Our results demonstrate that GCaMP3 is a powerful tool to faithfully report physiological neural activity (both spiking and graded potentials) in the retina (although quantifying low-level activity is difficult) and to assist in assembling functional circuit diagrams.
GCaMP3 has adequate response amplitude and dynamic range
Our data show that the dynamic response range of GCaMP3 is adequate under natural stimulus conditions (i.e., with light presented to the photoreceptors): fluorescence signals did not saturate even at the highest evoked spike rates. Fast, large fluorescence responses recorded in dendrites integrated to the same total fluorescence change as the slower, smaller responses simultaneously recorded in a connected soma. This shows that calcium dynamics in both compartments remained within the linear response range of the sensor, because a temporary lack of free sensor (caused by too rapid increase in local Ca2+) would locally reduce the integrated fluorescence response.
A match in total fluorescence change in soma and dendrites would not be expected for spatial stimuli that generate differential input across the dendritic arbor of a cell, or for cell types with active (nonlinear) signal processing mechanisms in the dendrites—such as starburst amacrine cells (Hausselt et al., 2007) or direction-selective ganglion cells. Our measurements show that GCaMP3 can be used to detect and study such mechanisms.
GCaMP3 versus OGB: similar kinetics, higher resolution, and greater photostability
We identified many advantages of GCaMP3 over traditional small molecule calcium dyes. Although both produced light-evoked fluorescent responses with comparable amplitude and kinetics, GCaMP3 labeling gave useful cell type specificity and enabled functional imaging at subcellular resolution: GCaMP3 labeled neurites clearly, whereas OGB diffusely labeled neuropil. In addition, GCaMP3 was photostable under repeated illumination, whereas OGB showed profound photobleaching.
Genetic targeting methods can be combined to study identified cell types in parallel
We identified different promoter elements, transfection methods, and viral serotypes to target GCaMP3 expression with a degree of selectivity that ranged from indiscriminant expression [all types within a class (e.g., both rod and cone photoreceptors); all ganglion cell types], via expression in just a subset of types (ON- and not OFF-type bipolar cells), to expression in just a single neuron type among many in its class (AII amacrine cells) (Xin and Bloomfield, 1999). GCaMP3-labeled cells exhibited the cytoplasmic-specific fluorescence characteristic of cells that have not been damaged by overexpression of the sensor protein (Tian et al., 2009). The constructs can be used to produce retinal tissues with predictable and reproducible expression of GCaMP3 in selected neuron types. This is extremely useful for targeted electrophysiology and optical recording of neuronal activity at subcellular or circuit levels, with high temporal and spatial resolution. Preliminary data show that, for two coinjected vectors, expression patterns are additive (see Notes). This “genetic superposition” allows targeting multiple cell classes in the same retina, for example to record calcium dynamics in presynaptic and postsynaptic neurons simultaneously. Ideally, indicators with nonoverlapping spectral bandwidth will be developed in the future to take full advantage of this.
Two-photon fluorescence imaging in a light-sensitive part of the brain
When recording from the retina with optical methods, it is important to take into account that this tissue contains light-sensitive neurons—a caution that does not apply to other brain preparations. Because of the exceptional light sensitivity and signal transduction cascade of the photoreceptors [in the dark-adapted retina, individual photoisomerization events can be detected in the ganglion cell spike response (Barlow et al., 1971)], the scan laser can evoke large responses, even with a high numerical aperture objective and focal plane >150 μm above the photoreceptor layer. Furthermore, the presence of at least one group of melanopsin-containing (intrinsically photosensitive) ganglion cells must be taken into consideration.
In summary, the strength of the laser-evoked response depends on several factors including the light-adapted state of the retina, the ratio of scan area to receptive field area, the distance between the focal plane of the scan laser and the photoreceptors, and the response gain (i.e., the calcium response amplitude per unit intensity change). As such, the scan laser evokes different levels of activation in different cell types and scan configurations. Light adapting the retina with a constant visible light source, or potentially through continuous laser scanning, can help minimize scan artifacts. When experiments permit, using a retinal slice preparation instead of a whole-mount preparation (see Notes) can avoid scan laser artifacts altogether.
GCaMP3 is broadly applicable across experimental paradigms
The properties that we report here for GCaMP3 permit simultaneous optical recording from populations of retinal neurons, both spiking and nonspiking. The sensor is sufficiently sensitive to identify specific ganglion cell types based on their fluorescence morphology and stimulus-evoked responses. In addition to optical measurements, identified cells can be efficiently targeted for anatomical tracing, electrophysiological recording, or single-cell PCR. With GCaMP3, one can study calcium dynamics in dendrites, somas, and axonal arbors, and compare these dynamics between multiple neurons of same or different type, recorded simultaneously at scan rates up to (but not limited to) 60 frames per second (see Notes).
Specific connectivity between cells in a circuit can be resolved through current injection in one cell and simultaneous monitoring of fluorescence responses in surrounding GCaMP3-expressing cells. Coupled neurons so identified can then be targeted for electrophysiological recording (e.g., using dual patch to quantify the connectivity pattern). Finally, GCaMP3 photostability permits stable (time lapse) recording of a labeled structure for multiple hours so that it can be used to test for sustained changes in intracellular calcium concentration that may be associated with adaptive mechanisms such as long-term synaptic potentiation, light adaptation, and contrast gain control. This, together with genetic encodability, permits measurements from the same neurons over extended time periods in vivo [several months (Tian et al., 2009)], which is not feasible with OGB because dye injection permits optical recording over a short time period only (<1 d).
GCaMP3 shows potential for proposing testable hypotheses about the function of particular neuronal populations (Fig. 2). The success of such a paradigm depends on the discriminatory power of the stimulus. It would be expected to work best when identifying characteristics are “discrete” (all-or-none), such as blue-green color opponency (Ekesten et al., 2000), or direction selectivity (Weng et al., 2005)—as demonstrated here (Fig. 10). However, this still leaves unsorted more than a dozen ganglion cell types, most of which are traditionally classified by their dendritic arbor or spatiotemporal receptive fields, and range from large and fast to small and slow, and are much less discrete (Roska and Werblin, 2001; Sun et al., 2002; Kong et al., 2005). Improved cell type-specific expression methods, more subtle optical stimulation paradigms, and large-scale analysis of retinal neuron populations will likely allow annotation of many of these cell types.
Limitations of GCaMP3
An ideal sensor for the optical readout of neural activity would permit unambiguous inference of the time-varying spike (or graded potential) history of a cell from its evolving fluorescence response. Electrophysiological recordings of GCaMP3-expressing cells showed that a change in fluorescence signal always signaled a change in spiking. However, a change in spiking did not always give a detectable change in fluorescence, particularly at low firing rates. Thus, GCaMP3 is most reliable in the suprathreshold stimulus regime [consistent with previous measurements (Tian et al., 2009)]. Ambiguity also exists between expression level and spontaneous spike rate: whether a cell is bright because of high indicator expression level or to high spontaneous activity cannot be known without an electrophysiological measurement, pharmacological manipulation, or proxy for sensor expression level. Because sensor gain varied from cell to cell (even within a functional type), calculating absolute spike rates from the measured fluorescence signal is not possible in principle without additional calibration.
The cell-to-cell variation of GCaMP3 gain and linearity will result in serious problems for population coding studies. Additional experiments are required to determine whether this is attributable to differences in indicator concentration, cell type-dependent indicator properties, or other phenomena. Ratiometric GECIs [such as D3cpV (Wallace et al., 2008), TN-XXL (Mank et al., 2008), and YC3.60 (Lütcke et al., 2010)] may be preferable to single-wavelength indicators such as GCaMP3 for quantifying cellular [Ca2+] and precise levels of neural activity, although in situ calibration is always required. Coexpression or direct fusion of a reference fluorescent protein along with GCaMP3 might aid quantification of neural activity from fluorescent responses.
Long-term overexpression of GECIs can result in altered cell physiology, fluorescent morphology, and Ca2+ handling, even culminating in behavioral changes (Tian et al., 2009). The exact cause of these effects is unknown, but Ca2+ buffering and CaM/M13 interference with endogenous proteins have been implicated (Hasan et al., 2004). Nuclear fluorescence has been shown to be an optical correlate for GCaMP3-induced cytomorbidity (Tian et al., 2009), although mechanistic details are lacking. In our study, retinas were harvested 2–4 weeks after viral transduction. All retinas had apparently healthy cells (Figs. 2–7, 9, 10) with nuclear-excluded fluorescence, but subtle defects from GCaMP3 overexpression cannot be ruled out.
Improved GECIs, more varied promoter and viral tropism variants, and good assays will further facilitate cellular-resolution mapping of the retina and many other circuits in the future.
Notes
Supplemental material for this article is available at http://research.janelia.org/looger/Supp_Borghuis2010/. This material has not been peer reviewed.
Footnotes
This work was supported by the Howard Hughes Medical Institute (B.G.B., L.T., B.Y.Z., and L.L.L.) and the National Institutes of Health (Y.X., S.S.N., and N.V.). Experiments were performed in the laboratory of Anthony Leonardo. Karel Svoboda generously provided the two-photon microscope and advised the project. We thank Vijay Iyer for technical assistance with the imaging system and scan software. OGB-1-AM was a generous gift from Luke Lavis. Thanks to Anthony Leonardo and Vivek Jayaraman for helpful discussion. We thank Amy Hu and Alma Arnold for assistance with histology. All affiliations are Howard Hughes Medical Institute, Janelia Farm. We also thank Jean Bennett and Albert Maguire (University of Pennsylvania) for introducing B.G.B. to the use of viral methods and intravitreal injection into the living mouse eye. All constructs and viruses used in this research are available from the University of Pennsylvania Vector Core (http://www.med.upenn.edu/gtp/vector_core.shtml). All experiments were conducted according to protocols approved by the Institutional Animal Care and Use and Institutional Biosafety Committees of the Howard Hughes Medical Institute, Janelia Farm Research Campus. B.G.B. and L.L.L. designed the research. B.G.B. performed all experiments. L.T. created GCaMP3 constructs. B.V.Z. created AAV vectors and constructed the synthetic mGluR1 promoter. N.V., Y.X., and S.S.N. electroporated retinas and assisted with bipolar cell recordings. B.G.B. and L.L.L. wrote the paper, with input from the other authors.
The authors declare no competing financial interests.
References
- Barlow HB, Levick WR. The mechanism of directionally selective units in rabbit's retina. J Physiol. 1965;178:477–504. doi: 10.1113/jphysiol.1965.sp007638. [DOI] [PMC free article] [PubMed] [Google Scholar]
- Barlow HB, Levick WR, Yoon M. Responses to single quanta of light in retinal ganglion cells of the cat. Vision Res. 1971;1971(Suppl 3):87–101. doi: 10.1016/0042-6989(71)90033-2. [DOI] [PubMed] [Google Scholar]
- Casagrande VA, Xu X, editors. Parallel visual pathways: a comparative perspective. Cambridge, MA: MIT; 2004. [Google Scholar]
- Chichilnisky EJ. A simple white noise analysis of neuronal light responses. Network. 2001;12:199–213. [PubMed] [Google Scholar]
- Demb JB. Cellular mechanisms for direction selectivity in the retina. Neuron. 2007;55:179–186. doi: 10.1016/j.neuron.2007.07.001. [DOI] [PubMed] [Google Scholar]
- Derrington AM, Lennie P. Spatial and temporal contrast sensitivities of neurones in lateral geniculate nucleus of macaque. J Physiol. 1984;357:219–240. doi: 10.1113/jphysiol.1984.sp015498. [DOI] [PMC free article] [PubMed] [Google Scholar]
- Dhingra NK, Kao YH, Sterling P, Smith RG. Contrast threshold of a brisk-transient ganglion cell in vitro. J Neurophysiol. 2003;89:2360–2369. doi: 10.1152/jn.01042.2002. [DOI] [PubMed] [Google Scholar]
- Dreosti E, Odermatt B, Dorostkar MM, Lagnado L. A genetically encoded reporter of synaptic activity in vivo. Nat Methods. 2009;6:883–889. doi: 10.1038/nmeth.1399. [DOI] [PMC free article] [PubMed] [Google Scholar]
- Ekesten B, Gouras P, Yamamoto S. Cone inputs to murine retinal ganglion cells. Vision Res. 2000;40:2573–2577. doi: 10.1016/s0042-6989(00)00122-x. [DOI] [PubMed] [Google Scholar]
- Frishman LJ, Freeman AW, Troy JB, Schweitzer-Tong DE, Enroth-Cugell C. Spatiotemporal frequency responses of cat retinal ganglion cells. J Gen Physiol. 1987;89:599–628. doi: 10.1085/jgp.89.4.599. [DOI] [PMC free article] [PubMed] [Google Scholar]
- Grieger JC, Choi VW, Samulski RJ. Production and characterization of adeno-associated viral vectors. Nat Protoc. 2006;1:1412–1428. doi: 10.1038/nprot.2006.207. [DOI] [PubMed] [Google Scholar]
- Habermann CJ, O'Brien BJ, Wässle H, Protti DA. AII amacrine cells express L-type calcium channels at their output synapses. J Neurosci. 2003;23:6904–6913. doi: 10.1523/JNEUROSCI.23-17-06904.2003. [DOI] [PMC free article] [PubMed] [Google Scholar]
- Hasan MT, Friedrich RW, Euler T, Larkum ME, Giese G, Both M, Duebel J, Waters J, Bujard H, Griesbeck O, Tsien RY, Nagai T, Miyawaki A, Denk W. Functional fluorescent Ca2+ indicator proteins in transgenic mice under TET control. PLoS Biol. 2004;2:e163. doi: 10.1371/journal.pbio.0020163. [DOI] [PMC free article] [PubMed] [Google Scholar]
- Hausselt SE, Euler T, Detwiler PB, Denk W. A dendrite-autonomous mechanism for direction selectivity in retinal starburst amacrine cells. PLoS Biol. 2007;5:e185. doi: 10.1371/journal.pbio.0050185. [DOI] [PMC free article] [PubMed] [Google Scholar]
- Jones KE, Campbell PK, Normann RA. A glass/silicon composite intracortical electrode array. Ann Biomed Eng. 1992;20:423–437. doi: 10.1007/BF02368134. [DOI] [PubMed] [Google Scholar]
- Kim DS, Matsuda T, Cepko CL. A core paired-type and POU homeodomain-containing transcription factor program drives retinal bipolar cell gene expression. J Neurosci. 2008;28:7748–7764. doi: 10.1523/JNEUROSCI.0397-08.2008. [DOI] [PMC free article] [PubMed] [Google Scholar]
- Kong JH, Fish DR, Rockhill RL, Masland RH. Diversity of ganglion cells in the mouse retina: unsupervised morphological classification and its limits. J Comp Neurol. 2005;489:293–310. doi: 10.1002/cne.20631. [DOI] [PubMed] [Google Scholar]
- Liang Z, Freed MA. The ON pathway rectifies the OFF pathway of the mammalian retina. J Neurosci. 2010;30:5533–5543. doi: 10.1523/JNEUROSCI.4733-09.2010. [DOI] [PMC free article] [PubMed] [Google Scholar]
- Lütcke H, Murayama M, Hahn T, Margolis DJ, Astori S, Zum Alten Borgloh SM, Göbel W, Yang Y, Tang W, Kügler S, Sprengel R, Nagai T, Miyawaki A, Larkum ME, Helmchen F, Hasan MT. Optical recording of neuronal activity with a genetically-encoded calcium indicator in anesthetized and freely moving mice. Front Neural Circuits. 2010;4:9. doi: 10.3389/fncir.2010.00009. [DOI] [PMC free article] [PubMed] [Google Scholar]
- Mandell JW, Czernik AJ, De Camilli P, Greengard P, Townes-Anderson E. Differential expression of synapsins I and II among rat retinal synapses. J Neurosci. 1992;12:1736–1749. doi: 10.1523/JNEUROSCI.12-05-01736.1992. [DOI] [PMC free article] [PubMed] [Google Scholar]
- Mank M, Santos AF, Direnberger S, Mrsic-Flogel TD, Hofer SB, Stein V, Hendel T, Reiff DF, Levelt C, Borst A, Bonhoeffer T, Hübener M, Griesbeck O. A genetically encoded calcium indicator for chronic in vivo two-photon imaging. Nat Methods. 2008;5:805–811. doi: 10.1038/nmeth.1243. [DOI] [PMC free article] [PubMed] [Google Scholar]
- Mao T, O'Connor DH, Scheuss V, Nakai J, Svoboda K. Characterization and subcellular targeting of GCaMP-type genetically-encoded calcium indicators. PLoS One. 2008;3:e1796. doi: 10.1371/journal.pone.0001796. [DOI] [PMC free article] [PubMed] [Google Scholar]
- Margolis DJ, Gartland AJ, Euler T, Detwiler PB. Dendritic calcium signaling in ON and OFF mouse retinal ganglion cells. J Neurosci. 2010;30:7127–7138. doi: 10.1523/JNEUROSCI.5694-09.2010. [DOI] [PMC free article] [PubMed] [Google Scholar]
- Masland RH. Neuronal diversity in the retina. Curr Opin Neurobiol. 2001;11:431–436. doi: 10.1016/s0959-4388(00)00230-0. [DOI] [PubMed] [Google Scholar]
- Matsuda T, Cepko CL. Electroporation and RNA interference in the rodent retina in vivo and in vitro. Proc Natl Acad Sci U S A. 2004;101:16–22. doi: 10.1073/pnas.2235688100. [DOI] [PMC free article] [PubMed] [Google Scholar]
- Meister M, Pine J, Baylor DA. Multielectrode recording from the vertebrate retina. Invest Ophthalmol Vis Sci. 1989;30(Suppl):68. [Google Scholar]
- Niwa H, Yamamura K, Miyazaki J. Efficient selection for high-expression transfectants with a novel eukaryotic vector. Gene. 1991;108:193–199. doi: 10.1016/0378-1119(91)90434-d. [DOI] [PubMed] [Google Scholar]
- Ovcharenko I, Nobrega MA, Loots GG, Stubbs L. ECR browser: a tool for visualizing and accessing data from comparisons of multiple vertebrate genomes. Nucleic Acids Res. 2004;32:W280–W286. doi: 10.1093/nar/gkh355. [DOI] [PMC free article] [PubMed] [Google Scholar]
- Oyster CW. The analysis of image motion by the rabbit retina. J Physiol. 1968;199:613–635. doi: 10.1113/jphysiol.1968.sp008671. [DOI] [PMC free article] [PubMed] [Google Scholar]
- Palmer AE, Tsien RY. Measuring calcium signaling using genetically targetable fluorescent indicators. Nat Protoc. 2006;1:1057–1065. doi: 10.1038/nprot.2006.172. [DOI] [PubMed] [Google Scholar]
- Pologruto TA, Sabatini BL, Svoboda K. ScanImage: flexible software for operating laser-scanning microscopes. Biomed Eng Online. 2003;2:13. doi: 10.1186/1475-925X-2-13. [DOI] [PMC free article] [PubMed] [Google Scholar]
- Pologruto TA, Yasuda R, Svoboda K. Monitoring neural activity and [Ca2+] with genetically encoded Ca2+ indicators. J Neurosci. 2004;24:9572–9579. doi: 10.1523/JNEUROSCI.2854-04.2004. [DOI] [PMC free article] [PubMed] [Google Scholar]
- Roska B, Werblin F. Vertical interactions across ten parallel, stacked representations in the mammalian retina. Nature. 2001;410:583–587. doi: 10.1038/35069068. [DOI] [PubMed] [Google Scholar]
- Sun W, Li N, He S. Large-scale morphological survey of mouse retinal ganglion cells. J Comp Neurol. 2002;451:115–126. doi: 10.1002/cne.10323. [DOI] [PubMed] [Google Scholar]
- Tian L, Hires SA, Mao T, Huber D, Chiappe ME, Chalasani SH, Petreanu L, Akerboom J, McKinney SA, Schreiter ER, Bargmann CI, Jayaraman V, Svoboda K, Looger LL. Imaging neural activity in worms, flies and mice with improved GCaMP calcium indicators. Nat Methods. 2009;6:875–881. doi: 10.1038/nmeth.1398. [DOI] [PMC free article] [PubMed] [Google Scholar]
- Wallace DJ, Meyer zum Alten Borgloh S, Astori S, Yang Y, Bausen M, Kügler S, Palmer AE, Tsien RY, Sprengel R, Kerr JN, Denk W, Hasan MT. Single-spike detection in vitro and in vivo with a genetic Ca2+ sensor. Nat Methods. 2008;5:797–804. doi: 10.1038/nmeth.1242. [DOI] [PubMed] [Google Scholar]
- Wang Y, Guo HF, Pologruto TA, Hannan F, Hakker I, Svoboda K, Zhong Y. Stereotyped odor-evoked activity in the mushroom body of Drosophila revealed by green fluorescent protein-based Ca2+ imaging. J Neurosci. 2004;24:6507–6514. doi: 10.1523/JNEUROSCI.3727-03.2004. [DOI] [PMC free article] [PubMed] [Google Scholar]
- Wässle H. Parallel processing in the mammalian retina. Nat Rev Neurosci. 2004;5:747–757. doi: 10.1038/nrn1497. [DOI] [PubMed] [Google Scholar]
- Wässle H, Heinze L, Ivanova E, Majumdar S, Weiss J, Harvey RJ, Haverkamp S. Glycinergic transmission in the mammalian retina. Front Mol Neurosci. 2009;2:6. doi: 10.3389/neuro.02.006.2009. [DOI] [PMC free article] [PubMed] [Google Scholar]
- Weng S, Sun W, He S. Identification of ON-OFF direction-selective ganglion cells in the mouse retina. J Physiol. 2005;562:915–923. doi: 10.1113/jphysiol.2004.076695. [DOI] [PMC free article] [PubMed] [Google Scholar]
- Xin D, Bloomfield SA. Comparison of the responses of AII amacrine cells in the dark- and light-adapted rabbit retina. Vis Neurosci. 1999;16:653–665. doi: 10.1017/s0952523899164058. [DOI] [PubMed] [Google Scholar]
- Yasuda R, Nimchinsky EA, Scheuss V, Pologruto TA, Oertner TG, Sabatini BL, Svoboda K. Imaging calcium concentration dynamics in small neuronal compartments. Sci STKE. 2004;2004:pl5. doi: 10.1126/stke.2192004pl5. [DOI] [PubMed] [Google Scholar]


