

Abstract
Wrapping of the myelin sheath around axons by oligodendrocytes is critical for the rapid conduction of electrical signals required for the normal functioning of the CNS. Myelination is a multistep process where oligodendrocytes progress through a well coordinated differentiation program regulated by multiple extracellular growth and differentiation signals. The intracellular transduction of the extracellular signals that regulate myelination is poorly understood. Here we demonstrate a critical role for two important signaling molecules, extracelluar signal-regulated protein kinases 1 and 2 (ERK1/ERK2), downstream mediators of mitogen-activated protein kinases, in the control of CNS myelin thickness. We generated and analyzed two lines of mice lacking both ERK1/ERK2 function specifically in oligodendrocyte-lineage cells. In the absence of ERK1/ERK2 signaling NG2+ oligodendrocyte progenitor cells proliferated and differentiated on schedule. Mutant oligodendrocytes also ensheathed axons normally and made a few wraps of compact myelin. However, the subsequent increase in myelination that correlated myelin thickness in proportion to the axon caliber failed to occur. Furthermore, although the numbers of differentiated oligodendrocytes in the adult mutants were unchanged, they showed an inability to upregulate the transcription of major myelin genes that normally occurs during active myelination. Similarly, in vitro ERK1/ERK2-deficient oligodendrocytes differentiated normally but failed to form typical myelin-like membrane sheets. None of these effects were observed in single ERK1 or ERK2 mutants. These studies suggest that the predominant role of ERK1/ERK2 signaling in vivo is in promoting rapid myelin growth to increase its thickness, subsequent to oligodendrocyte differentiation and the initiation of myelination.
Introduction
Myelination is a multistep process involving the proliferation of oligodendrocyte progenitor cells (OPCs), timely differentiation into postmitotic oligodendrocytes, ensheathment of axons, initiation of myelin wrapping, and finally expansion of myelin sheath during the peak of myelination (Baumann and Pham-Dinh, 2001; Miller, 2002; Emery, 2010). While many regulators of the early stages of oligodendrocyte development have been identified, the specific signals that control the later phase of myelin growth to increase its thickness remain largely obscure. Understanding this mechanism is clinically relevant since it is unclear why the myelin that is formed during remyelination in multiple sclerosis is thinner than normal (Ludwin and Maitland, 1984; Franklin, 2002).
Previous studies have implicated the phosphatidylinositol-3-phosphate kinase (PI3K)/Akt pathway in the regulation of myelin thickness. Transgenic mice with overactivation of this pathway display increased myelin thickness (Flores et al., 2008; Goebbels et al., 2010; Harrington et al., 2010). Conversely, inhibition of mTOR, a downstream target of PI3K/Akt, results in attenuation of this increase (Narayanan et al., 2009). Furthermore overexpression of insulin-like growth factor-1 (IGF-1) or Neuregulin-1 type III in transgenic mice also results in increased myelin thickness (Carson et al., 1993; Zeger et al., 2007; Brinkmann et al., 2008). While these growth factors activate the PI3K/Akt pathway they also activate the ERK1/ERK2-mitogen-activated protein kinase (MAPK) pathway (Rubinfeld and Seger, 2005). Recently, we observed reduced myelin thickness in mice lacking fibroblast growth factor (FGF) receptor-1 and -2 signaling in oligodendrocytes, which was accompanied by reduced activation of ERK1/ERK2, suggesting a strong correlation between ERK/MAPK activation and myelin thickness (Furusho et al., 2012). Moreover, pharmacological inactivation of ERK1/ERK2 in cultured oligodendrocytes results in attenuated extension of oligodendrocyte processes (Stariha et al., 1997; Younes-Rapozo et al., 2009; Furusho et al., 2012). These studies raise the possibility that ERK1/ERK2 signaling has a distinct function in mature oligodendrocytes and myelination in vivo, in addition to its role in early events of oligodendrocyte development, including OPC survival, migration, proliferation, and differentiation as suggested by in vitro studies (Bhat and Zhang, 1996; Baron et al., 2000; Yim et al., 2001; Bansal et al., 2003; Fortin et al., 2005; Cui and Almazan, 2007; Frost et al., 2009; Van't Veer et al., 2009; Younes-Rapozo et al., 2009; Fyffe-Maricich et al., 2011; Guardiola-Diaz et al., 2012).
Since the expression of ERK1 and ERK2 overlaps in mature oligodendrocytes, it is unlikely that single gene deletions will fully reveal the hypothesized function of ERK1/ERK2 signaling in myelination (Fyffe-Maricich et al., 2011). We, therefore, generated and analyzed two mouse mutant lines lacking both ERK1 and ERK2 from OPCs and oligodendrocytes by conditionally ablating floxed-Erk2 in an Erk1-null background following Cre-mediated recombination in either 2′-3′-cyclic nucleotide 3′-phosphodiesterase (CNP+) or NG2+ cells. We found that in the absence of ERK1/ERK2 signaling, OPCs were able to withdraw from the cell cycle, differentiate, and initiate myelination normally, but failed to increase myelin thickness in proportion to axon caliber in the spinal cord. This was associated with an inability of mature oligodendrocytes to upregulate the key myelin genes. We propose that ERK1/ERK2 function as late-stage regulators of CNS myelination and that the control of myelin thickness is independent of oligodendrocyte development and initiation of myelin wrapping.
Materials and Methods
Generation of Erk1/Erk2 double knock-out mice.
The Erk1−/− mice were originally generated by Dr. P. Gilles and Dr. J. Pouyssegur (Centre National de la Recherche Scientifique, Nice, France) and Erk2flox/flox mice by Dr. S. Hedrick (University of California, San Diego, La Jolla, CA), which were bred to generate Erk1−/−, Erk2flox/flox transgenic mice by Dr. J. Richards (Baylor College of Medicine, Houston, TX). We crossed Erk1−/−, Erk2flox/flox transgenic mice with CNPCre/+ (Lappe-Siefke et al., 2003) mice to produce progeny in which Erk2 was conditionally disrupted in CNP-expressing OPCs and oligodendrocyte in an Erk1-null background. To confirm findings from the Erk1−/−,Erk2flox/flox; CNPCre/+ line related to OPC proliferation and differentiation, we also generated a second line of conditional double knock-out (dKO) mice by mating Erk1−/−, Erk2flox/flox mice generated by Dr. Gary Landreth (Case Western Reserve University, Cleveland, OH) with NG2Cre/+ mice (The Jackson Laboratory; Zhu et al., 2008a,b) to produce progeny in which disruption of Erk1/Erk2 genes occurs in NG2-expressing OPCs even earlier in the lineage than in the CNP-Cre line. To identify the deletion of the Erk1 allele, the following primers were used: 5′-CCA ATC TGC TTA TCA ACA CCA CCT GC-3′, 5′-ACA TGG GAA ACT CTC CTA CCT TG-3′, and 5′-CCG CTT CCA TTG CTC AGC GG-3′. To detect the Erk2 floxed allele the following primers were used: 5′-ACA CAG TAT GAG TCT CAT TCC-3′ and 5′-GAA CTT ACT ATG CAC ATC AGG-3′. To detect deletion of floxed region of Erk2, the following primers were used: 5′-GAA CTT ACT ATG CAC ATC AGG-3′ and 5′-TAG CAG GTG GAT ATC TAA GC-3′. Loss of ERK1/ERK2 protein was further confirmed by immunohistochemistry and immunoblotting of spinal cords (data not shown).
Mutant and control mice of either sex were analyzed from the same litters, facilitating comparisons among the genotypes. In addition to Erk1/Erk2 dKO mice, other genotypes, including Erk1 or Erk2 single knock-out mice, were also obtained in the crosses. Initially, all genotypes were analyzed. However, since none of the genotypes (data not shown) except the Erk1/Erk2 dKO showed a phenotype, the other genotypes were grouped as “controls.” In the figures we have mostly shown Erk1+/−,Erk2flox/flox;CNP+/+ and Erk1+/−,Erk2flox/flox;NG2+/+ as controls. The Erk1−/−,Erk2flox/flox; CNPCre/+ and Erk1−/−,Erk2flox/flox;NG2Cre/+ will be referred to here as “Erk1/Erk2-CNPCre” and “Erk1/Erk2-NG2Cre,” respectively.
Erk1/Erk2-CNPCre dKO mice of either sex displayed a progressive loss of coordination starting around the second postnatal week but remain generally healthy. Erk1/Erk2-NG2Cre dKO mice of either sex rarely survived past postnatal day 13 (P13), while Erk1/Erk2-CNPCre dKO mice lived longer but rarely past the third postnatal week. We do not know what accounts for the earlier death of the Erk1/Erk2-NG2Cre dKO mice. One possibility is that since NG2-Cre is also expressed in the vasculature throughout the brain as well as in NG2-expressing cells in other tissues (Zhu et al., 2008a,b), loss of Erk1/Erk2 in nonglial cells might potentially affect the viability of these mice. The early mortality of the Erk1/Erk2-CNPCre dKO line may be due to peripheral nervous system defects, which are severely hypomyelinated (Newbern et al., 2011; A.I., R.B., unpublished observations).
Immunolabeling.
As described previously (Kaga et al., 2006) cryostat transverse sections (15 μm) of cervical spinal cord were cut following overnight fixation in 4% paraformaldehyde (PFA)/PBS and overnight cryoprotection in 20% sucrose/PBS. For myelin basic protein (MBP) immunolabeling sections were delipidated with 100% ethanol for 10 min; washed with PBS (three times, 10 min); blocked (1 h) in 10% normal goat serum (Invitrogen), 5% BSA, and 0.1% fish gelatin; and incubated overnight (4°C) in polyclonal anti-MBP (1:3000; Dr. E. Barbarese, University of Connecticut), and monoclonal anti-Neurofilament-M (NF-M; 1:200, Millipore Bioscience Research Reagents). Sections were incubated (1 h) with secondary antibodies conjugated to Alexa 488 (1:500; Invitrogen) or Cy3 (1:500; Jackson ImmunoResearch) and nuclei were counterstained with Hoechst blue dye 3342 (1 μg/ml; Sigma). To identify proliferating cells, spinal cord sections were subjected to antigen retrieval by 5 min incubation at 95°C in citrate buffer, pH 6.0, and 10 min on the bench, washed with PBS and double-immunolabeled with anti-Ki67 (1:250; BD PharMingen) and anti-Olig2 (1:100; Immuno-Biological Laboratories).
Spinal cord cultures were immunolabeled, as described previously (Furusho et al., 2012; Guardiola-Diaz et al., 2012) with marker antibodies of total oligodendrocyte-lineage cells O4 (1:25; Bansal et al., 1992) or anti-Olig2 (1:50; Immuno-Biological Laboratories), markers of immature oligodendrocyte O1 [1:25; anti-galactocerebroside (GalC)] or HPC7 (1:25) (Baas and Barnstable, 1998) (HPC7 antibody labels immature oligodendrocytes similar to O1, Guardiola-Diaz et al., 2012), and marker of mature oligodendrocyte anti-MBP (1:100; Sternberger Monoclonal).
In situ hybridization.
Transverse sections of cervical spinal cord and sagittal sections of hindbrain were prepared as described above and in situ hybridization was performed as previously described (Kaga et al., 2006) using riboprobes specific for proteolipid protein (PLP) mRNA (Dr. W.B. Macklin, University of Colorado School of Medicine, Aurora, CO) and MBP mRNA (Dr. M. Qiu, University of Louisville, KY). Briefly, after incubation in 1 μg/ml proteinase K at 37°C for 30 min sections were hybridized overnight at 65°C with digoxigenin-(DIG)-labeled antisense cRNA probe and washed in 50% formamide, 2× SSC, and 1% SDS at 65°C for 2–3 h followed by rinses in 2× SSC, 0.2× SSC at room temperature, and 0.1× SSC at 60°C. After blocking in 1% Tween 20 and 1% normal goat serum (1 h), sections were incubated (2 h) in alkaline phosphatase-conjugated-anti-DIG antibody (1:5000; Roche Diagnostics). Color was developed with 4-nitroblue olium chloride, 5-bromo-4-chloro-3-indolylphosphate and nuclei counterstained with Hoechst blue dye 3342.
Electron microscopy.
For ultrastructural analyses, dKO and littermate control mice of either sex were perfused with 4% PFA, 2% glutaraldehyde in 0.1 m cacodylate buffer, pH 7.4 (Electron Microscopy Sciences). Cervical spinal cords and cerebellum were postfixed in 1% OsO4. Samples were dehydrated through graded ethanol, stained en bloc with uranyl acetate, and embedded in a Poly/Bed812 resin (Polysciences). Thin (1 μm) sections were stained with toluidine blue and ultrathin (0.1 μm) sections from matching areas of experimental and control tissue blocks were cut and visualized using an electron microscope (JEOL1200CX) at 80 kV. Between 100 and 400 axons were measured per genotype from matched regions of the ventral spinal cord or cerebellar peduncles. Statistical analysis was performed using the Student's t test.
Cell culture.
Dissociated cultures of spinal cords, including the cervical and thoracic regions, were prepared individually from Erk1/Erk2-CNPCre and littermate control pups of either sex at P2. After removing meninges, the spinal cords were chopped with a blade, transferred to 1.5 ml tubes, trypsinized (0.025%) for 30 min at 37°C, gently triturated, and plated at a density of 50,000/cm2 on polylysine-d-coated 4-well dishes (50 mg/ml; Sigma-Aldrich) in 4% fetal calf serum (FCS)/DMEM. After 17 h, the medium was changed to defined media [DMEM with100 μg/ml transferrin, 5.2 ng/ml sodium selenium, 5 μg/ml insulin, 8.8 μg/ml putrescine, 6 ng/ml progesterone, 10 IU/ml penicillin and 100 μg/ml streptomycin (all ingredients from Sigma)] plus 0.5% FCS and cells were grown for up to 13 d with half-medium changes every 2–3 d.
Explant cultures of spinal cords were prepared from individual Erk1/Erk2-NG2Cre and littermate control mice of either sex at P2. After meninges were removed, spinal cords were chopped finely with a scalpel and passed through a 500 μm nylon mesh filter. The small clusters of cells (<500 μm) that passed through the filter were spun down at 1500 rpm for 2 min, resuspended in 500 μl DMEM:F12 + 10% FCS, and plated on coverslips (50 μl). After incubation for 1.5 h, 450 μl of NbActiv4 culture media (BrainBits) was added to each well. Half-media was changed every 3 d. The coverslips were harvested at 4 d in vitro (DIV).
Quantification of oligodendrocyte membrane and white matter area of the spinal cords.
Individual dissociated cultures of six Erk1/Erk2-CNPCre dKO and seven littermate control pups of either sex were prepared from two separate litters and immunolabeled with anti-MBP to mark mature oligodendrocyte as described above. A total of 100–150 MBP+ oligodendrocytes were measured from 8 to 14 fields of view (10× magnification) from three representative cultures each of control and mutant mice. Before the measurement of oligodendrocyte membrane area by Photoshop CS4, the optional plug-in “PHSPCS4_Cont_LS1” was installed and the scale of each magnification was set. The MBP-stained oligodendrocytes were selected by Quick selection tool and applied to area measurement.
For the measurement of white matter area of spinal cords, images from matched sections of spinal cord from control and mutant mice were captured and the lateral ventral regions of the MBP-stained white matter regions were selected by quick selection tool and the area was measured as above.
Quantitative real-time PCR.
Total RNA was extracted using the TRIzol reagent (Invitrogen) from spinal cords. One microgram total RNA was reverse transcribed to cDNA using the iScript Synthesis Kit (Bio-Rad) according to the manufacturer's instructions. Quantitative real-time PCR (qRT-PCR) was performed using an Eppendorf Master Cycler ep realplex Thermal Cycler and the iQ SYBR Green Supermix (Bio-Rad) according to the manufacturer's instructions. The following primers were used: PLP forward primer, 5′-GTATAGGCAGTCTCTGCGCTGAT-3′; PLP reverse primer, 5′-AAGTGGCAGCAATCATGAAGG-3′; MBP forward primer, 5′-TACCTGGCCACAGCAAGTAC-3′; MBP reverse primer, 5′-GTCACAATGTTCTTGAAG-3′; glyceraldehyde-3-phosphate dehydrogenase (GAPDH) forward primer, 5′-TGTGTCCGTCGTGGATCTG-3′; and GAPDH reverse primer, 5′-CATGTAGGCCATGAGGTCCACCAC-3′. qRT-PCR conditions were as follows: denaturation at 95°C, 30 s; primer annealing at 55.5°C, 30 s; and elongation at 72°C, 40 s. Quantification of PCR products was performed using the 2-ΔΔCt method. Quantities of mRNA were normalized to the housekeeping gene GAPDH.
Immunoblotting.
Immunoblotting was performed as described previously (Fortin et al., 2005). Briefly, equal amounts of total proteins from spinal cord homogenates were loaded by SDS-PAGE, transferred to polyvinylidene fluoride membrane, and immunolabeled for PLP (1:1000; M. Lees, Eunice Kennedy Shriver Center, Waltham, MA) and β-actin (1:5000; Sigma) as a loading control.
Results
Myelin sheath thickness is reduced in Erk1/Erk2 dKO mutants
To determine the effect of Erk1/Erk2 disruption on CNS myelination, cervical spinal cord sections from control and Erk1/Erk2-CNPCre dKO mice at P14 and P30 were immunolabeled for the myelin marker MBP and the axonal marker NF-M (Fig. 1A). The MBP-labeled ventrolateral white matter area was measured and found to be significantly diminished in the Erk1/Erk2-CNPCre dKO mice compared with littermate controls at both ages (Fig. 1A). Similar reduction in white matter area was observed at P11/P13 in the Erk1/Erk2-NG2Cre dKO (control = 0.64 ± 0.04 mm2; mutant = 0.46 ± 0.08 mm2, *p < 0.05, N = 3–4). Moreover, a striking reduction of MBP expression was observed at P30 and high-magnification images showed less MBP+ myelin around NF-M+ axons (Fig. 1A). To further examine the ultrastructure of myelinated tracks, the spinal cords of Erk1/Erk2-CNPCre dKO and littermate controls were analyzed at P16 and P28/P30 by electron microscopy (EM). The micrographs showed that the thickness of myelin was reduced in the mutants compared with controls (Fig. 1B). Morphometric quantification of myelin thickness by g-ratio analysis (ratio of individual axon diameters to myelinated fiber diameters) from the ventral cervical spinal cord confirmed a relative reduction in myelin thickness (higher g-ratios, pink circles) in the Erk1/Erk2-CNPCre mice compared with littermate controls at both ages (Fig. 1C). At P16 the difference in g-ratios was less pronounced in axons of smaller diameter (<1 μm, p = 8.9 × 10⁻³) than larger diameter (>1 μm, p = 4.9 × 10⁻¹⁶). But by P28/P30 both small diameter (<1 μm, p = 6.6 × 10⁻¹⁴) and larger diameter (>1 μm, p = 7.3 × 10−39) axons began to display significant differences in g-ratios suggesting that fibers of all diameters were affected. Similarly, when myelin thickness (μm) was plotted as a function of axon diameter (Fig. 1D) it showed that while in the controls, the myelin thickness increases in proportion with axon diameter as expected; in the dKOs axons of all diameters were wrapped by thin myelin sheaths of similar thickness (0.14 ± 0.05 μm, approximately equivalent to 12 compact myelin lamellae, Fig. 1B). Importantly, since the ultrastructure and periodicity of compact myelin in the dKO mice were indistinguishable from those of controls (Figure 1B, bottom), we conclude that the reduced myelin thickness is a result of fewer myelin wraps.
Figure 1.
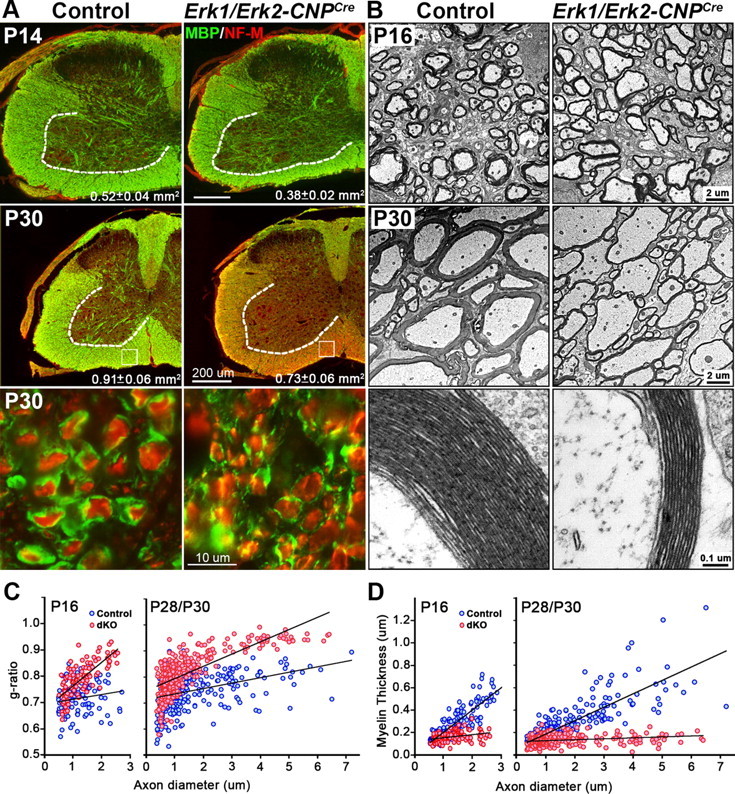
Myelin sheath thickness is reduced in Erk1/Erk2 dKO. A, Transverse sections of cervical spinal cord from Erk1/Erk2-CNPCre dKO and littermate control mice immunolabeled for MBP (green) and NF-M (red) at P14 and P30 show that the area of the ventrolateral white matter is significantly decreased in dKO compared with littermate control at both ages (P14: control = 0.52 ± 0.04 mm2, dKO = 0.38 ± 0.02 mm2, **p < 0.01, N = 3; P30: control = 0.91 ± 0.06 mm2, dKO = 0.73 ± 0.06 mm2, *p < 0.05, SEM, N = 3–4). High-magnification images (bottom) of P30 spinal cord show less MBP+ myelin around axons in the dKO. Scale bars: 200 and 10 μm. B, EM micrographs of ventral spinal cords at P16 and P30 show that dKO axons are wrapped by thinner layers of myelin, compared with littermate controls. High-magnification images show that the periodicity of myelin is normal in the dKOs. Scale bars: 2 and 0.1 μm. C, Quantification of g-ratios of individual fibers in relation to respective axon diameters (presented as scatter plots) at P16 and P28/P30 show decreased myelin thickness in Erk1/Erk2 dKO (pink circles) compared with littermate controls (blue circles). D, Quantification presented as myelin thickness (μm) in relation to respective axon diameters shows that in the controls myelin thickness increases in parallel to axon diameter but in the dKO axons of all diameters are wrapped by myelin of similar thickness, which is disproportionately thinner than normal. Approximately 100–400 axons each were measured from two controls and two dKOs at P16 and two controls and two dKOs pooled from P28 and P30.
Proliferation and numbers of OPCs are not affected when ERK1/ERK2 are ablated from NG2+ CNP+ OPCs in vivo
To determine whether the observed hypomyelination in the Erk1/Erk2 dKO arose as a result of defects in proliferation or survival of OPCs, spinal cords from P0 Erk1/Erk2-NG2Cre and Erk1/Erk2-CNPCre dKO and their littermate controls were examined by double labeling with the OPC marker, Olig2, and the proliferation marker, Ki67 (Fig. 2A). The percentage of proliferating OPCs (Ki67+/Olig2+) and the total numbers of Olig2+ cells were similar between mutant and control animals in both lines of Erk1/Erk2-dKOs, suggesting that the loss of ERK1/ERK2 signaling in NG2+ or CNP+ cells does not affect OPC proliferation or survival.
Figure 2.
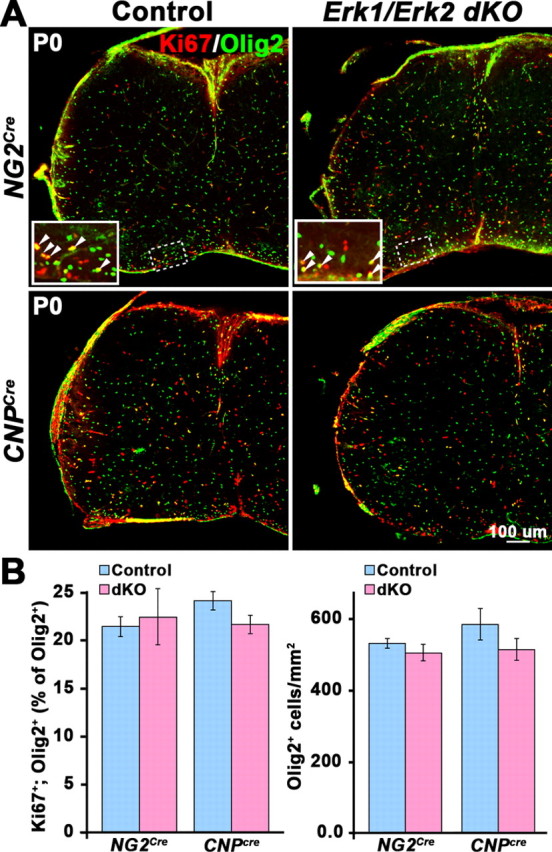
Proliferation and numbers of OPCs are not affected in Erk1/Erk2 dKO. A, Transverse sections of P0 cervical spinal cord from Erk1/Erk2-NG2Cre or Erk1/Erk2-CNPCre and littermate control mice were immunolabeled for Olig2 (green) and Ki67 (red) to identify proliferating OPCs. Inset, The enlarged view of the boxed region shows double-labeled cells (yellow). B, The total numbers of Olig2+;Ki67+ double-labeled cells (expressed as a percentage of Olig2+ cells) and the density of Olig2 cells in the whole spinal cord sections of Erk1/Erk2-NG2Cre or Erk1/Erk2-CNPCre mice did not differ from that of littermate controls. Scale bar, 100 μm. Three sections each from three mice of each genotype were analyzed. Error bars indicate SEM, N = 3.
Lack of ERK1/ERK2 signaling does not affect oligodendrocyte differentiation or initiation of myelination
To examine whether loss of Erk1/Erk2 in NG2+ OPCs affected the extent or onset of oligodendrocyte differentiation, the numbers of PLP mRNA+ cells that identify mature oligodendrocytes were analyzed in the spinal cords of Erk1/Erk2-NG2Cre and their littermate controls at P0 and P1 (Fig. 3A). There was no statistically significant difference in the total numbers of differentiated oligodendrocytes that appeared in the spinal cords of the mutants at P0 (Fig. 3A; control = 54.2 ± 4.1, dKO = 48.8 ± 5.2, SEM p = 0.43, N = 3) or at P1 (control = 69.3 ± 14.8; dKO = 63.3 ± 11.7, SD, N = 2). This suggests that the loss of ERK1/ERK2 signaling at the NG2+ stage of OPC maturation does not adversely affect oligodendrocyte differentiation in the spinal cord in vivo.
Figure 3.
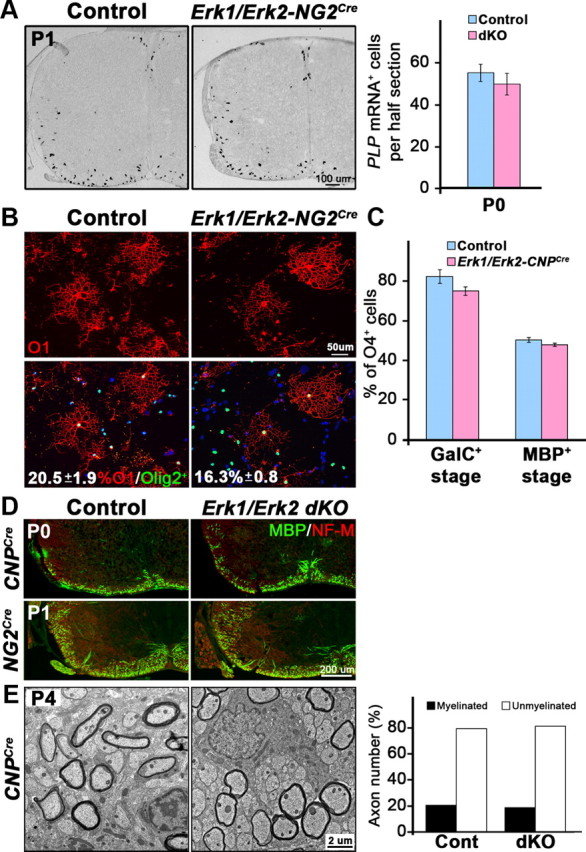
Differentiation of oligodendrocytes and the initiation of myelination are not affected in Erk1/Erk2 dKO. A, Transverse sections of P0 and P1 cervical spinal cord from Erk1/Erk2-NG2Cre and control mice were analyzed by in situ hybridization for PLP mRNA to mark differentiated oligodendrocytes. Quantification of PLP+ oligodendrocytes in half-sections of P0 spinal cord shows no difference in their numbers. Three sections each from three mice of each genotype were analyzed. Error bars indicate SEM, N = 3. Representative images of PLP mRNA+ oligodendrocytes at P1 are shown. Scale bar, 100 μm. B, Explant cultures initiated from individual spinal cords of P2 Erk1/Erk2-NG2Cre and control mice, double-immunolabeled for immature oligodendrocyte marker O1 (red) and total oligodendrocyte-lineage cell marker Olig2 (green) at 4 DIC, show that the percentage of O1+/Olig2+ oligodendrocytes in the mutants are not significantly different from the controls (control = 20.5 ± 1.9; dKO = 16.3 ± 0.8, SEM, p = 0.05, N = 3 animals per genotype). C, Dissociated cultures initiated from individual spinal cords of P2 Erk1/Erk2-CNPCre mutant and littermate controls were double-immunolabeled at 5 DIC with O4, marker of immature oligodendrocytes (HPC7 antibody which labels GalC+ or O1+ stage), and MBP, marker of mature oligodendrocytes. The percentage of total oligodendrocyte-lineage cells (O4+) that differentiated into oligodendrocytes (at both stages of maturation), are comparable in mutant and control cultures. Error bars indicate SEM (p = 0.16; N = 3 animals per genotype). D, Transverse sections of spinal cords from P0 Erk1/Erk2-CNPCre, P1 Erk1/Erk2-NG2Cre dKOs, and littermate controls double-immunolabeled for MBP (green) and NF-M (red) show similar patterns of MBP-immunolabeled myelinated fibers, indicating similar onset of MBP expression and myelin biogenesis in the dKOs. Representative images out of 3–8 controls and 3–5 dKOs are shown. E, Representative EM images of ventral spinal cords out of three Erk1/Erk2-CNPCre dKO and three control mice at P4 show a similar pattern of axonal ensheathment by thin myelin sheaths. Quantification from ∼1000 axons from four 3000× EM images of each genotype show similar percentages of myelinated or unmyelinated axons in the Erk1/Erk2-CNPCre dKOs and littermate controls, together indicating normal onset of axonal ensheathment and initiation of myelin wrapping in dKOs.
Differentiation of OPCs was also analyzed in explant (Fig. 3B) and dissociated cultures (Fig. 3C) initiated from spinal cords of newborn Erk1/Erk2-NG2Cre (Fig. 3B) and Erk1/Erk2-CNPCre (Fig. 3C) mice, respectively. The sequential differentiation of NG2+/O4+ late progenitors into immature and then mature stages of oligodendrocyte is defined by the expression of GalC (O1+, HPC7+ cells) and MBP, respectively (Pfeiffer et al., 1993; Guardiola-Diaz et al., 2012). We therefore double-labeled cells for O1/Olig2 in explant cultures and HPC7/O4 or MBP/O4 in dissociated cultures (O1 and HPC7 antibodies colabel immature oligodendrocytes; Guardiola-Diaz et al., 2012). In explant cultures, similar percentages of oligodendrocyte-lineage cells (Olig2+) differentiated into immature oligodendrocytes (O1+) by 4 d in cell culture (DIC; Fig. 3B). Similarly, in dissociated cultures, Erk1/Erk2-CNPCre dKO oligodendrocytes developed normally and by 5 DIC extended a network of processes (see Fig. 6a–d). Quantification of the numbers of immature (HPC7+) and mature oligodendrocytes (MBP+) as a percentage of total oligodendrocyte-lineage cells (O4+) showed no change between control and Erk1/Erk2-CNPCre dKO at 5 DIC (Fig. 3C). These data suggest that the onset and progression of OPC differentiation occurred normally in cultures of mouse spinal cords from both lines of Erk1/Erk2 dKO mice, consistent with our in vivo studies. It seems likely that multiple intracellular signaling pathways contribute to the regulation of oligodendrocyte development and their relative contribution depends on temporal and environmental cues. For example, in previous studies inhibition of ERK1/ERK2 in isolated Olig2+ rat brain OPCs using a pharmacological inhibitor reduced the appearance of O4+ and O1+ cells in culture (Guardiola-Diaz et al., 2012). Several factors may account for this difference. Signals from other neural cells in the culture, absent from the OPC preparation, may stimulate compensatory pathways. Alternatively, deletion of ERK1/ERK2 early in the OPC lineage in the setting of the intact CNS enhances the dependence on alternative signaling pathways that subsequently persist following cell culture.
Figure 6.

Membrane formation by oligodendrocytes in vitro is inhibited in Erk1/Erk2 dKO. Dissociated primary culture from individual spinal cords of P2 controls (n = 6) and Erk1/Erk2-CNPCre (n = 7) pups were grown in duplicate in defined media and analyzed at 5, 8, and 13 DIC by immunolabeling for MBP (red) and for the nuclear stain Hoechst (green) to examine the morphology of differentiated oligodendrocytes. Initially, at 5 DIC control (a,c) and dKO oligodendrocytes (b,d) form similar process networks. At 13 DIC, while the control oligodendrocytes have extended large membrane sheaths (e,g), the majority of dKO oligodendrocytes are unable to make membranes but remain viable as evident by the noncondensed nucleus of these cells (f,h, arrowheads). For quantification of the size of the membranes, a total of 100–150 oligodendrocytes from three independent representative cultures of each genotype were measured at each time point (8 and 13 DIC) (i). To count the numbers of oligodendrocytes that made membrane sheaths, 200–300 MBP+ oligodendrocytes were examined from three independent control and three dKO cultures each (j). Note that membranes made by mutant oligodendrocytes are significantly smaller than controls and fewer mutant MBP+ oligodendrocytes make membrane sheaths compared with control oligodendrocytes. Arrowheads point to the cell bodies of the oligodendrocytes. Scale bar, 50 μm. Error bars indicate SEM. *p < 0.05, **p < 0.01, N = 3.
We next asked whether the initiation of myelin formation was affected by the lack of Erk1/Erk2. In the mouse spinal cord, few axonal fibers are first myelinated in the ventrolateral spinal cord around the time of birth and then gradually increase in numbers with age. Thus, the onset of myelin formation can be examined at early postnatal ages by immune-labeling myelin segments for MBP expression. We therefore immune-labeled matched sections of P0 and P1 spinal cords from Erk1/Erk2-CNPCre and Erk1/Erk2-NG2Cre mice, respectively, with anti-MBP and NF-M (Fig. 3D). We observed a similar staining pattern of MBP+ myelinated fibers in the controls and dKOs, suggesting that the onset of myelin formation was unaltered in both lines of dKOs. This was confirmed by EM analysis of ventral spinal cords at P4, which showed a similar pattern of axonal ensheathment by thin myelin sheaths and similar percentages of myelinated or unmyelinated axons in the Erk1/Erk2-CNPCre dKOs and littermate controls (Fig. 3E).
Together, we conclude that the terminal differentiation of NG2+ OPCs into oligodendrocytes, the onset of axonal ensheathment, and initiation of myelin wrapping occurred normally in the spinal cords of Erk1/Erk2 dKOs.
The levels of PLP mRNA and MBP mRNA, but not the numbers of oligodendrocytes, are reduced in Erk1/Erk2 dKO
We next examined the expression of PLP and MBP mRNA by in situ hybridization at P14 and P30 in the spinal cords of Erk1/Erk2-CNPCre and littermate control mice (Fig. 4). While the total number of oligodendrocytes (PLP mRNA+ cells) remained the same in controls and dKOs, the intensity of PLP mRNA signal was markedly reduced in the mutant oligodendrocytes suggesting a decrease in the amount of mRNA expressed per oligodendrocyte (Fig. 4A). The levels of PLP protein were also reduced in the dKO compared with controls (Fig. 4B). Further, the MBP mRNA signal intensity showed a dramatic reduction in both the Erk1/Erk2-CNPCre and Erk1/Erk2-NG2Cre mice compared with their littermate controls (Fig. 4C). Quantification of mRNA levels by qRT-PCR showed a significant reduction in the expression of both PLP and MBP transcripts in the mutant spinal cords compared with controls (Fig. 4D) substantiating the in situ hybridization analysis.
Figure 4.
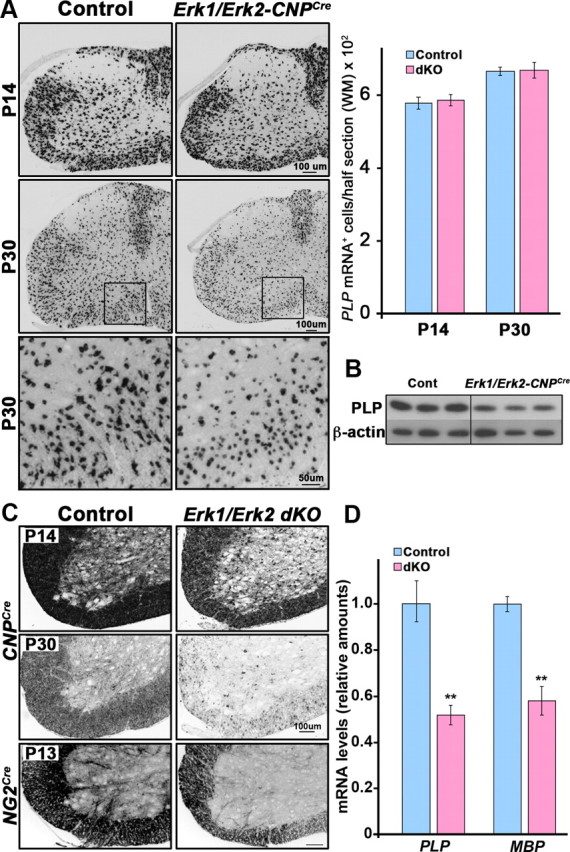
The levels of PLP mRNA and MBP mRNA, but not the numbers of oligodendrocytes, are reduced in Erk1/Erk2 dKO. Transverse sections of P14 and P30 cervical spinal cords from control and Erk1/Erk2-CNPCre dKO mice were analyzed by in situ hybridization for PLP (A) or MBP (C) mRNA expression. A, Quantification of total numbers of PLP mRNA+ oligodendrocytes in the lateral ventral white matter (WM) from half-sections of the spinal cords shows no difference in the numbers of oligodendrocytes between control and dKO at either of the ages. The PLP mRNA signal intensity per oligodendrocyte is, however, reduced in dKO compared with controls (boxed areas of P30 are shown at higher magnifications in the bottom). Three sections each from three mice of each genotype at each age were analyzed. Error bars indicate SEM, N = 3. Scale bars: 100 and 50 μm. B, Immunoblot analysis of P20 cervical spinal cord homogenates (0.5 μg total protein per lane) from three mice of each genotype shows a decrease in the levels of PLP protein in the Erk1/Erk2-CNPCre dKO compared with controls. β-Actin is shown as a loading control. C, The expression of MBP mRNA is reduced in Erk1/Erk2-CNPCre dKOs compared with controls at P14 and is almost completely abolished from the fibers by P30 but remains in oligodendrocyte cell bodies in dKO. Representative images are shown from three Erk1/Erk2-CNPCre dKOs and 4–5 controls for each group. Expression of MBP mRNA is also reduced in Erk1/Erk2-NG2Cre dKO compared with littermate controls. D, Quantification of mRNA levels by qRT-PCR shows a significant reduction in the expression of PLP and MBP transcripts in the P20 mutant spinal cords compared with controls. Error bars indicate SEM. **p < 0.01, N = 3–6.
To investigate whether ablation of Erk1/2 also affected other regions of the CNS, we analyzed the expression of MBP and PLP mRNA in the cerebellum and brainstem of the P30 Erk1/Erk2-CNPCre mice and littermate controls (Fig. 5A,B). As observed in the spinal cord, the intensity of MBP and PLP mRNA expression was reduced in these regions of the mutant CNS compared with controls. Along with the reduced expression of major myelin gene in oligodendrocytes, EM analysis (g-ratios) showed that myelin thickness of all diameter axons was significantly reduced in the cerebellum of P30 Erk1/Erk2-CNPCre mutant mice compared with controls (Fig. 5C,D), indicating that the effect of ERK1/ERK2 signaling on myelin gene expression and myelin assembly is more generalized and not just specific to the spinal cord.
Figure 5.
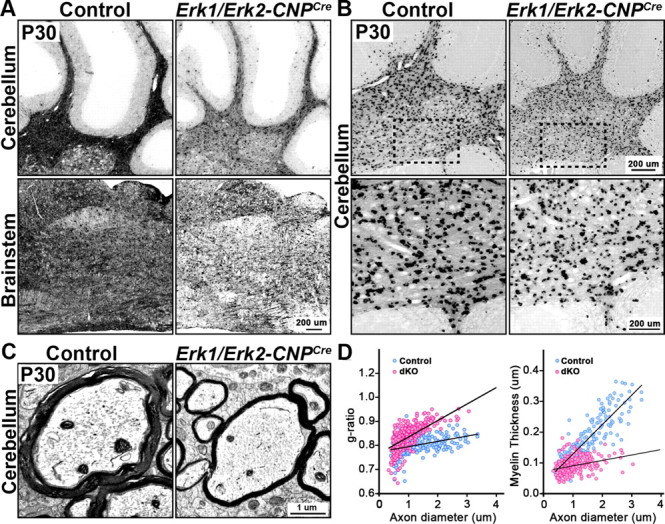
Reduction in myelin gene expression and myelin sheath thickness occurs in other regions of the CNS of Erk1/Erk2 dKOs. A, B, Sagittal sections of P30 hindbrain from Erk1/Erk2-CNPCre dKO and littermate control mice, analyzed by in situ hybridization for the expression of MBP mRNA (A) and PLP mRNA (B), show that MBP mRNA signal intensity is reduced in the cerebellum and brainstem of the mutants compared with controls (A). Similarly, the level of PLP mRNA expression by oligodendrocytes is reduced in the cerebellum of the mutants compared with controls (B). Bottom (B) shows higher magnification images of the boxed area. Scale bars: 200 μm. Multiple sections from two mice of each genotype were analyzed and representative images from matched sections are shown. C, EM micrographs of cerebellar peduncles at P30 show that dKO axons are wrapped by thinner myelin sheaths, compared with littermate controls. Scale bar, 1 μm. D, Scatter plots of g-ratios and myelin thickness (μm) measurements of 200–400 axons from two mice of each genotype at P30 show statistically significant decrease in myelin thickness in the cerebellum of Erk1/Erk2-CNPCre dKO (pink circles) compared with littermate controls (blue circles) (average g-ratio, p = 0.5 × 10⁻¹³).
Together, we conclude that the reduction in myelin thickness in Erk1/Erk2 dKO is not caused by reduction in the numbers of OPCs or oligodendrocytes but by a reduction in the myelinogenic potential of each oligodendrocyte to produce myelin, suggested by the reduced transcription of major myelin genes by mutant oligodendrocytes.
Formation of myelin-like-membranes by mature oligodendrocytes is attenuated in cultures of Erk1/Erk2 dKO spinal cords
Maturation of oligodendrocytes in dissociated cultures of spinal cords is characterized first by the expression of MBP and the formation of a complex network of processes that are spread evenly around the oligodendrocyte cell body (Fig. 6 a,c), similar to that commonly observed in cultures of purified rat brain mature oligodendrocytes (Guardiola-Diaz et al., 2012, Fig. 1). This stage is followed by the elaboration of extensive myelin-like-membranes, from a cell body on one side (Fig. 6e,g), a stage of maturation which is rarely achieved by isolated rat brain oligodendrocytes. Therefore, as a correlate to reduced myelin membrane extension observed in vivo, we examined the effect of Erk1/Erk2 disruption on myelin-like-membrane formation by oligodendrocytes in dissociated primary cultures initiated from spinal cords of newborn Erk1/Erk2-CNPCre and littermate control mice (Fig. 6). We found that by 5 DIC mutant oligodendrocytes acquired MBP expression and formed a network of processes like controls, suggesting that the initial stages of oligodendrocyte maturation are not affected by the genetic loss of ERK1/ERK2 (Fig. 3B,C, Fig. 6a–d). This is consistent with our previous study where pharmacological inhibition of ERK1/ERK2 signaling in isolated rat brain oligodendrocyte cultures also showed no affect on the maturation of O1+ oligodendrocytes to the MBP+ stage [Guardiola-Diaz et al., (2012), Fig. 3; note that since isolated rat oligodendrocytes in culture do not attain an equivalent maturation state as spinal cord oligodendrocytes in dissociated cultures or myelinating oligodendrocytes in vivo, the Guardiola-Diaz et al., (2012) study was not able to address the role of ERK1/ERK2 in myelin membrane growth].
Spinal cord cultures examined from the control and dKOs at later time points showed that by 8 DIC control MBP+ oligodendrocytes started to elaborate membranes; however, the dKO oligodendrocytes were unable to either make membranes or made membranes of smaller size compared with controls (Fig. 6i, 8 DIC). At 13 DIV the difference between dKO and controls persisted and became even more pronounced (Fig. 6e–j), suggesting that as in vivo the reduction in membrane formation by mutant oligodendrocytes was not due to a delay in the maturation of oligodendrocytes. At all time points examined, the cultures remained viable, as normal noncondensed nuclei were visible in the cell bodies of MBP-labeled oligodendrocytes in both control and mutant cultures (Fig. 6a–h). We conclude that ERK1/ERK2 is not critical for the differentiation and initiation of oligodendrocyte process extension, but is essential for subsequent elaboration of myelin-like membranes.
Discussion
Previous in vitro and Erk2 single-knock-out studies have implicated ERK/MAPK signaling in oligodendrocyte development. Unexpectedly, we found that ERK1/ERK2 signaling in OPCs becomes dispensable for their proliferation and differentiation in the postnatal CNS once they reach the NG2+ stage of maturation. However, these studies have revealed a novel function of ERK1/ERK2 as a key late-stage regulator of myelination. Specifically, mice lacking ERK1/ERK2 generated normal numbers of oligodendrocytes, which initiated myelination on schedule. However, they failed to upregulate key myelin proteins and increase myelin sheath thickness, thus genetically uncoupling initiation of myelination from the later phase of continued myelination in proportion to axon diameter.
During the active phase of myelination there is a dramatic increase in the myelinogenic potential of each oligodendrocyte characterized by a significant upregulation in the levels of major myelin proteins, lipids, and cytoskeletal elements, perhaps to drive rapid myelin biogenesis during this period. Several in vitro and in vivo studies have demonstrated a correlation between the levels of major myelin proteins and the extent of myelination (Yang and Skoff, 1997). For example, in transgenic shiverer mice, increased MBP gene dosage results in an increase in myelination (Popko et al., 1987; Shine et al., 1992) and in PLP chimeric mice, PLP-positive oligodendrocytes show a distinct advantage in myelinating axons over PLP-negative oligodendrocytes (Yool et al., 2001). Further, a role for axons in modulating the expression of myelin genes was suggested by studies showing a significant elevation of MBP and PLP mRNA when oligodendrocytes were cultured with spinal cord neurons (Macklin et al., 1986) and, conversely, reduced expression after axonal transection (Kidd et al., 1990; Scherer et al., 1992). The present study showing that Erk1 /Erk2-deficient oligodendrocytes failed to sufficiently upregulate the key myelin genes as normally occurs during active myelination (Jordan et al., 1989) suggests that ERK1/ERK2 activation transduces signals for this upregulation. It is possible that ERK1/ERK2 in oligodendrocytes may synergize with other signals to increase the overall strength of the basal signal above a certain threshold, driving the postinitiation burst of myelin biogenesis and radial growth of the sheath.
A correlation between myelin thickness and axonal diameter has been observed in adult animals, and it is believed that axon caliber is a critical determinant of myelination and myelin thickness (Hildebrand and Hahn 1978; Hildebrand et al., 1993). In this study we found that Erk1/Erk2-deficient oligodendrocytes wrapped axons of all diameters equally, but with only a few wraps of compact myelin of similar thickness (∼0.1 μm). At P16, this thickness was sufficient to reach a correct myelin thickness to axon caliber ratio for the smallest diameter axons (<1 μm) but not for axons of diameters >1 μm. By P30 axons of all diameters in the dKO displayed disproportionately thinner myelin sheaths. This suggests that a basal level of initial myelin wrapping of similar thickness occurs in an ERK1/ERK2-independent manner. It may be that this initial wrapping reflects a “default” mechanism (Rosenberg et al., 2007, 2008; Barres, 2008) or one regulated by other signaling molecules. However, subsequent to this initial myelination, assembly of additional myelin lamellae around axons of all diameters requires ERK1/ERK2 activation to reach a correct myelin thickness to axon caliber relationship. Whether global axonal signals, axon caliber-specific signals, or astrocytic signals induce this ERK1/ERK2 activation remains to be established.
ERK1/ERK2 is a point of convergence of multiple external signals (Rubinfeld and Seger, 2005), most notably of several growth factors expressed by neurons and astrocytes. In vitro studies have shown that growth factors including Neuregulin-1, platelet-derived growth factor, IGF-1, brain-derived neurotrophic factor (BDNF), NT3, and FGF-2 activate ERK1/ERK2 in the oligodendrocyte-lineage cells and therefore can potentially stimulate myelination upstream of ERK1/ERK2 in vivo (Bhat and Zhang, 1996; Kumar et al., 1998; Bansal et al., 2003; Cui and Almazan, 2007; Frederick et al., 2007; Van't Veer et al., 2009). However, the role of Neuregulin-1 type III in the regulation of CNS myelination is controversial (Roy et al., 2007; Brinkmann et al., 2008; Taveggia et al., 2008) and knock-out mice of other growth factors, such as IGF-1, NT3, and BDNF, have defects in OPC proliferation and differentiation, suggesting that the effects on myelination could be secondary to their effects on oligodendrocyte development (Cellerino et al., 1997; Kahn et al., 1999; Zeger et al., 2007; Vondran et al., 2010). Interestingly, the phenotype of the FGF receptor-1 and -2 conditional dKO mice most closely mimics that of the Erk1/Erk2 dKOs, both showing an arrest of myelin growth uniquely at a postinitiation late stage of myelination (Furusho et al., 2012). This suggests that FGF-receptor signaling is at least one of the potential upstream activators of ERKs.
Recent genetic gain-of-function studies have strongly implicated PI3K/Akt/mTOR pathway as an important regulator of myelin growth, since forced activation of this pathway resulted in extensive hypermyelination without affecting oligodendrocyte proliferation, survival, or differentiation (Flores et al., 2008; Goebbels et al., 2010; Harrington et al., 2010). Since our genetic loss-of-function studies here have revealed a critical role for ERK1/ERK2 MAPK pathway also in the control of myelin thickness, and since constitutive activation of Mek, upstream of ERK1/ERK2, in cultured oligodendrocytes was shown to increase MBP expression (Du et al., 2006), it is clear that signaling via both pathways is involved in this important regulation. Whether they operate independently, controlling different downstream targets and transcription factors, or are interconnected converging on similar targets remains to be determined.
Our studies show that OPC proliferation and differentiation occurred normally and on schedule in the postnatal spinal cord of both the Erk1/Erk2-NG2Cre and Erk1/Erk2-CNPCre dKOs. This was unexpected since ERK1/ERK2 are major downstream targets of several growth factors that induce OPC proliferation in vitro and in some cases, also in vivo (Canoll et al., 1996; Kumar et al., 1998; Fruttiger et al., 1999; Baron et al., 2000; Cui and Almazan, 2007; Zeger et al., 2007; Van't Veer et al., 2009). There are at least two possible explanations for these results. First, other signaling molecules could compensate for the loss of Erks in our mutant mice. For example, in vitro studies show that IGF-1-mediated OPC proliferation requires both ERK and Akt activity (Cui and Almazan, 2007). Second, the requirement of ERK1/ERK2 for proliferation may be at a stage earlier than the NG2+ stage of the oligodendrocyte lineage (since Erk1/Erk2 deletion in our study occurs in NG2+ or CNP+ cells). This is consistent with the observations that when Erk1/Erk2 was deleted embryonically in the neural epithelial cells using NestinCre (Imamura et al., 2010) or Olig2Cre (Newbern et al., 2011) in the brain or spinal cord, respectively, decreased proliferation of uncommitted neuroepithelial cells and OPCs was observed.
The normal onset of oligodendrocyte differentiation observed in Erk1/Erk2-double mutants is also surprising in light of the transient delay in oligodendrocyte differentiation observed in the corpus callosum of Erk2-single mutants (Fyffe-Maricich et al., 2011), a finding which predicted that Erk1/Erk2-double mutants would have a more dramatic effect on oligodendrocyte differentiation. Furthermore, deletion of B-Raf, upstream of ERK1/ERK2, using NestinCre also showed delayed oligodendrocyte differentiation (Galabova-Kovacs et al., 2008). It is possible that since in both cases the inactivation of ERK activity was initiated in uncommitted neural precursor cells that give rise to OPCs, astrocytes, and neurons, ERK inactivation from all these cell types may account for the observed effect. It is also possible that as seen for proliferation (above), combined signaling by both ERK1 and ERK2 is significant for neuroepithelial cells and for very early stages of OPC maturation, but becomes less important, perhaps due to compensation by other differentiation signals, once the OPCs have reached the NG2+ stage of maturation.
Our interpretation that reduced myelin thickness is not caused by a decrease or delay in the differentiation of oligodendrocytes but by a defect in myelin outgrowth is consistent with our in vitro data, showing that mutant oligodendrocytes in the spinal cord cultures differentiated normally on schedule, acquired the expression of O1 and MBP, and even extended a network of processes, but then either failed to form myelin-like membrane sheets or made sheets of smaller size. It is important to note that although this observation was made in axon-free dissociated cultures, it does not rule out the potential involvement of an extrinsic axonal signal for membrane formation. This is because in culture the extrinsic signals such as growth factors and extracellular-matrix (ECM) or cell-adhesion molecules could be supplied by astrocytes, fibroblasts, or oligodendrocytes (e.g., FGF, IGF-1, ECM), or by the culture media (e.g., IGF-1). While in vivo the same signals could be supplied by axons (e.g., FGF, ECM, IGF-1 etc).
In conclusion, we have identified ERK1/ERK2 signaling as an important regulator of myelin-sheath thickness in the CNS. Collectively, these data support a model in which extracellular signals, possibly from axons, activate ERK1/ERK2 in oligodendrocytes to directly or indirectly target a cohort of genes in myelinating oligodendrocytes that work together to upregulate the major myelin/cytoskeletal proteins above a basal level to promote the assembly and continued wrapping of the myelin sheath, thus increasing myelin thickness. In the future, it will be important to define the upstream and downstream effectors of ERK1/ERK2 and to understand the interplay between ERK1/ERK2 and other signaling networks in the integration of biosynthetic and cytoskeletal pathways that are pivotal for proper CNS myelination.
Footnotes
This work was supported by National Institutes of Health Grants NS38878 and NS41078 (R.B.), in part by grants from the National Multiple Sclerosis Society (N.M.S.S.) RG 4087-A-3 (R.B.), and by postdoctoral fellowship from NMSS (S.L.F-M.). and NS30800 (R.H.M.).We thank Dr. D.J. Richards (Baylor College of Medicine, Houston, TX) and Dr. Gary Landreth (Case Western Reserve University, OH) for providing the Erk1−/−;Erk2 floxed mice and Dr. K. Nave (Max Plank Institute, Gottingen, Germany) for the CNP-Cre mice and Dr. A. Nishiyama (University of Connecticut) for the NG2-Cre mice. We would also like to thank G. Wark and M. Karl for helping with immunostaining and J. Krasno for EM sample preparation.
References
- Baas D, Barnstable CJ. HPC-7: A novel oligodendrocyte lineage protein, which appears prior to galactocerebroside. Glia. 1998;23:169–179. [PubMed] [Google Scholar]
- Bansal R, Magge S, Winkler S. Specific inhibitor of FGF receptor signaling: FGF-2-mediated effects on proliferation, differentiation, and MAPK activation are inhibited by PD173074 in oligodendrocyte-lineage cells. J Neurosci Res. 2003;74:486–493. doi: 10.1002/jnr.10773. [DOI] [PubMed] [Google Scholar]
- Bansal R, Stefansson K, Pfeiffer SE. Proligodendroblast antigen (POA), a developmental antigen expressed by A007/O4-positive oligodendrocyte progenitors prior to the appearance of sulfatide and galactocerebroside. J Neurochem. 1992;58:2221–2229. doi: 10.1111/j.1471-4159.1992.tb10967.x. [DOI] [PubMed] [Google Scholar]
- Baron W, Metz B, Bansal R, Hoekstra D, de Vries H. PDGF and FGF-2 signaling in oligodendrocyte progenitor cells: regulation of proliferation and differentiation by multiple intracellular signaling pathways. Mol Cell Neurosci. 2000;15:314–329. doi: 10.1006/mcne.1999.0827. [DOI] [PubMed] [Google Scholar]
- Barres BA. The mystery and magic of glia: a perspective on their roles in health and disease. Neuron. 2008;60:430–440. doi: 10.1016/j.neuron.2008.10.013. [DOI] [PubMed] [Google Scholar]
- Baumann N, Pham-Dinh D. Biology of oligodendrocyte and myelin in the mammalian central nervous system. Physiol Rev. 2001;81:871–927. doi: 10.1152/physrev.2001.81.2.871. [DOI] [PubMed] [Google Scholar]
- Bhat NR, Zhang P. Activation of mitogen-activated protein kinases in oligodendrocytes. J Neurochem. 1996;66:1986–1994. doi: 10.1046/j.1471-4159.1996.66051986.x. [DOI] [PubMed] [Google Scholar]
- Brinkmann BG, Agarwal A, Sereda MW, Garratt AN, Müller T, Wende H, Stassart RM, Nawaz S, Humml C, Velanac V, Radyushkin K, Goebbels S, Fischer TM, Franklin RJ, Lai C, Ehrenreich H, Birchmeier C, Schwab MH, Nave KA. Neuregulin-1/ErbB signaling serves distinct functions in myelination of the peripheral and central nervous system. Neuron. 2008;59:581–595. doi: 10.1016/j.neuron.2008.06.028. [DOI] [PMC free article] [PubMed] [Google Scholar]
- Canoll PD, Musacchio JM, Hardy R, Reynolds R, Marchionni MA, Salzer JL. GGF/neuregulin is a neuronal signal that promotes the proliferation and survival and inhibits the differentiation of oligodendrocyte progenitors. Neuron. 1996;17:229–243. doi: 10.1016/s0896-6273(00)80155-5. [DOI] [PubMed] [Google Scholar]
- Carson MJ, Behringer RR, Brinster RL, McMorris FA. Insulin-like growth factor I increases brain growth and central nervous system myelination in transgenic mice. Neuron. 1993;10:729–740. doi: 10.1016/0896-6273(93)90173-o. [DOI] [PubMed] [Google Scholar]
- Cellerino A, Carroll P, Thoenen H, Barde YA. Reduced size of retinal ganglion cell axons and hypomyelination in mice lacking brain-derived neurotrophic factor. Mol Cell Neurosci. 1997;9:397–408. doi: 10.1006/mcne.1997.0641. [DOI] [PubMed] [Google Scholar]
- Cui QL, Almazan G. IGF-I-induced oligodendrocyte progenitor proliferation requires PI3K/Akt, MEK/ERK, and Src-like tyrosine kinases. J Neurochem. 2007;100:1480–1493. doi: 10.1111/j.1471-4159.2006.04329.x. [DOI] [PubMed] [Google Scholar]
- Du Y, Lercher LD, Zhou R, Dreyfus CF. Mitogen-activated protein kinase pathway mediates effects of brain-derived neurotrophic factor on differentiation of basal forebrain oligodendrocytes. J Neurosci Res. 2006;84:1692–1702. doi: 10.1002/jnr.21080. [DOI] [PubMed] [Google Scholar]
- Emery B. Regulation of oligodendrocyte differentiation and myelination. Science. 2010;330:779–782. doi: 10.1126/science.1190927. [DOI] [PubMed] [Google Scholar]
- Flores AI, Narayanan SP, Morse EN, Shick HE, Yin X, Kidd G, Avila RL, Kirschner DA, Macklin WB. Constitutively active Akt induces enhanced myelination in the CNS. J Neurosci. 2008;28:7174–7183. doi: 10.1523/JNEUROSCI.0150-08.2008. [DOI] [PMC free article] [PubMed] [Google Scholar]
- Fortin D, Rom E, Sun H, Yayon A, Bansal R. Distinct fibroblast growth factor (FGF)/FGF receptor signaling pairs initiate diverse cellular responses in the oligodendrocyte lineage. J Neurosci. 2005;25:7470–7479. doi: 10.1523/JNEUROSCI.2120-05.2005. [DOI] [PMC free article] [PubMed] [Google Scholar]
- Franklin RJ. Why does remyelination fail in multiple sclerosis? Nat Rev Neurosci. 2002;3:705–714. doi: 10.1038/nrn917. [DOI] [PubMed] [Google Scholar]
- Frederick TJ, Min J, Altieri SC, Mitchell NE, Wood TL. Synergistic induction of cyclin D1 in oligodendrocyte progenitor cells by IGF-I and FGF-2 requires differential stimulation of multiple signaling pathways. Glia. 2007;55:1011–1022. doi: 10.1002/glia.20520. [DOI] [PubMed] [Google Scholar]
- Frost EE, Zhou Z, Krasnesky K, Armstrong RC. Initiation of oligodendrocyte progenitor cell migration by a PDGF-A activated extracellular regulated kinase (ERK) signaling pathway. Neurochem Res. 2009;34:169–181. doi: 10.1007/s11064-008-9748-z. [DOI] [PMC free article] [PubMed] [Google Scholar]
- Fruttiger M, Karlsson L, Hall AC, Abramsson A, Calver AR, Boström H, Willetts K, Bertold CH, Heath JK, Betsholtz C, Richardson WD. Defective oligodendrocyte development and severe hypomyelination in PDGF-A knockout mice. Development. 1999;126:457–467. doi: 10.1242/dev.126.3.457. [DOI] [PubMed] [Google Scholar]
- Furusho M, Dupree JL, Nave K-A, Bansal R. Fibroblast growth factor receptor signaling in oligodendrocytes regulates myelin sheath thickness. J Neurosci, 2012;32:6631–6641. doi: 10.1523/JNEUROSCI.6005-11.2012. [DOI] [PMC free article] [PubMed] [Google Scholar]
- Fyffe-Maricich SL, Karlo JC, Landreth GE, Miller RH. The ERK2 mitogen activated protein kinase regulates the timing of oligodendrocyte differentiation. J Neurosci. 2011;31:843–850. doi: 10.1523/JNEUROSCI.3239-10.2011. [DOI] [PMC free article] [PubMed] [Google Scholar]
- Galabova-Kovacs G, Catalanotti F, Matzen D, Reyes GX, Zezula J, Herbst R, Silva A, Walter I, Baccarini M. Essential role of B-Raf in oligodendrocyte maturation and myelination during postnatal central nervous system development. J Cell Biol. 2008;180:947–955. doi: 10.1083/jcb.200709069. [DOI] [PMC free article] [PubMed] [Google Scholar]
- Goebbels S, Oltrogge JH, Kemper R, Heilmann I, Bormuth I, Wolfer S, Wichert SP, Möbius W, Liu X, Lappe-Siefke C, Rossner MJ, Groszer M, Suter U, Frahm J, Boretius S, Nave KA. Elevated phosphatidylinositol 3,4,5-trisphosphate in glia triggers cell-autonomous membrane wrapping and myelination. J Neurosci. 2010;30:8953–8964. doi: 10.1523/JNEUROSCI.0219-10.2010. [DOI] [PMC free article] [PubMed] [Google Scholar]
- Guardiola-Diaz HM, Ishii A, Bansal R. Erk1/2 MAPK and mTOR signaling sequentially regulates progression through distinct stages of oligodendrocyte differentiation. Glia. 2012;60:476–486. doi: 10.1002/glia.22281. [DOI] [PMC free article] [PubMed] [Google Scholar]
- Harrington EP, Zhao C, Fancy SP, Kaing S, Franklin RJ, Rowitch DH. Oligodendrocyte PTEN is required for myelin and axonal integrity, not remyelination. Ann Neurol. 2010;68:703–716. doi: 10.1002/ana.22090. [DOI] [PMC free article] [PubMed] [Google Scholar]
- Hildebrand C, Hahn R. Relation between myelin sheath thickness and axon size in spinal cord white matter of some vertebrate species. J Neurol Sci. 1978;38:421–434. doi: 10.1016/0022-510x(78)90147-8. [DOI] [PubMed] [Google Scholar]
- Hildebrand C, Remahl S, Persson H, Bjartmar C. Myelinated nerve fibres in the CNS. Prog Neurobiol. 1993;40:319–384. doi: 10.1016/0301-0082(93)90015-k. [DOI] [PubMed] [Google Scholar]
- Imamura O, Pagès G, Pouyséegur J, Endo S, Takishima K. ERK1 and ERK2 are required for radial glial maintenance and cortical lamination. Genes Cells. 2010;15:1072–1088. doi: 10.1111/j.1365-2443.2010.01444.x. [DOI] [PubMed] [Google Scholar]
- Jordan C, Friedrich V, Jr, Dubois–Dalcq M. In situ hybridization analysis of myelin gene transcripts in developing mouse spinal cord. J Neurosci. 1989;9:248–257. doi: 10.1523/JNEUROSCI.09-01-00248.1989. [DOI] [PMC free article] [PubMed] [Google Scholar]
- Kaga Y, Shoemaker WJ, Furusho M, Bryant M, Rosenbluth J, Pfeiffer SE, Oh L, Rasband M, Lappe-Siefke C, Yu K, Ornitz DM, Nave KA, Bansal R. Mice with conditional inactivation of fibroblast growth factor receptor-2 signaling in oligodendrocytes have normal myelin but display dramatic hyperactivity when combined with Cnp1 inactivation. J Neurosci. 2006;26:12339–12350. doi: 10.1523/JNEUROSCI.3573-06.2006. [DOI] [PMC free article] [PubMed] [Google Scholar]
- Kahn MA, Kumar S, Liebl D, Chang R, Parada LF, De Vellis J. Mice lacking NT-3, and its receptor TrkC, exhibit profound deficiencies in CNS glial cells. Glia. 1999;26:153–165. [PubMed] [Google Scholar]
- Kidd GJ, Hauer PE, Trapp BD. Axons modulate myelin protein messenger RNA levels during central nervous system myelination in vivo. J Neurosci Res. 1990;26:409–418. doi: 10.1002/jnr.490260403. [DOI] [PubMed] [Google Scholar]
- Kumar S, Kahn MA, Dinh L, de Vellis J. NT-3-mediated TrkC receptor activation promotes proliferation and cell survival of rodent progenitor oligodendrocyte cells in vitro and in vivo. J Neurosci Res. 1998;54:754–765. doi: 10.1002/(SICI)1097-4547(19981215)54:6<754::AID-JNR3>3.0.CO;2-K. [DOI] [PubMed] [Google Scholar]
- Lappe-Siefke C, Goebbels S, Gravel M, Nicksch E, Lee J, Braun PE, Griffiths IR, Nave KA. Disruption of Cnp1 uncouples oligodendroglial functions in axonal support and myelination. Nat Genet. 2003;33:366–374. doi: 10.1038/ng1095. [DOI] [PubMed] [Google Scholar]
- Ludwin SK, Maitland M. Long-term remyelination fails to reconstitute normal thickness of central myelin sheaths. J Neurol Sci. 1984;64:193–198. doi: 10.1016/0022-510x(84)90037-6. [DOI] [PubMed] [Google Scholar]
- Macklin WB, Weill CL, Deininger PL. Expression of myelin proteolipid and basic protein mRNAs in cultured cells. J Neurosci Res. 1986;16:203–217. doi: 10.1002/jnr.490160118. [DOI] [PubMed] [Google Scholar]
- Miller RH. Regulation of oligodendrocyte development in the vertebrate CNS. Prog Neurobiol. 2002;67:451–467. doi: 10.1016/s0301-0082(02)00058-8. [DOI] [PubMed] [Google Scholar]
- Narayanan SP, Flores AI, Wang F, Macklin WB. Akt signals through the mammalian target of rapamycin pathway to regulate CNS myelination. J Neurosci. 2009;29:6860–6870. doi: 10.1523/JNEUROSCI.0232-09.2009. [DOI] [PMC free article] [PubMed] [Google Scholar]
- Newbern JM, Li X, Shoemaker SE, Zhou J, Zhong J, Wu Y, Bonder D, Hollenback S, Coppola G, Geschwind DH, Landreth GE, Snider WD. Specific functions for ERK/MAPK signaling during PNS development. Neuron. 2011;69:91–105. doi: 10.1016/j.neuron.2010.12.003. [DOI] [PMC free article] [PubMed] [Google Scholar]
- Pfeiffer SE, Warrington AE, Bansal R. The oligodendrocyte and its many cellular processes. Trends Cell Biol. 1993;3:191–197. doi: 10.1016/0962-8924(93)90213-k. [DOI] [PubMed] [Google Scholar]
- Popko B, Puckett C, Lai E, Shine HD, Readhead C, Takahashi N, Hunt SW, 3rd, Sidman RL, Hood L. Myelin deficient mice: expression of myelin basic protein and generation of mice with varying levels of myelin. Cell. 1987;48:713–721. doi: 10.1016/0092-8674(87)90249-2. [DOI] [PubMed] [Google Scholar]
- Rosenberg SS, Powell BL, Chan JR. Receiving mixed signals: uncoupling oligodendrocyte differentiation and myelination. Cell Mol Life Sci. 2007;64:3059–3068. doi: 10.1007/s00018-007-7265-x. [DOI] [PMC free article] [PubMed] [Google Scholar]
- Rosenberg SS, Kelland EE, Tokar E, De la Torre AR, Chan JR. The geometric and spatial constraints of the microenvironment induce oligodendrocyte differentiation. Proc Natl Acad Sci U S A. 2008;105:14662–14667. doi: 10.1073/pnas.0805640105. [DOI] [PMC free article] [PubMed] [Google Scholar]
- Roy K, Murtie JC, El-Khodor BF, Edgar N, Sardi SP, Hooks BM, Benoit-Marand M, Chen C, Moore H, O'Donnell P, Brunner D, Corfas G. Loss of erbB signaling in oligodendrocytes alters myelin and dopaminergic function, a potential mechanism for neuropsychiatric disorders. Proc Natl Acad Sci U S A. 2007;104:8131–8136. doi: 10.1073/pnas.0702157104. [DOI] [PMC free article] [PubMed] [Google Scholar]
- Rubinfeld H, Seger R. The ERK cascade: a prototype of MAPK signaling. Mol Biotechnol. 2005;31:151–174. doi: 10.1385/MB:31:2:151. [DOI] [PubMed] [Google Scholar]
- Scherer SS, Vogelbacker HH, Kamholz J. Axons modulate the expression of proteolipid protein in the CNS. J Neurosci Res. 1992;32:138–148. doi: 10.1002/jnr.490320203. [DOI] [PubMed] [Google Scholar]
- Shine HD, Readhead C, Popko B, Hood L, Sidman RL. Morphometric analysis of normal, mutant, and transgenic CNS: correlation of myelin basic protein expression to myelinogenesis. J Neurochem. 1992;58:342–349. doi: 10.1111/j.1471-4159.1992.tb09316.x. [DOI] [PubMed] [Google Scholar]
- Stariha RL, Kikuchi S, Siow YL, Pelech SL, Kim M, Kim SU. Role of extracellular signal-regulated protein kinases 1 and 2 in oligodendroglial process extension. J Neurochem. 1997;68:945–953. doi: 10.1046/j.1471-4159.1997.68030945.x. [DOI] [PubMed] [Google Scholar]
- Taveggia C, Thaker P, Petrylak A, Caporaso GL, Toews A, Falls DL, Einheber S, Salzer JL. Type III neuregulin-1 promotes oligodendrocyte myelination. Glia. 2008;56:284–293. doi: 10.1002/glia.20612. [DOI] [PubMed] [Google Scholar]
- Van't Veer A, Du Y, Fischer TZ, Boetig DR, Wood MR, Dreyfus CF. Brain-derived neurotrophic factor effects on oligodendrocyte progenitors of the basal forebrain are mediated through trkB and the MAP kinase pathway. J Neurosci Res. 2009;87:69–78. doi: 10.1002/jnr.21841. [DOI] [PMC free article] [PubMed] [Google Scholar]
- Vondran MW, Clinton-Luke P, Honeywell JZ, Dreyfus CF. BDNF+/- mice exhibit deficits in oligodendrocyte lineage cells of the basal forebrain. Glia. 2010;58:848–856. doi: 10.1002/glia.20969. [DOI] [PMC free article] [PubMed] [Google Scholar]
- Yang X, Skoff RP. Proteolipid protein regulates the survival and differentiation of oligodendrocytes. J Neurosci. 1997;17:2056–2070. doi: 10.1523/JNEUROSCI.17-06-02056.1997. [DOI] [PMC free article] [PubMed] [Google Scholar]
- Yim SH, Hammer JA, Quarles RH. Differences in signal transduction pathways by which platelet-derived and fibroblast growth factors activate extracellular signalregulated kinase in differentiating oligodendrocytes. J Neurochem. 2001;76:1925–1934. doi: 10.1046/j.1471-4159.2001.00199.x. [DOI] [PubMed] [Google Scholar]
- Yool DA, Klugmann M, McLaughlin M, Vouyiouklis DA, Dimou L, Barrie JA, McCulloch MC, Nave KA, Griffiths IR. Myelin proteolipid proteins promote the interaction of oligodendrocytes and axons. J Neurosci Res. 2001;63:151–164. doi: 10.1002/1097-4547(20010115)63:2<151::AID-JNR1007>3.0.CO;2-Y. [DOI] [PubMed] [Google Scholar]
- Younes-Rapozo V, Felgueiras LO, Viana NL, Fierro IM, Barja-Fidalgo C, Manhães AC, Barradas PC. A role for the MAPK/ERK pathway in oligodendroglial differentiation in vitro: stage specific effects on cell branching. Int J Dev Neurosci. 2009;27:757–768. doi: 10.1016/j.ijdevneu.2009.08.014. [DOI] [PubMed] [Google Scholar]
- Zeger M, Popken G, Zhang J, Xuan S, Lu QR, Schwab MH, Nave KA, Rowitch D, D'Ercole AJ, Ye P. Insulin-like growth factor type 1 receptor signaling in the cells of oligodendrocyte lineage is required for normal in vivo oligodendrocyte development and myelination. Glia. 2007;55:400–411. doi: 10.1002/glia.20469. [DOI] [PMC free article] [PubMed] [Google Scholar]
- Zhu X, Bergles DE, Nishiyama A. NG2 cells generate both oligodendrocytes and gray matter astrocytes. Development. 2008a;135:145–157. doi: 10.1242/dev.004895. [DOI] [PubMed] [Google Scholar]
- Zhu X, Hill RA, Nishiyama A. NG2 cells generate oligodendrocytes and gray matter astrocytes in the spinal cord. Neuron Glia Biology. 2008b;4:19–26. doi: 10.1017/S1740925X09000015. [DOI] [PubMed] [Google Scholar]