

Abstract
Interferon-alpha (IFN-α) promotes anti-tumor immunity through its actions on immune cells. We hypothesized that elevated percentages of myeloid-derived suppressor cells (MDSC) and increased pro-inflammatory cytokines in peripheral blood would be associated with impaired response to IFN-α in patients with gastrointestinal (GI) malignancies. This study evaluated relationships between plasma IL-6, IL-10, circulating MDSC subsets, and IFN-α-induced signal transduction in 40 patients with GI malignancies. Plasma IL-6 and IL-10 were significantly higher in patients versus normal donors. CD33+HLADR−CD11b+CD15+ and CD33+HLADR−/lowCD14+ MDSC subsets were also elevated in patients versus normal donors (P < 0.0001). Plasma IL-6 was correlated with CD33+HLADR−CD15+ MDSC (P = 0.008) and IL-10 with CD33+HLADR−CD15− MDSC (P = 0.002). The percentage of CD15+ and CD15− but not CD14+ MDSC subsets were inversely correlated with IFN-α-induced STAT1 phosphorylation in CD4+ T cells, while co-culture with in vitro generated MDSC led to reduced IFN-α responsiveness in both PBMC and the CD4+ subset of T cells from normal donors. Exploratory multivariable Cox proportional hazards models revealed that an increased percentage of the CD33+HLADR−CD15− MDSC subset was associated with reduced overall survival (P = 0.049), while an increased percentage of the CD33+HLADR−/lowCD14+ subset was associated with greater overall survival (P = 0.033). These data provide evidence for a unique relationship between specific cytokines, MDSC subsets, and IFN-α responsiveness in patients with GI malignancies.
Keywords: Myeloid-derived suppressor cell, Immune suppression, Interleukin-6, Interleukin-10
Introduction
Gastrointestinal (GI) malignancies represent more than 15% of yearly cancer diagnoses and were responsible for an estimated 135,830 deaths in the United States in 2009 [1]. One promising approach to treat this group of cancers includes immune-based therapy [2, 3]. Numerous strategies are being developed to overcome the profound systemic immunosuppression in GI cancer patients, as this represents a major factor that limits the potential benefits from immunotherapy [4, 5]. An altered balance of circulating cytokines is thought to drive this immunosuppression. Systemic levels of pro-inflammatory cytokines including interleukin-6 (IL-6), interleukin-10 (IL-10), interleukin-1 beta (IL-1β), and tumor necrosis factor-alpha (TNF-α) are elevated and elicit multiple downstream effects. These cytokines have been recognized as key regulators of immunosuppression and poor quality of life in patients with advanced cancer [6–11].
Many of the same cytokines are also known to play an important role in regulating the generation and function of myeloid-derived suppressor cells (MDSC) [6, 12, 13]. This heterogeneous population of early myeloid cells represents a major barrier to the success of immune-based therapy. MDSC are also thought to promote cancer progression by virtue of their ability to suppress cytotoxicity and cytokine production by natural killer (NK) cells and CD8+ T cells [14–16]. MDSC can deplete arginine and cysteine from the microenvironment and also produce high levels of nitric oxide, which results in the nitration of signal transduction intermediates within CD8+ T cells, and can induce oxidative stress via the production of reactive oxygen species [15, 17–20]. Although great insight into the ability of MDSC to inhibit anti-tumor immunity has been gained from murine studies [4, 13, 17, 21–26], the biologic properties of these cells in human cancer patients are only beginning to be defined [4, 16, 27–31]. Emerging evidence suggests that unique phenotypic MDSC subsets exist in human cancer patients. MDSC have been minimally defined as having a CD33+HLADR− phenotype and can be further divided into granulocytic (CD15+) or monocytic (CD15−) subsets [16, 32]. The prevalence of a CD33+HLADR−/lowCD14+ subset of MDSC has also been reported in patients with various malignancies including hepatocellular carcinoma, ovarian carcinoma and melanoma [29, 33–36]. Few studies have explored potential relationships between MDSC and the cellular response to clinically relevant cytokines in human cancer patients.
Interferon-alpha (IFN-α) is a cytokine that plays a key role in promoting anti-tumor immunity via its ability to activate the STAT1 signal transduction pathway, promote NK and T-cell cytotoxicity [37, 38], and enhance the clonal expansion or cross-priming of T cells [39–41]. Our group and others have shown that patients with advanced malignancy display reduced STAT1 phosphorylation [42, 43]. In addition, using the C26 murine model of adenocarcinoma, we have shown that MDSC can directly inhibit IFN-α responsiveness by nitrating tyrosine residues on the STAT1 protein [44]. Therefore, we hypothesized that increased pro-inflammatory cytokines in patients with GI malignancies would be associated with elevated circulating percentages of MDSC and an impaired IFN-α responsiveness. This study provides evidence for unique relationships between systemic IL-6 or IL-10 levels with individual MDSC subsets, and MDSC with reduced IFN responsiveness in patients with GI malignancies.
Materials and methods
Patients
Peripheral blood samples were obtained from 12 healthy adult blood donors (source leukocytes, American Red Cross, Columbus, OH) and from 40 patients with a confirmed diagnosis of gastrointestinal malignancy at The Ohio State University Comprehensive Cancer Center (Columbus, OH) from 2006 to 2009 under an Institutional Review Board-approved protocol (#2006C0046; PI: Lesinski, G.B.). Plasma from normal donors (n = 20) was purchased from Innovative Research, Inc., (Novi, MI). Plasma was obtained from all forty patients prospectively enrolled in this study. Cryopreserved peripheral blood mononuclear cells (PBMC) of sufficient quantity for flow cytometric analysis were available from thirty-one of the patients enrolled. Overall survival data were obtained from the time of diagnosis on 24 patients. The total number of systemic cancer therapies at any time point (before or after study blood draw) were also recorded.
Blood procurement
PBMC were isolated from peripheral venous blood via density gradient centrifugation with Ficoll-Paque, (Amersham Pharmacia Biotech, Uppsala, Sweden) as previously described [42]. Plasma samples were snap-frozen and stored at −80°C until analysis.
Measurement of cytokines
For quantitative detection of IL-6, IL-10, IL-1β, and TNF-α in plasma, commercially available enzyme-linked immunosorbent assays (ELISA) were used according to manufacturer’s specifications (R&D Systems, Inc.). All samples were run in batches to minimize inter-assay variability, assayed in duplicate, and quantitated using a standard curve.
Flow cytometry for myeloid-derived suppressor cells
Cryopreserved PBMC from each normal donor or patient were suspended at a concentration of 1 × 10⁷/ml in flow staining buffer (PBS plus 1% FBS). Cells were incubated with fluorochrome-labeled antibodies at 4°C. Specific antibodies include CD15 FITC (eBioscience), CD33 PE (BD Biosciences), HLA-DR PERCP-Cy5.5 (eBioscience), CD11b APC (BD Biosciences), and CD14 Pacific Blue (BD Biosciences). PBMC were also labeled with the appropriate isotype control antibodies for each fluorochrome to use as negative controls. Cells were then washed with flow buffer, fixed with 1% formalin, and stored at 4°C until analysis. All samples were run on a BD LSR II flow cytometer and were subsequently analyzed with FlowJo software (Tree Star, Inc.). MDSC were defined as cells positive for CD33 and lacking HLA-DR with subsets expressing CD15, CD14 and CD11b, as discussed in the legends.
Analysis of STAT1 phosphorylation by flow cytometry
Levels of intracellular Tyr701-phosphorylated STAT1 (P-STAT1) within total PBMC or individual cell subsets were measured by flow cytometry as previously described [42]. Cryopreserved patient cells were thawed, resuspended in fresh RPMI-1640 media containing 10% Human AB serum (Sigma–Aldrich, St. Louis MO), and stimulated for 15 min with 104 U/ml recombinant, human IFN-α2b (Schering-Plough). This dose and time point has been previously shown by our group to induce maximal IFN-α-mediated STAT1 phosphorylation at the Tyr701 residue [42, 45]. Following stimulation, cells were fixed and permeabilized (Fix & Perm Permeabilization Kit; Invitrogen), washed in PBS containing 5% fetal bovine serum, and then stained for 30 min at room temperature with fluorochrome-labeled antibodies against P-STAT1 Ab (BD Biosciences, San Diego, CA) in combination with antibodies targeting extracellular markers (CD4, CD8, and CD56). After a final wash, samples were fixed in 1% formalin and analyzed using a BD FACScalibur flow cytometer using at least 10,000 cells in the lymphocyte gate based on light scatter properties. Data were expressed as specific fluorescence (Fsp = Ft−Fb), where Ft represents the median value of total staining and Fb represents the median value of background staining with an isotype control antibody [45].
In vitro generation of MDSC
PBMC were isolated from normal donor Red Cross leukopaks via density gradient centrifugation with Ficoll-Paque, (Amersham Pharmacia Biotech, Uppsala, Sweden) as previously described [42]. A protocol for in vitro generation of MDSC was adapted from Lechner et al. [46]. Briefly, cells were plated at a concentration of 5 × 10⁵ cells/ml in complete media (RPMI media supplemented with 10% fetal bovine serum and antibiotics). GM-CSF, IL-6, and IL-10 were added to the media at a concentration of 10 ng/ml. Cells were cultured at 37°C for 7 days, with media and cytokine replacement every 2–3 days. After 7 days, suspension and adherent cells were harvested and myeloid cells were isolated from culture using the Easy Sep Myeloid Isolation Kit (Stem Cell Technologies). Cells were labeled with anti-CD33/66b magnetic microbeads and positively selected using an Easy Sep magnet. Isolated cells were washed twice prior to further studies. PBMC isolated from the same donor but not treated with cytokines were used as a control. In vitro generated MDSC were phenotypically evaluated for the expression of CD33, HLA-DR, CD11b, and CD15 by flow cytometry. Consistent with prior studies, they were found to express CD33 and CD11b, with variable levels of HLA-DR and CD15.
Co-culture of MDSC and PBMC
In vitro generated MDSC were co-cultured with autologous PBMC that were thawed and rested in complete media 1 day prior to co-culture. MDSC were plated at a 1:1 ratio with PBMC in complete media and incubated for 24 h at 37°C. After 24 h, non-adherent cells were harvested and stimulated with 103 or 104 U/ml IFN-α for 15 min at 37°C as previously described [42]. This dose and time point has been shown to induce robust STAT1 phosphorylation as previously described by our group [42, 45]. P-STAT1 staining and analysis was conducted as described in the same manner as the patient samples described above. Co-culture protocol was adapted from previous studies conducted by Nagaraj et al. [27].
Statistical methods
Pearson correlation coefficients were used to evaluate the relationship between measures. Comparisons of MDSC percentages and the plasma concentration of cytokines between GI cancer patients and normal donors were made using the Wilcoxon rank sum test. Exploratory univariable and multivariable Cox proportional hazards regression models were used to evaluate the effect of plasma cytokine levels, the percentage of MDSC subsets, and number of systemic cancer therapies on overall survival. Because we were primarily interested in the potential contribution of MDSC subsets to overall survival, we used a backward elimination procedure [47] (with 0.1 as the P-value criterion for removal) that considered only the three MDSC subsets. In this manner, we explored the multivariable relationship between the three MDSC subsets (CD15+, CD15−, or CD14+) and survival. Once a final multivariable model was obtained based on MDSC subset, three additional indicators (pancreatic cancer, >1 systemic cancer therapy, and stage of disease) were added to the model individually to assess their effect on the hazard ratio for each subset. This approach was utilized due to the large number of potential predictors compared to the limited sample size. Plasma cytokine concentrations and MDSC levels (as percentage of total cells) were log-transformed after a small positive adjustment to account for zero values. This transformation improved their normality for the Pearson coefficients and their linearity in the Cox models.
Results
Patient demographics
The demographics of patients in this study are illustrated in Table 1. Blood from 27 of the patients was obtained within 3 months of initial cancer diagnosis, and none of these individuals had prior therapy. Of the 13 patients diagnosed over 3 months prior to obtaining blood, 11 had prior therapy. Thirteen patients (32.5%) had prior surgical resection. In all patients, blood draws were obtained a minimum of 2 weeks following their last therapy or surgical procedure to minimize the effects of treatment on the profile of circulating cytokines or MDSC.
Table 1.
Characteristics of patients in study
| Patient characteristics | Number |
|---|---|
| Number of patient (n) | 40 |
| Mean age in years (range) | 63 (37–85) |
| Median age in years | 64 |
| Gender | |
| Male | 27 (67.5%) |
| Female | 13 (32.5%) |
| Cancer diagnosis | |
| Pancreatic | 14 (35%) |
| Esophageal | 11 (27.5%) |
| Colon | 7 (17.5%) |
| Gastric | 4 (10%) |
| Cholangiocarcinoma | 1 (2.5%) |
| Gallbladder | 1 (2.5%) |
| Appendix 1 | 1 (2.5%) |
| Hepatocellular | 1 (2.5%) |
| AJCC clinical cancer stage | |
| I | 2 (5%) |
| II | 7 (17.5%) |
| III | 7 (17.5%) |
| IV | 24 (60%) |
| Number of total systemic treatments | |
| 0 | 6 (15%) |
| 1 | 21 (52.5%) |
| 2 | 3 (7.5%) |
| 3 | 6 (15%) |
| 4 | 2 (5%) |
| 5 | 2 (5%) |
Myeloid-derived suppressor cell subsets are elevated in patients with various GI malignancies
The level of individual CD33+HLADR−CD11b+CD15+ or CD33+HLADR−/lowCD14+ MDSC subsets was significantly elevated in patients as compared to normal healthy donors (P < 0.0001; Fig. 1a–d) and widely distributed across patients with various GI malignancies (Fig. 2a–b). The analysis of immature myeloid cells with a CD33+HLADR− phenotype was further subclassified by the presence of CD15 (CD33+HLADR−CD11b+CD15+, CD33+HLADR−CD11b+CD15−, or CD33+HLADR−/lowCD14+ MDSC subsets. Although the CD15+ and CD14+ MDSC were more prevalent in the PBMC of patients (Fig. 2c), there were significant co-linear relationships between the each of the MDSC subsets (CD15+ vs. CD15− Pearson r = 0.580, P = 0.0006; CD15+ vs. CD14+ Pearson r = 0.630, P = 0.0001; CD15− vs. CD14+ Pearson r = 0.540 P = 0.0017).
Fig. 1.
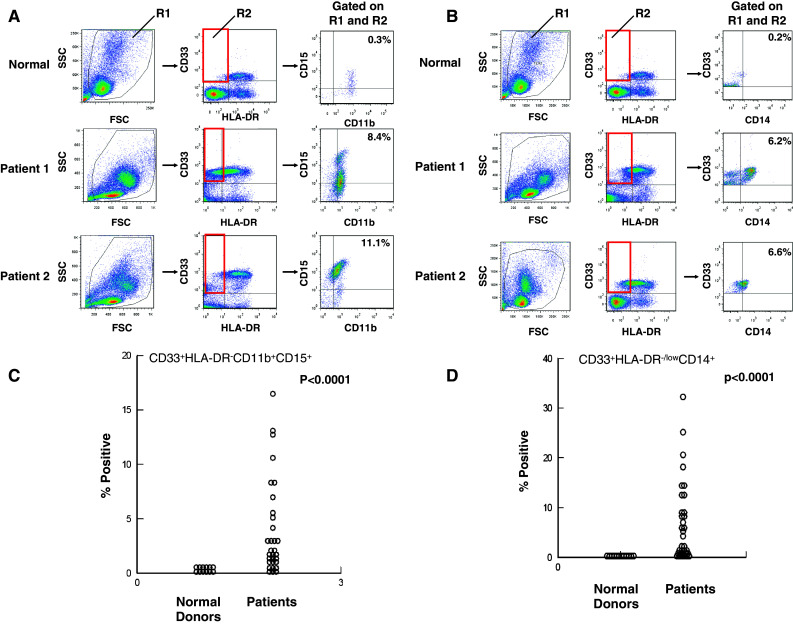
Phenotypic analysis of MDSC subsets in patients with GI malignancies. Peripheral blood mononuclear cells (PBMCs) were obtained from n = 31 GI cancer patients for whom peripheral blood was available or normal donors (n = 12) and stained for MDSC using fluorochrome-labeled antibodies targeting CD33, HLADR, CD15, CD14, and CD11b or the appropriate isotype controls. MDSC levels were evaluated by flow cytometry based on a minimum of 20,000 live events and presented as the percentage of total cells, listed in box R2 in figure. a Representative scatter plots from two GI cancer patients as compared to PBMC obtained from a normal control. PBMCs were labeled with CD33, HLA-DR, CD15, and CD11b, box R2 indicates gated population, and arrows indicate the sequence of gating. The first dot plot depicts forward scatter (FSC) by side scatter (SSC) properties of PBMC for determining initial live cell gate. b Representative scatter plots from two GI cancer patients as compared to PBMC obtained from a normal control. PBMCs were labeled with CD33, HLA-DR, and CD14, box R2 indicates gated population, and arrows indicate the sequence of gating. c CD33+HLADR−CD11b+CD15+ MDSC and d CD33+HLA-DR−/lowCD14+ MDSC and compared to levels found in normal control PBMCs
Fig. 2.

MDSC subsets are elevated in all types of GI malignancies. a–b The levels of each MDSC subset, as determined by flow cytometry, were evaluated by type of GI malignancy and compared to normal control PBMC. The number of patients with cancer at each organ site is listed on the plot. Patients designated as ‘other’ consist of one patient each with cancer of the gallbladder, appendix, hepatocellular carcinoma, or cholangiocarcinoma. c Early myeloid cells (CD33+HLADR−) were evaluated in a similar manner from all 31 patients to determine the percentage positive and negative for CD15 or positive for CD14
Expression of pro-inflammatory cytokines in plasma from GI cancer patients
Systemic levels of pro-inflammatory cytokines important for MDSC expansion and function were evaluated in this cohort of GI cancer patients [6, 16]. Plasma levels of IL-6 and IL-10 were significantly elevated in all patients as compared to normal controls (Fig. 3a, P < 0.0001, P < 0.0001). Plasma levels of IL-1β and TNF-α were up-regulated in only 11 and 8 patients, respectively (data not shown).
Fig. 3.

Plasma levels of IL-6 and IL-10 and the association with MDSC in patients with GI malignancies. a IL-6 and IL-10 were measured by ELISA in plasma isolated from the peripheral blood of patients with GI malignancies (n = 40) and plasma obtained from normal donors (n = 20). The levels of IL-6 and IL-10 were significantly elevated in patients with GI malignancy as compared to normal controls. All samples were assayed in duplicate and quantitated using a standardized protein curve. b–c MDSC levels were obtained as described previously from n = 31 patients and compared with plasma cytokine levels from the same patient. b The percentage of CD33+HLADR−CD15+ MDSC and plasma levels of IL-6 and c the percentage of CD33+HLADR−CD15− MDSC and plasma levels of IL-10
Relationship between MDSC subsets and plasma cytokines in patients with gastrointestinal malignancy
Analysis of cytokines and MDSC subsets revealed a strong correlation between IL-6 and the percentage of CD15+ MDSC (Pearson r = 0.468; P = 0.008; Fig. 3b), but not the percentage of CD15− MDSC (Pearson r = 0.267; P = 0.146) or CD14+ MDSC (Pearson r = 0.245; P = 0.184). In contrast, IL-10 strongly correlated with the CD15− MDSC subset (Pearson r = 0.534; P = 0.002; Fig. 3c) but not with the level of CD15+ MDSC (Pearson r = 0.197; P = 0.288) or CD14+ MDSC (Pearson r = 0.114; P = 0.542).
MDSC are inversely correlated with reduced IFN-α responsiveness in CD4+ T cells
The relationship between the percentage of MDSC and IFN-α responsiveness of immune effector cells was evaluated in this cohort of patients. We observed an inverse correlation between the percentage of CD15+ or CD15− MDSC and the level of IFN-α-induced pSTAT1 in CD4+ T cells (Fig. 4a–b). This relationship was strongest for the CD15+ MDSC subset (Fig. 4a; Pearson r = −0.55; P = 0.002) and the CD15− MDSC subset (Pearson r = −0.388, P = 0.034). In contrast, there was no relationship between the CD14+ MDSC subset and IFN-α-induced pSTAT1 in CD4+ T cells (data not shown; Pearson r = −0.139, P = 0.46 for CD14+ MDSC). No significant relationships were observed between the percentage of MDSC and pSTAT1 within CD56+ (NK) cells or CD8+ T-cell subsets (data not shown).
Fig. 4.

Inverse correlation between MDSC and IFN-α-induced STAT1 phosphorylation. MDSC levels were obtained as described previously from n = 31 patients and compared with the levels of IFN-α-induced STAT1 phosphorylation (P-STAT1). a-b The percentage of both CD33+HLADR−CD15+ MDSC and CD33+HLADR−CD15− MDSC inversely correlated with STAT1 phosphorylation following ex vivo stimulation with IFN-α (104 U/ml for 15 min) in CD4+ T cells from GI patients. c Normal PBMC co-cultured with in vitro generated MDSC exhibited reduced IFN-α-induced STAT1 phosphorylation. In vitro generated MDSC expressed CD33 and CD11b, with variable, donor-dependent levels of HLA-DR and CD15, and showed no difference in CD15 expression in the presence or absence of IL-10 (data not shown). d CD4+ T cells from normal donors have reduced IFN-α-induced P-STAT1 when co-cultured with autologous, in vitro generated MDSC. Error bars represent standard deviation obtained from separate experiments using PBMC and autologous, in vitro generated MDSC from four unique donors
MDSC reduce IFN-α responsiveness in vitro
PBMC co-cultured with in vitro generated MDSC had a significantly reduced level of pSTAT1 (at Tyr701) following IFN-α treatment at both 103 and 104 U/ml as compared to PBMC alone (P = 0.0017 and P = 0.0062; Fig. 4c). Similar to the patient data, the CD4+ T-cell subset also had a reduced response to IFN-α treatment when co-cultured with MDSC (Fig. 4d; 103 P = 0.049 and 104 P = 0.186). PBMC were also co-cultured in parallel with non-cytokine-treated autologous PBMC as a control. These cells did not inhibit IFN-α responsiveness as compared to PBMC cultured alone (not shown).
Relationship between cytokines, MDSC subsets, and overall survival
The data were analyzed to identify whether the percentage of each MDSC subset was related to the clinical course of disease. Univariable Cox proportional hazards models indicated the hazard of death was not significantly related to the level of any plasma cytokine or the percentage of any individual MDSC subset (CD14+ P = 0.233; CD15+ P = 0.343; CD15− P = 0.323; Table 2). As expected, a diagnosis of pancreatic cancer was associated with an increased risk of death when compared with cancer originating from other organ sites [hazard ratio (HR) = 4.36, P = 0.001]. To evaluate potential relationships between overall survival and the three MDSC subsets, an exploratory backwards elimination procedure was used to select predictors for a multivariable model. The final model included the CD15− and CD14+ subsets, revealing an increasing hazard of death with increasing CD15− MDSC and a decreasing hazard with increasing CD14+ MDSC (HR for twofold increase in CD15− = 1.42, P = 0.049; HR for twofold increase in CD14+ = 0.69, P = 0.033, Table 3). Addition of an indicator for pancreatic malignancy into this model influenced the significance of both MDSC subsets (pancreatic cancer P = 0.01, CD15− P = 0.32, CD14+ P = 0.114). However, adding stage of disease or number of cancer therapies into the model did not meaningfully alter the effect or significance of MDSC subsets on overall survival (not shown).
Table 2.
Hazard ratios for univariable models
| Factor | Hazard ratio* (95% CI) | P value |
|---|---|---|
| IL-6 | 1.08 (0.89–1.32) | 0.441 |
| IL-10 | 1.23 (0.93–1.62) | 0.141 |
| More than 1 prior systemic therapy | 0.62 (0.25–1.53) | 0.303 |
| Stage III–IV disease | 1.83 (0.68–4.94) | 0.232 |
| Pancreatic malignancy | 4.36 (1.80–10.55) | 0.001 |
| CD15+ MDSC | 0.90 (0.72–1.12) | 0.343 |
| CD15− MDSC | 1.11 (0.90–1.37) | 0.323 |
| CD14+ MDSC | 0.86 (0.67–1.10) | 0.233 |
* HRs computed for a twofold increase in the biomarker (IL-6, IL-10, CD15+ MDSC subset, CD15− MDSC subset, and CD14+ MDSC subset), more than 1 prior therapy versus 1 or fewer, pancreatic malignancy versus. other sites, and stage III–IV disease versus stage I–II
Table 3.
Hazard ratios for multivariable models
| Factor | Hazard ratio* (95% CI) | P value |
|---|---|---|
| Multivariable model containing all MDSC subsets | ||
| CD15− MDSC | 1.5 (1.03–2.17) | 0.033 |
| CD15+ MDSC | 0.83 (0.55–1.27) | 0.400 |
| CD14+ MDSC | 0.77 (0.49–1.21) | 0.259 |
| Multivariable model with CD15+ MDSC subset removed | ||
| CD15− MDSC | 1.42 (1.00–2.02) | 0.049 |
| CD14+ MDSC | 0.69 (0.49–0.97) | 0.033 |
* HRs computed for a twofold increase in the biomarker (CD15+ MDSC subset, CD15−MDSC subset, and CD14+ MDSC subset)
Discussion
MDSC represent a key cellular mediator of immune suppression both in pre-clinical models and in patients with advanced malignancy [16, 27, 48]. These cells represent an important barrier that likely limits the full potential of immune-based cancer therapies or endogenous host responses to developing tumors. Immunotherapy with recombinant cytokines, antibodies, and vaccine approaches continues to emerge as a promising treatment approach for many solid tumors and is also garnering increased interest in a number of GI malignancies [2, 3, 49]. For example, recent trials utilizing allogeneic pancreatic cancer cells that secrete GM-CSF as a vaccine in combination with cyclophosphamide have demonstrated disease control in a number of patients with refractory cancer [50, 51]. These data indicate that a better understanding of systemic immunosuppression such as the interactions between MDSC, systemic cytokines, and their signaling pathways could lead to new strategies for augmenting the host immune response against tumors.
The present study examined the relationships between plasma cytokines associated with immune suppression, MDSC levels, and IFN-α-induced signal transduction in the peripheral blood of patients with various GI malignancies. We have demonstrated that IL-6, IL-10, and multiple MDSC subsets were significantly elevated in patients when compared with normal donors. A highly significant correlation between plasma IL-6 with the CD15+ MDSC subset and IL-10 with the CD15− MDSC subset was also observed, despite the heterogeneity of the patients included in the study. These data suggest that the systemic profile of pro-inflammatory cytokines may be associated with specific phenotypic subsets of circulating MDSC. Consistent with prior murine studies by our group, an inverse correlation between circulating CD15+ or CD15− MDSC subsets and IFN-α responsiveness of CD4+ T cells was also observed [44]. Interestingly, co-culture with in vitro generated MDSC led to reduced IFN-α responsiveness of total PBMC and the CD4+ T-cell compartment. Finally, multivariable Cox proportional hazards models revealed that levels of individual MDSC subsets differentially influenced the hazard of death in this heterogeneous patient population. These data reveal novel relationships between individual MDSC subsets and systemic immunologic parameters that may regulate disease biology and progression.
Phenotypic subsets of MDSC in humans are continually being defined. This study has characterized what appear to be novel relationships between CD15+ and CD15− phenotypic subpopulations of MSDC and systemic cytokine profiles in patients with GI malignancy. The CD15 marker is expressed on circulating granulocytes and some monocytes but is absent on lymphocytes. This protein is believed to play a role in phagocytosis, stimulation of degranulation, and chemotaxis. Consistent with other studies of MDSC in cancer patients [27], the majority of CD33+HLA-DR−CD15+ MDSC were also positive for CD11b (integrin αMβ2) expression. Our data suggested that the overall balance between systemic IL-6 and IL-10 may influence the percentage of individual MDSC subsets. In addition, these data suggest the presence of the CD15 marker may represent a particular stage of MDSC differentiation. However, the cytokine profile driving this process is likely complex and not limited to IL-6 and IL-10.
Multivariable Cox proportional hazards models were used to evaluate potential relationships between MDSC subsets and overall survival. These exploratory modeling approaches showed that increased levels of CD15− MDSC and decreased levels of CD14+ MDSC were associated with reduced overall survival in this cohort of patients. These data indicate that MDSC subsets may play some role in influencing the outcome of patients with GI malignancy. Although these results are consistent with other studies documenting a prognostic role of MDSC in advanced cancer [29, 31], we caution over-interpretation of this data due to the heterogeneity of this patient population. Notably, patients diagnosed with pancreatic cancer had a significantly increased risk of death independent of MDSC level, which reflects the aggressive nature of this malignancy. Future studies are likely to resolve the question of whether individual MDSC subsets may be more prevalent in patients with a particular type of GI malignancy. Indeed, prior studies showed that melanoma patients had significantly elevated CD33+HLA-DR−/lowCD14+ MDSC but not Lin−HLA-DR−CD33+ MDSC as compared to normal donors [33]. This CD14+ MDSC subset has also been noted in other types of cancer including hepatocellular and ovarian carcinoma [52]. These data highlight the importance of studying individual MDSC subsets and indicate that disease biology likely influences the phenotypic properties of MDSC subsets.
The strengths of this study are the fact that the majority of patient samples were obtained soon after cancer diagnosis. This is particularly advantageous since data from most patients were obtained prior to surgery or adjuvant therapy such as chemotherapeutic drugs and radiation that could alter suppressor cell populations or function. Also, this represents the first report linking human MDSC with reduced IFN-α responsiveness of immune effector cells. One factor that might influence these results is the use of Ficoll-Paque separation. Previous studies have indicated that this separation technique can reduce the yield of CD15+ MDSC [31]. This was controlled for in comparison with normal donor samples, as both were processed in the same manner. However, our interpretation of the relative contribution of each subset to the biology and outcome of disease could be influenced by this technical factor. A second limitation of this study was the fact that the limited number of patient cells available permitted only phenotypic analysis of individual MDSC subsets and an analysis of IFN-α-induced signal transduction. We are in the process of conducting prospective studies to evaluate whether human MDSC confer reduced IFN-α responsiveness via reactive nitrogen intermediates as shown in our prior murine studies. We are also interested in studying whether the ability of MDSC subsets to inhibit IFN-α responsiveness is related to their ability to suppress T-cell proliferation or NK cell cytotoxicity [6, 14]. Finally, we plan to explore the phenotypic differences of MDSC isolated from both primary and metastatic tumor sites. Indeed, MDSC at the tumor site have been shown to be more suppressive, and therefore, the relative level of CD15 expression could also play a different role in this environment [16]. These questions will be best answered in the context of a prospective study in a more homogeneous patient population.
This study suggests the specific cytokine milieu in the periphery of cancer patients is associated with unique subsets of MDSC populations that impact the cellular response to clinically relevant cytokines. Likewise, this report is the first to demonstrate that human MDSC lead to reduced IFN-α responsiveness in immune effector cells. These data support MDSC as a relevant target that could be modulated to enhance the response to immune-based therapy in patients with advanced malignancies.
Acknowledgments
We thank Dr. Susan Geyer for critical review of this manuscript. We thank the OSU CCC Analytical Cytometry Shared Resource. We would also like to thank the following agencies for grant support: The Valvano Foundation for Cancer Research Award (to G.B. Lesinski), National Institutes of Health (NIH) Grants T32 GM068412 (to B. Mundy), CA84402, K24 CA93670 (to W.E. Carson), K22 CA134551 (to G.B. Lesinski), and The Samuel J. Roessler Memorial Scholarship at The Ohio State University College of Medicine (to E. Binkley).
Contributor Information
William E. Carson, III, Phone: +614-293-6306, FAX: +614-293-3465, Email: William.Carson@osumc.edu.
Gregory B. Lesinski, Phone: +614-2923676, FAX: +614-688-4366, Email: Gregory.Lesinski@osumc.edu
References
- 1.Jemal A, Siegel R, Ward E, Hao Y, Xu J, Thun MJ. Cancer statistics. CA Cancer J Clin. 2009;59:225–249. doi: 10.3322/caac.20006. [DOI] [PubMed] [Google Scholar]
- 2.Chaudry MA, Sales K, Ruf P, Lindhofer H, Winslet MC. EpCAM an immunotherapeutic target for gastrointestinal malignancy: current experience and future challenges. Br J Cancer. 2007;96:1013–1019. doi: 10.1038/sj.bjc.6603505. [DOI] [PMC free article] [PubMed] [Google Scholar]
- 3.Dougan M, Dranoff G. Immune therapy for cancer. Annu Rev Immunol. 2009;27:83–117. doi: 10.1146/annurev.immunol.021908.132544. [DOI] [PubMed] [Google Scholar]
- 4.Almand B, Clark JI, Nikitina E, van Beynen J, English NR, Knight SC, Carbone DP, Gabrilovich DI. Increased production of immature myeloid cells in cancer patients: a mechanism of immunosuppression in cancer. J Immunol. 2001;166:678–689. doi: 10.4049/jimmunol.166.1.678. [DOI] [PubMed] [Google Scholar]
- 5.Ugel S, Delpozzo F, Desantis G, Papalini F, Simonato F, Sonda N, Zilio S, Bronte V. Therapeutic targeting of myeloid-derived suppressor cells. Curr Opin Pharmacol. 2009;9:470–481. doi: 10.1016/j.coph.2009.06.014. [DOI] [PubMed] [Google Scholar]
- 6.Gabrilovich DI, Nagaraj S. Myeloid-derived suppressor cells as regulators of the immune system. Nat Rev Immunol. 2009;9:162–174. doi: 10.1038/nri2506. [DOI] [PMC free article] [PubMed] [Google Scholar]
- 7.Tisdale MJ. Cancer cachexia. Curr Opin Gastroenterol. 2010;26:146–151. doi: 10.1097/MOG.0b013e3283347e77. [DOI] [PubMed] [Google Scholar]
- 8.Liao WC, Lin JT, Wu CY, Huang SP, Lin MT, Wu AS, Huang YJ, Wu MS. Serum interleukin-6 level but not genotype predicts survival after resection in stages II and III gastric carcinoma. Clin Cancer Res. 2008;14:428–434. doi: 10.1158/1078-0432.CCR-07-1032. [DOI] [PubMed] [Google Scholar]
- 9.Chung YC, Chang YF. Serum interleukin-6 levels reflect the disease status of colorectal cancer. J Surg Oncol. 2003;83:222–226. doi: 10.1002/jso.10269. [DOI] [PubMed] [Google Scholar]
- 10.De Vita F, Orditura M, Galizia G, Romano C, Infusino S, Auriemma A, Lieto E, Catalano G. Serum interleukin-10 levels in patients with advanced gastrointestinal malignancies. Cancer. 1999;86:1936–1943. doi: 10.1002/(SICI)1097-0142(19991115)86:10<1936::AID-CNCR9>3.0.CO;2-9. [DOI] [PubMed] [Google Scholar]
- 11.Karin M, Greten FR. NF-kappa B: linking inflammation and immunity to cancer development and progression. Nat Rev Immunol. 2005;5:749–759. doi: 10.1038/nri1703. [DOI] [PubMed] [Google Scholar]
- 12.Stewart TJ, Greeneltch KM, Reid JE, Liewehr DJ, Steinberg SM, Liu K, Abrams SI (2009) Interferon regulatory factor-8 modulates the development of tumor-induced CD11bGr-1 myeloid cells. J Cell Mol Med [DOI] [PMC free article] [PubMed]
- 13.Bunt SK, Yang L, Sinha P, Clements VK, Leips J, Ostrand-Rosenberg S. Reduced inflammation in the tumor microenvironment delays the accumulation of myeloid-derived suppressor cells and limits tumor progression. Cancer Res. 2007;67:10019–10026. doi: 10.1158/0008-5472.CAN-07-2354. [DOI] [PMC free article] [PubMed] [Google Scholar]
- 14.Li H, Han Y, Guo Q, Zhang M, Cao X. Cancer-expanded myeloid-derived suppressor cells induce anergy of NK cells through membrane-bound TGF-beta 1. J Immunol. 2009;182:240–249. doi: 10.4049/jimmunol.182.1.240. [DOI] [PubMed] [Google Scholar]
- 15.Nagaraj S, Schrum AG, Cho HI, Celis E, Gabrilovich DI. Mechanism of T cell tolerance induced by myeloid-derived suppressor cells. J Immunol. 2010;184:3106–3116. doi: 10.4049/jimmunol.0902661. [DOI] [PMC free article] [PubMed] [Google Scholar]
- 16.Ko JS, Zea AH, Rini BI, Ireland JL, Elson P, Cohen P, Golshayan A, Rayman PA, Wood L, Garcia J, Dreicer R, Bukowski R, Finke JH. Sunitinib mediates reversal of myeloid-derived suppressor cell accumulation in renal cell carcinoma patients. Clin Cancer Res. 2009;15:2148–2157. doi: 10.1158/1078-0432.CCR-08-1332. [DOI] [PubMed] [Google Scholar]
- 17.Ostrand-Rosenberg S Myeloid-derived suppressor cells: more mechanisms for inhibiting antitumor immunity. Cancer Immunol Immunother [DOI] [PMC free article] [PubMed]
- 18.Srivastava MK, Sinha P, Clements VK, Rodriguez P, Ostrand-Rosenberg S. Myeloid-derived suppressor cells inhibit T-cell activation by depleting cystine and cysteine. Cancer Res. 2010;70:68–77. doi: 10.1158/0008-5472.CAN-09-2587. [DOI] [PMC free article] [PubMed] [Google Scholar]
- 19.Mazzoni A, Bronte V, Visintin A, Spitzer JH, Apolloni E, Serafini P, Zanovello P, Segal DM. Myeloid suppressor lines inhibit T cell responses by an NO-dependent mechanism. J Immunol. 2001;168:689–695. doi: 10.4049/jimmunol.168.2.689. [DOI] [PubMed] [Google Scholar]
- 20.Ostrand-Rosenberg S, Sinha P. Myeloid-derived suppressor cells: linking inflammation and cancer. J Immunol. 2009;182:4499–4506. doi: 10.4049/jimmunol.0802740. [DOI] [PMC free article] [PubMed] [Google Scholar]
- 21.Morales JK, Kmieciak M, Graham L, Feldmesser M, Bear HD, Manjili MH. Adoptive transfer of HER2/neu-specific T cells expanded with alternating gamma chain cytokines mediate tumor regression when combined with the depletion of myeloid-derived suppressor cells. Cancer Immunol Immunother. 2009;58:941–953. doi: 10.1007/s00262-008-0609-z. [DOI] [PMC free article] [PubMed] [Google Scholar]
- 22.Sinha P, Clements VK, Bunt SK, Albelda SM, Ostrand-Rosenberg S. Cross-talk between myeloid-derived suppressor cells and macrophages subverts tumor immunity toward a type 2 response. J Immunol. 2007;179:977–983. doi: 10.4049/jimmunol.179.2.977. [DOI] [PubMed] [Google Scholar]
- 23.Sinha P, Clements VK, Fulton AM, Ostrand-Rosenberg S. Prostaglandin E2 promotes tumor progression by inducing myeloid-derived suppressor cells. Cancer Res. 2007;67:4507–4513. doi: 10.1158/0008-5472.CAN-06-4174. [DOI] [PubMed] [Google Scholar]
- 24.Sinha P, Clements VK, Ostrand-Rosenberg S. Reduction of myeloid-derived suppressor cells and induction of M1 macrophages facilitate the rejection of established metastatic disease. J Immunol. 2005;174:636–645. doi: 10.4049/jimmunol.174.2.636. [DOI] [PubMed] [Google Scholar]
- 25.Kusmartsev S, Gabrilovich DI. STAT1 signaling regulates tumor-associated macrophage-mediated T cell deletion. J Immunol. 2005;174:4880–4891. doi: 10.4049/jimmunol.174.8.4880. [DOI] [PubMed] [Google Scholar]
- 26.Youn JI, Nagaraj S, Collazo M, Gabrilovich DI. Subsets of myeloid-derived suppressor cells in tumor-bearing mice. J Immunol. 2008;181:5791–5802. doi: 10.4049/jimmunol.181.8.5791. [DOI] [PMC free article] [PubMed] [Google Scholar]
- 27.Nagaraj S, Youn JI, Weber H, Iclozan C, Lu L, Cotter MJ, Meyer C, Becerra CR, Fishman M, Antonia S, Sporn MB, Liby KT, Rawal B, Lee JH, Gabrilovich DI. Anti-inflammatory triterpenoid blocks immune suppressive function of MDSCs and improves immune response in cancer. Clin Cancer Res. 2010;16:1812–1823. doi: 10.1158/1078-0432.CCR-09-3272. [DOI] [PMC free article] [PubMed] [Google Scholar]
- 28.De Santo C, Salio M, Masri SH, Lee LY, Dong T, Speak AO, Porubsky S, Booth S, Veerapen N, Besra GS, Grone HJ, Platt FM, Zambon M, Cerundolo V. Invariant NKT cells reduce the immunosuppressive activity of influenza A virus-induced myeloid-derived suppressor cells in mice and humans. J Clin Invest. 2008;118:4036–4048. doi: 10.1172/JCI36264. [DOI] [PMC free article] [PubMed] [Google Scholar]
- 29.Filipazzi P, Valenti R, Huber V, Pilla L, Canese P, Iero M, Castelli C, Mariani L, Parmiani G, Rivoltini L. Identification of a new subset of myeloid suppressor cells in peripheral blood of melanoma patients with modulation by a granulocyte-macrophage colony-stimulation factor-based antitumor vaccine. J Clin Oncol. 2007;25:2546–2553. doi: 10.1200/JCO.2006.08.5829. [DOI] [PubMed] [Google Scholar]
- 30.Zea AH, Rodriguez PC, Atkins MB, Hernandez C, Signoretti S, Zabaleta J, McDermott D, Quiceno D, Youmans A, O’Neill A, Mier J, Ochoa AC. Arginase-producing myeloid suppressor cells in renal cell carcinoma patients: a mechanism of tumor evasion. Cancer Res. 2005;65:3044–3048. doi: 10.1158/0008-5472.CAN-04-4505. [DOI] [PubMed] [Google Scholar]
- 31.Diaz-Montero CM, Salem ML, Nishimura MI, Garrett-Mayer E, Cole DJ, Montero AJ. Increased circulating myeloid-derived suppressor cells correlate with clinical cancer stage, metastatic tumor burden, and doxorubicin-cyclophosphamide chemotherapy. Cancer Immunol Immunother. 2009;58:49–59. doi: 10.1007/s00262-008-0523-4. [DOI] [PMC free article] [PubMed] [Google Scholar]
- 32.Movahedi K, Guilliams M, Van den Bossche J, Van den Bergh R, Gysemans C, Beschin A, De Baetselier P, Van Ginderachter JA. Identification of discrete tumor-induced myeloid-derived suppressor cell subpopulations with distinct T cell-suppressive activity. Blood. 2008;111:4233–4244. doi: 10.1182/blood-2007-07-099226. [DOI] [PubMed] [Google Scholar]
- 33.Poschke I, Mougiakakos D, Hansson J, Masucci GV, Kiessling R. Immature immunosuppressive CD14+ HLA-DR-/low cells in melanoma patients are Stat3hi and overexpress CD80, CD83, and DC-sign. Cancer Res. 2010;70:4335–4345. doi: 10.1158/0008-5472.CAN-09-3767. [DOI] [PubMed] [Google Scholar]
- 34.Hoechst B, Ormandy LA, Ballmaier M, Lehner F, Kruger C, Manns MP, Greten TF, Korangy F. A new population of myeloid-derived suppressor cells in hepatocellular carcinoma patients induces CD4(+)CD25(+)Foxp3(+) T cells. Gastroenterology. 2008;135:234–243. doi: 10.1053/j.gastro.2008.03.020. [DOI] [PubMed] [Google Scholar]
- 35.Gordon IO, Freedman RS. Defective antitumor function of monocyte-derived macrophages from epithelial ovarian cancer patients. Clin Cancer Res. 2006;12:1515–1524. doi: 10.1158/1078-0432.CCR-05-2254. [DOI] [PubMed] [Google Scholar]
- 36.Ugurel S, Uhlig D, Pfohler C, Tilgen W, Schadendorf D, Reinhold U. Down-regulation of HLA class II and costimulatory CD86/B7–2 on circulating monocytes from melanoma patients. Cancer Immunol Immunother. 2004;53:551–559. doi: 10.1007/s00262-003-0489-1. [DOI] [PMC free article] [PubMed] [Google Scholar]
- 37.Brassard DL, Grace MJ, Bordens RW. Interferon-alpha as an immunotherapeutic protein. J Leukoc Biol. 2002;71:565–581. [PubMed] [Google Scholar]
- 38.Biron CA. Interferons alpha and beta as immune regulators–a new look. Immunity. 2001;14:661–664. doi: 10.1016/S1074-7613(01)00154-6. [DOI] [PubMed] [Google Scholar]
- 39.Kolumam GA, Thomas S, Thompson LJ, Sprent J, Murali-Krishna K. Type I interferons act directly on CD8 T cells to allow clonal expansion and memory formation in response to viral infection. J Exp Med. 2005;202:637–650. doi: 10.1084/jem.20050821. [DOI] [PMC free article] [PubMed] [Google Scholar]
- 40.Le Bon A, Durand V, Kamphuis E, Thompson C, Bulfone-Paus S, Rossmann C, Kalinke U, Tough DF. Direct stimulation of T cells by type I IFN enhances the CD8+ T cell response during cross-priming. J Immunol. 2006;176:4682–4689. doi: 10.4049/jimmunol.176.8.4682. [DOI] [PubMed] [Google Scholar]
- 41.Lesinski GB, Anghelina M, Zimmerer J, Bakalakos T, Badgwell B, Parihar R, Hu Y, Becknell B, Abood G, Chaudhury AR, Magro C, Durbin J, Carson WE., III The antitumor effects of IFN-alpha are abrogated in a STAT1-deficient mouse. J Clin Invest. 2003;112:170–180. doi: 10.1172/JCI16603. [DOI] [PMC free article] [PubMed] [Google Scholar]
- 42.Lesinski GB, Kondadasula SV, Crespin T, Shen L, Kendra K, Walker M, Carson WE., III Multiparametric flow cytometric analysis of inter-patient variation in STAT1 phosphorylation following interferon Alfa immunotherapy. J Natl Cancer Inst. 2004;96:1331–1342. doi: 10.1093/jnci/djh252. [DOI] [PubMed] [Google Scholar]
- 43.Critchley-Thorne RJ, Yan N, Nacu S, Weber J, Holmes SP, Lee PP. Down-regulation of the interferon signaling pathway in T lymphocytes from patients with metastatic melanoma. PLoS Med. 2007;4:e176. doi: 10.1371/journal.pmed.0040176. [DOI] [PMC free article] [PubMed] [Google Scholar]
- 44.Mundy BL. Myeloid-derived suppressor cells and decreased interferon responsiveness in tumor-bearing mice. Washington, DC: International Society for Biological Therapy of Cancer; 2010. [Google Scholar]
- 45.Lesinski GB, Trefry J, Brasdovich M, Kondadasula SV, Sackey K, Zimmerer JM, Chaudhury AR, Yu L, Zhang X, Crespin TR, Walker MJ, Carson WE., III Melanoma cells exhibit variable signal transducer and activator of transcription 1 phosphorylation and a reduced response to IFN-alpha compared with immune effector cells. Clin Cancer Res. 2007;13:5010–5019. doi: 10.1158/1078-0432.CCR-06-3092. [DOI] [PubMed] [Google Scholar]
- 46.Lechner MG, Liebertz DJ, Epstein AL. Characterization of cytokine-induced myeloid-derived suppressor cells from normal human peripheral blood mononuclear cells. J Immunol. 2010;185:2273–2284. doi: 10.4049/jimmunol.1000901. [DOI] [PMC free article] [PubMed] [Google Scholar]
- 47.Michael Kutner CN, Neter J, Li W. Applied linear statistics model. 5. Irwin: McGraw-Hill; 2004. [Google Scholar]
- 48.Ko JS, Rayman P, Ireland J, Swaidani S, Li G, Bunting KD, Rini B, Finke JH, Cohen PA. Direct and differential suppression of myeloid-derived suppressor cell subsets by sunitinib is compartmentally constrained. Cancer Res. 2010;70:3526–3536. doi: 10.1158/0008-5472.CAN-09-3278. [DOI] [PMC free article] [PubMed] [Google Scholar]
- 49.Strohlein MA, Heiss MM. Intraperitoneal immunotherapy to prevent peritoneal carcinomatosis in patients with advanced gastrointestinal malignancies. J Surg Oncol. 2009;100:329–330. doi: 10.1002/jso.21338. [DOI] [PubMed] [Google Scholar]
- 50.Jaffee EM, Hruban RH, Biedrzycki B, Laheru D, Schepers K, Sauter PR, Goemann M, Coleman J, Grochow L, Donehower RC, Lillemoe KD, O’Reilly S, Abrams RA, Pardoll DM, Cameron JL, Yeo CJ. Novel allogeneic granulocyte-macrophage colony-stimulating factor-secreting tumor vaccine for pancreatic cancer: a phase I trial of safety and immune activation. J Clin Oncol. 2001;19:145–156. doi: 10.1200/JCO.2001.19.1.145. [DOI] [PubMed] [Google Scholar]
- 51.Thomas AM, Santarsiero LM, Lutz ER, Armstrong TD, Chen YC, Huang LQ, Laheru DA, Goggins M, Hruban RH, Jaffee EM. Mesothelin-specific CD8(+) T cell responses provide evidence of in vivo cross-priming by antigen-presenting cells in vaccinated pancreatic cancer patients. J Exp Med. 2004;200:297–306. doi: 10.1084/jem.20031435. [DOI] [PMC free article] [PubMed] [Google Scholar]
- 52.Hoechst B, Voigtlaender T, Ormandy L, Gamrekelashvili J, Zhao F, Wedemeyer H, Lehner F, Manns MP, Greten TF, Korangy F. Myeloid derived suppressor cells inhibit natural killer cells in patients with hepatocellular carcinoma via the NKp30 receptor. Hepatology. 2009;50:799–807. doi: 10.1002/hep.23054. [DOI] [PMC free article] [PubMed] [Google Scholar]