Abstract
A method for the separation and detection of oligonucleotides utilizing hydrophilic interaction liquid chromatography (HILIC) with inductively coupled plasma mass spectrometry (ICPMS) is described. Polythymidilic acids of various lengths (10, 15, 20 and 30 nucleotides) were separated under gradient HILIC conditions. Selective detection of oligonucleotides was possible through monitoring m/z 47, corresponding to 31P16O+, using ICPMS. Oxygen was used as a reaction gas in the collision/reaction cell to produce PO+ by reacting with phosphorus in the gas phase, thereby effectively eliminating the interferences for phosphorus normally seen at m/z 31. Limits of detection (LODs) were determined to be 1.69 pmol, 1.21 pmol, 1.0 pmol and 0.55 pmol loaded on column for the 10, 15, 20 and 30-mer, respectively.
Keywords: Elemental detection, DNA, RNA, nucleic acids, phosphorus speciation, LC-MS
INTRODUCTION
Reverse phase liquid chromatography coupled to inductively coupled plasma mass spectrometry (RP-HPLC-ICPMS) is a growing elemental speciation technique that has been applied to many sample types.1–5 Recent work from our groups demonstrated that RP-HPLC-ICPMS provides a fast and useful identification approach for oligonucleotides by utilizing the naturally occurring phosphorus as an elemental tag.6 After optimization of the capillary RP-HPLC interface with a commercial ICPMS, oligonucleotides could be detected by monitoring 31P and phosphorothioate oligonucleotides could be selectively identified by simultaneously monitoring 31P and 32S with limits of detection as low as 16 fmol for a 24-mer phosphorothioate oligonucleotide.
Traditionally, LC separation of oligonucleotides, especially those analyzed in trityl-off condition, has been performed using reverse-phase ion-pairing chromatography. The ion-pairing agents are typically volatile salts of ammonium, with triethylammonium acetate being among the most popular due to its compatibility with mass spectrometry detection.7–11 Ion-pairing agents interact with the negatively charged phosphodiester backbone, allowing for an increase in hydrophobic-based separations on a reverse-phase column.
While low amounts of ion-pairing agents can be tolerated by mass spectrometry, when oligonucleotides are to be separated and analyzed by LC-MS, there is a trade-off between LC separation and MS detection. An increase in ion-pairing agent concentration will increase the resolution obtained during oligonucleotide separations, but the cost is a reduction in sensitivity for MS detection. Apffel and coworkers proposed adding hexafluoroisopropanol (HFIP) to the LC mobile phase to overcome the limitation of reduced MS sensitivity when electrospray ionization (ESI) was used.12, 13
Although not new, hydrophilic interaction liquid chromatography (HILIC) has been proposed as an alternative to RP-HPLC for the separation of polar biomolecules.14 HILIC is a chromatographic technique that is based on the interaction between the analyte of interest and a hydrophilic stationary phase. One of the defining characteristics of HILIC is that water serves as the strong eluent.15 HILIC allows for separation of polar analytes with no organic modifiers and typically no ion pairing agent. Somewhat surprisingly, published methods using HILIC for the separation of oligonucleotides are rare.15–17 Alpert separated polythymidylic acids ranging from 12-mers to 30-mers on a Polyhydroxyethyl A column using a triethylammonium phosphate buffer.15 More recently, Holdšvendová and coworkers tested hydroxymethyl methacrylate-based monolithic columns that they designed to separate oligonucleotides by capillary HILIC.17 They demonstrated the successful separation of three oligonucleotides (15-mer, 19-mer and 20-mer) using triethylammonium acetate buffers.
There are only a few reports describing the coupling of HILIC with ICPMS,18–24 and no reports describing HILIC-ICPMS for the analysis of oligonucleotides. There are specific concerns that can arise when LC methods, either RP or HILIC, are coupled to ICPMS. As the ionization step in ICPMS first requires vaporization and atomization of the sample solution, the use of high amounts of organic solvents can lead to plasma instability and carbon deposition on the interface cones. Since the separation of oligonucleotides using ion-pairing RP-HPLC or HILIC typically requires high concentrations of organic solvent or buffer to elute the sample from the column, care must be taken to reduce the overall volume of HPLC eluent introduced into the ICP source. For all of these reasons, identifying HPLC conditions that are capable of separating oligonucleotides while preserving ICPMS sensitivity is a challenge in developing a HILIC-ICPMS method.
In the present study, we have identified instrumental and experimental conditions for HILIC separation of oligonucleotides with detection via on-line ICPMS. Different column stationary phases were compared to identify the most reproducible HILIC conditions, and the use of oxygen in the collision reaction cell of the ICPMS enabled the sensitive detection of phosphorus, from the oligonucleotide phosphodiester backbone, as phosphorus oxide. Under these conditions, mixtures of polythymidylic acids could be separated by HILIC and detected by monitoring m/z 47, corresponding to 31P16O+, using ICPMS. This new method should enable further applications of both HILIC and ICPMS for the selective detection of phosphorus containing oligonucleotides, especially for assays requiring the quantitative determination of oligonucleotides.
EXPERIMENTAL
Materials
HPLC grade acetonitrile was from Tedia Company Inc. (Fairfield, OH, USA). Reagent grade ammonium acetate and glacial acetic acid were from Fisher Scientific (Springfield, NJ, USA). Burdick and Jackson high purity acetonitrile and methanol were from Honeywell (Morristown, NJ, USA). Oligonucleotides (dT10, dT15, dT20 and dT30) were obtained from Bioneer (Alameda, CA, USA) and used as received.
Instrumentation
Chromatographic analysis was performed on an Agilent Technologies 1200 capillary HPLC system (Santa Clara, CA, USA) equipped with a binary pump, vacuum chambered micro-degasser and a thermostatically controlled well plate sampler and column compartment plus a diode array detector with a 5 µl flow cell. This capillary system was converted to a microbore system by using the 0.1–2.5 ml min−1 Flow Capillary Kit supplied by Agilent Technologies. The electronic flow control was bypassed and the line from the electromagnetic proportioning valve EMPV to the six port valve was replaced with a 170 µm i.d. line. The line from the six port valve going to the column was replaced with a 100 µm i.d. line. The lines connecting the column through the UV detector and then to the ICPMS were also replaced by 100 µm i.d. lines. These changes allowed for a flow rate of 100 µl min−1 with no pressure increases.
The ICPMS used in this study was an Agilent 7500cx from Agilent Technologies (Santa Clara, CA, USA) equipped with an on-axis rf only octopole collision reaction cell. The flow manifold used for oxygen addition has a flow maximum of 1 ml min−1 and is expressed as a percentage of the maximum. The organic parts kit supplied from Agilent Technologies was used to couple the HPLC to the ICPMS. The kit included an organic torch, platinum sample cone and a brass lens base. The organic torch has a smaller internal path which directs the analytes into the center of the plasma where they are more easily ionized; the platinum sample cone was used because it is less inert than the nickel cones typically used; and the brass lens base helps with the heat transfer. Oxygen was added pre-torch and in the collision reaction cell to prevent carbon buildup. An m/z of 47, corresponding to 31P16O+, was monitored. Instrument parameters can be found in Table 1. All data analysis was performed using the Agilent chromatographic software package.
Table 1.
Instrumental parameters for HPLC and ICPMS systems.
| HPLC Parameters | Settings |
|---|---|
| Column flow rate | 100 µl min−1 |
| Column temperature | 30 °C |
| Mobile phase A | 5mM Ammonium Acetate in water, pH 5.8 |
| Mobile Phase B | Acetonitrile, HPLC grade |
| Gradient separation | 15–30% A from 0–2.5 min., 30–60% A from 2.5–17.5 min. |
| DAD wavelength | 269 nm, slit 4 nm, reference bandwidth 6 nm |
| ICPMS Parameters | |
| Spray Chamber | Scott double pass total consumption spray chamber |
| Chamber temperature | 2 °C |
| Interface cones | Pt sample cone, Ni skimmer cone |
| Plasma power | 1550 V |
| RF matching | 1.82 V |
| Plasma gas flow | 15 L min−1 |
| Optional gas flow | 8 % Oxygen |
| Collision reaction cell optional gas | 10% Oxygen |
| Quadrupole bias | −8 V |
| Octopole bias | −1 V |
HILIC Separations
A Luna HILIC column from Phenomenex A and a TSKgel Amide-80 column from TOSOH Bioscience (Montgomeryville, PA, USA), both 150 mm × 2 mm i.d. with 3 µm particle size, were used. Oligonucleotides in water were mixed in equimolar amounts and diluted with 75%/25% acetonitrile:methanol. Next, 5 µl of this mixture was injected onto the column and separated under gradient conditions. Various mobile phases were investigated. Solvent B was acetonitrile in all cases. Solvent A was typically a 5 mM – 10 mM ammonium or sodium salt in water. Optimized gradient conditions were found, with the gradient starting at 15 %A, a ramp to 30 %A at 6 % min−1 followed by another ramp from 30–60 %A at 2% min−1. A rapid re-equilibration step back to 15 %A was then applied for 150 sec at ~ 30% min−1. Regeneration of the column before subsequent injections was found to be column dependent, with a minimum of 10 min required for the TSKgel Amide-80 column and significantly longer times needed for the Luna column.
RESULTS AND DISCUSSION
Optimization of HILIC Separation of Oligonucleotides
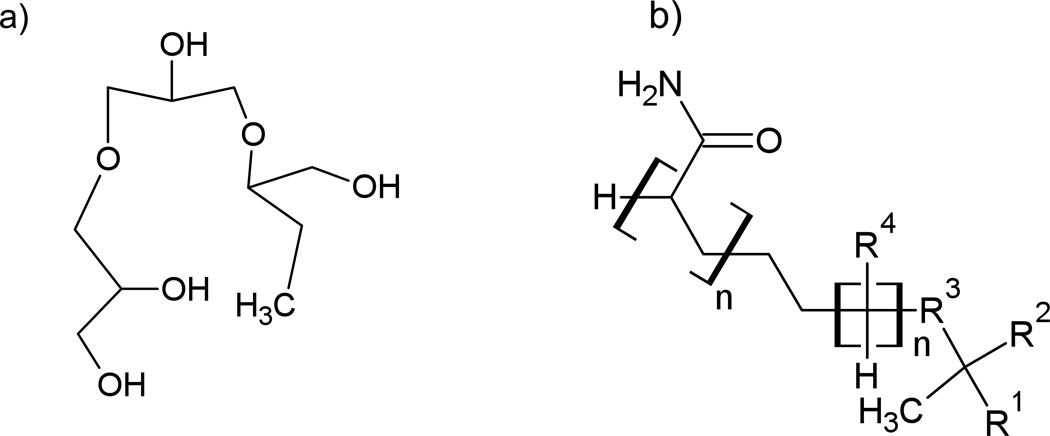
Two columns were tested for oligonucleotide separation under HILIC conditions. The first column was the Luna HILIC column from Phenomenex and the second was the TSKgel Amide-80 column from TOSOH Bioscience. The Luna column has a crossed diol functional group on a silica stationary phase, while the TSKgel Amide-80 column has an amide functional group on a silica stationary phase (Figure 1). The TSKgel Amide-80 column has been widely used in the literature for a variety of analytes.15, 25, 26 The carbonyl group on the stationary phase allows for a novel hydrogen bonding mechanism to occur. The Luna column is a more recently developed HILIC column that offers a neutral stationary phase that allows a water-rich layer to readily form on the surface.
Figure 1.
Structures of a) cross linked diol and b) TSK-gel amide 80.
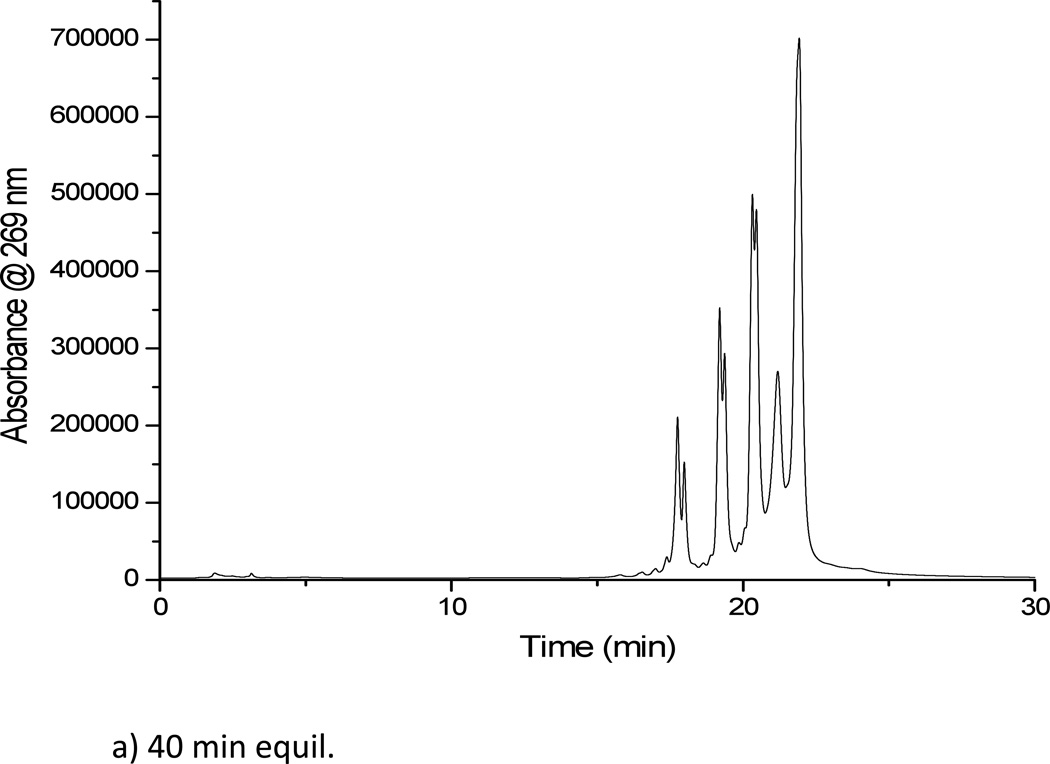
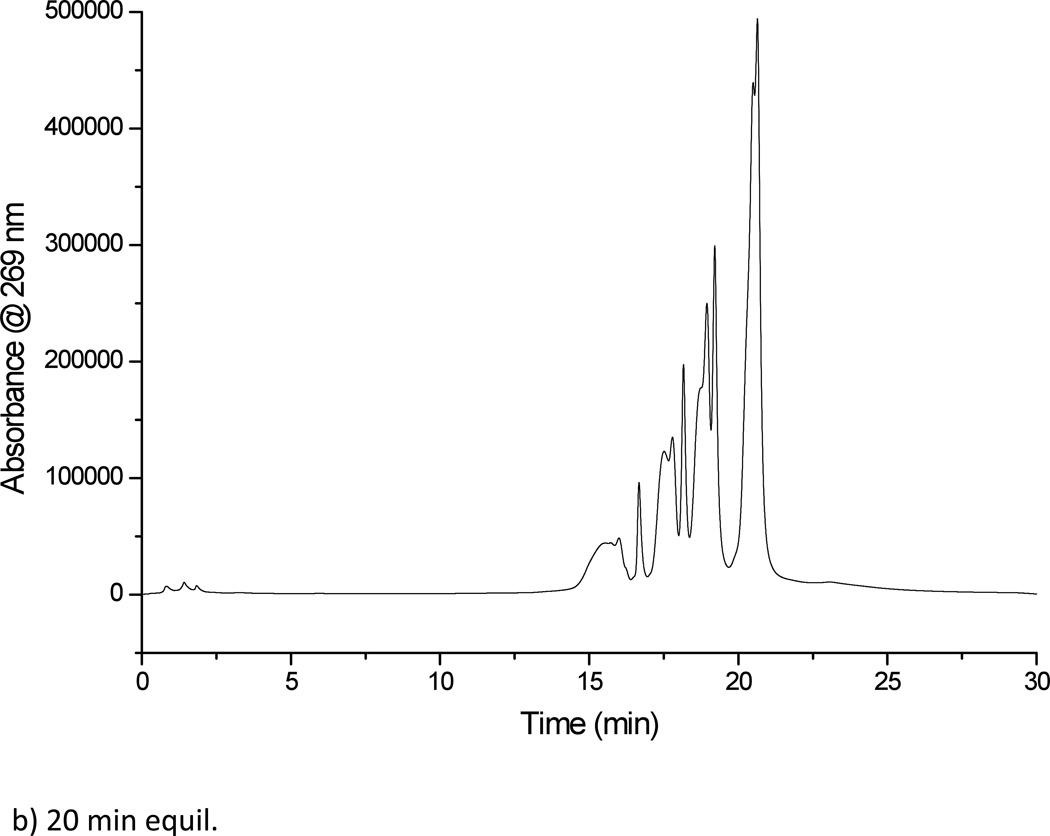
The first column investigated was the Luna column with a crossed diol functional group, with detection performed using UV spectroscopy. This column enabled the separation of the mixture of polythymidylic acids (Figure 2a), under the mobile phase conditions described. Replicate injections of this mixture of oligonucleotides allowed the determination of the figures of merit for this HILIC column (Table 2). As seen from the data in this table, the crossed diol stationary phase resulted in low peak area reproducibility. This low reproducibility is likely due to peak splitting that was seen throughout multiple injections. The crossed diol stationary phase required reconditioning periods of at least 30 min (Figure 2b) leading to total analysis periods of 1 h per sample to minimize peak splitting. Based on the low reproducibility and long reconditioning periods for the crossed diol stationary phase, no further evaluation of the Luna column was pursued.
Figure 2.
(a) Separation of dT10, dT15, dT20 and dT30 on the Luna crossed diol HILIC column, solvent A: 5 mM ammonium acetate pH 5.8. Solvent B: acetonitrile (b) Separation of dT10, dT15, dT20 and dT30 on the Luna crossed diol HILIC column after a 20 min reconditioning period. This column did not yield reproducible separations even after 40 min reconditioning periods.
Table 2.
Figures of merit for oligonucleotide (12.5 pM) separation on the Luna crossed diol column.
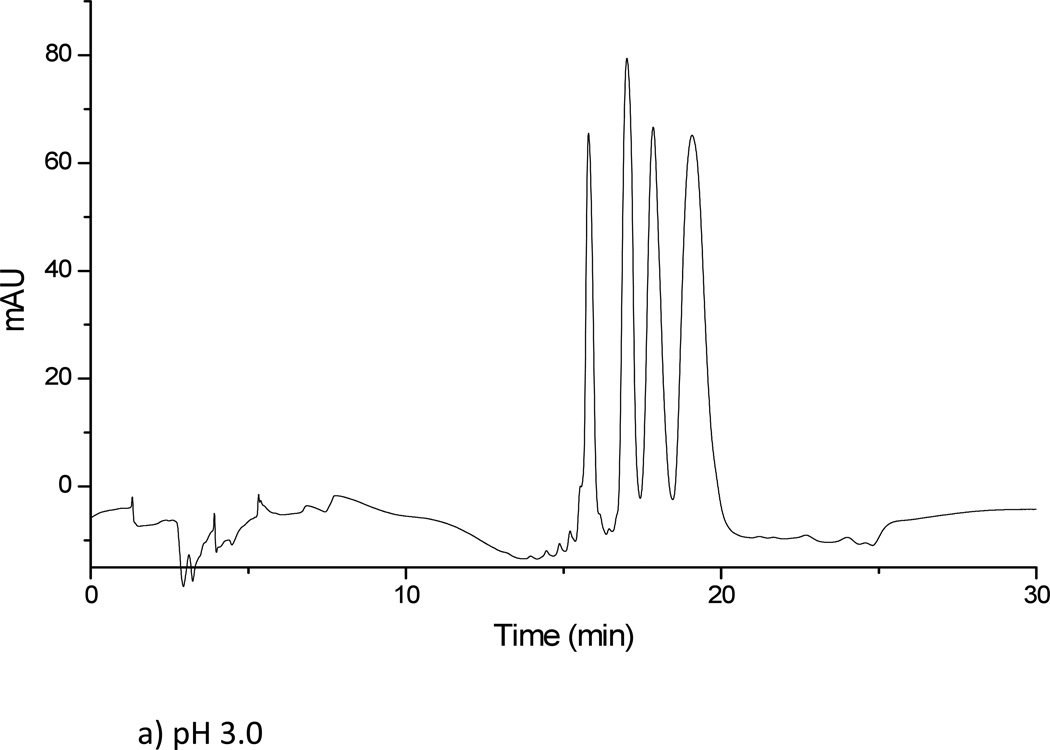
All remaining studies were conducted using the TSKgel Amide-80 column. The initial focus was to determine appropriate mobile phase conditions for the separation of the oligonucleotide mixture. Ammonium formate, ammonium acetate and sodium propionate were examined for their ability to separate the mixture of dT10, dT15, dT20 and dT30. Previous studies have shown that the use of salts within a HILIC mobile phase improves the separation of oligonucleotides.15–17 For all experiments, acetonitrile was used as solvent B. Solvent A was a 5 mM or 10 mM ammonium or sodium salt solution prepared at two pH values (3.0 and 5.8).
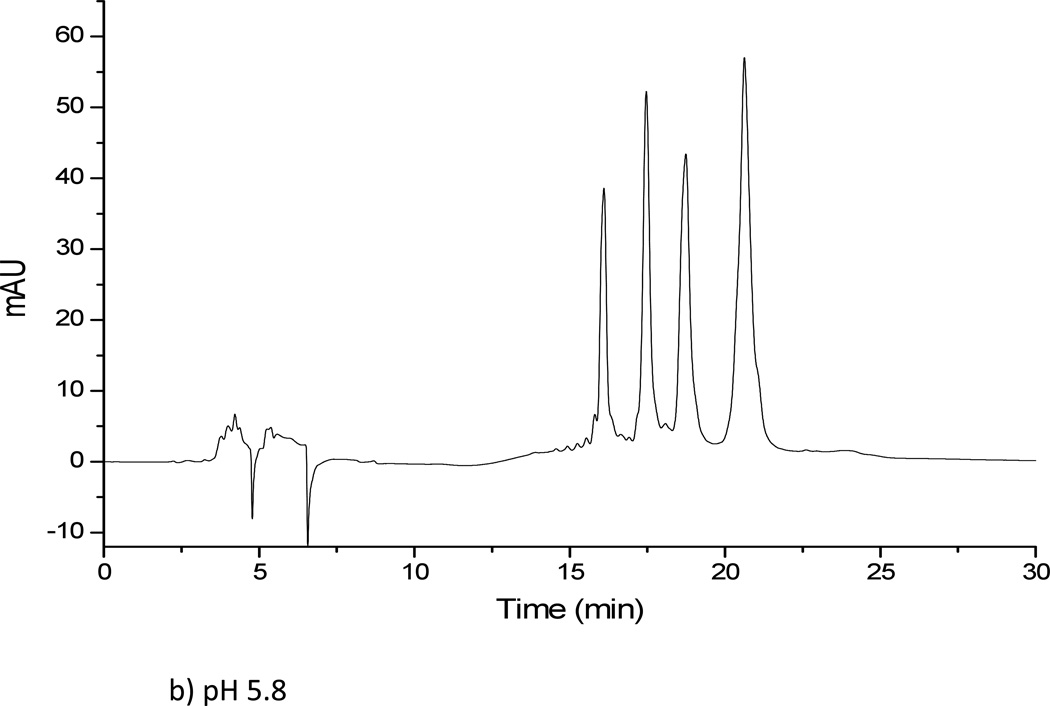
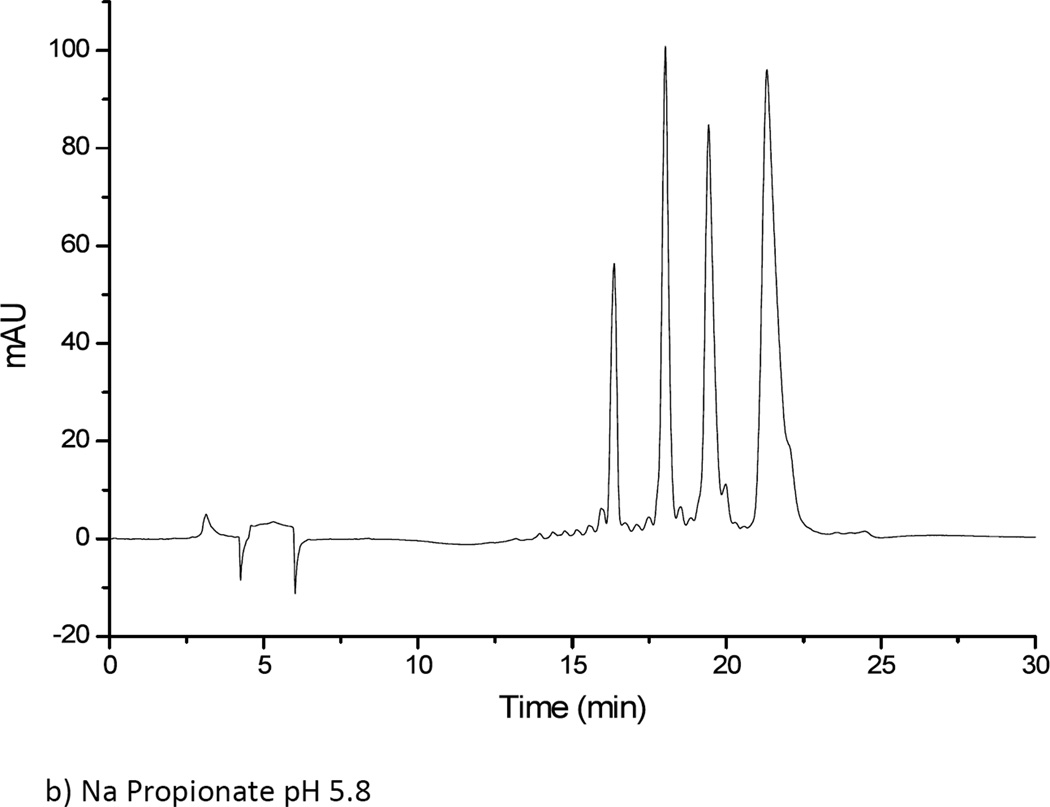
Results obtained from using a 5 mM ammonium formate solution at two pH values (3.0 and 5.8) for solvent A were unsatisfactory. The oligonucleotide samples were not eluted from the amide column using ammonium formate at either pH value, regardless of the gradient conditions investigated. When ammonium formate was replaced by ammonium acetate, significantly different results were obtained. Both 5 mM and 10 mM ammonium acetate solutions at two pH values (3.0 and 5.8) were investigated. For all ammonium acetate solutions, all four oligonucleotides in the mixture could be eluted and separated (Figure 3). The 5 mM ammonium acetate solution was found to yield better resolved peaks than the 10 mM ammonium acetate solution, although the difference in resolution between the two concentrations was minor overall. To further examine whether the counter ion effects analyte separation, next solutions of sodium propionate were investigated. A 5 mM sodium propionate solution at pH of 5.8 was tested for the oligonucleotide separation under the same gradient conditions as before. Overall, minimal differences were seen as compared to the 5 mM ammonium acetate solution at pH 5.8. Because ammonium salts are more compatible with mass spectrometry and because the propionate counter ion did not significantly affect analyte retention, the HILIC buffer solution consisting of 5 mM ammonium acetate at pH 5.8 was used for all further investigations.
Figure 3.
Separation of dT10, dT15, dT20 and dT30 on TSK-gel amide 80 column. (a) Solvent A: 5 mM ammonium acetate pH 3. (b) Solvent A: 5 mM ammonium acetate pH 5.8. (c) Solvent A: 5 mM sodium propionate pH 5.8. Solvent B was acetonitrile in all cases.
Using the optimized mobile phase conditions, replicate injections of the oligonucleotide mixture were performed to determine the figures of merit for the gel amide HILIC column (Table 3). In comparison to the crossed diol stationary phase, the gel amide column exhibited higher resolution, lower retention times, and more reproducible measurements of both the peak areas for each component as well as their individual retention times. The reconditioning period for the gel amide column was also evaluated. Experimentally, no differences in oligonucleotide separation and individual peak shapes were found over the range of 10 min up to 40 min reconditioning (data not shown). A column regeneration time of 20 minutes was used to ensure full equilibration for the TSK gel Amide-80 column.
Table 3.
Figures of merit for oligonucleotide(5 pM) separation on the TSK gel amide column.
| Analyte dTn |
Capacity Factor |
Resolution | Average Retention time |
%RSDa | Average Area |
%RSDa |
|---|---|---|---|---|---|---|
| 10 | 3.22 | 58.63 | 16.2 | 1.03 | 89 | 4.55 |
| 15 | 3.58 | 5.73 | 17.6 | 1.02 | 124 | 6.16 |
| 20 | 3.91 | 4.06 | 18.8 | 0.94 | 135 | 1.49 |
| 30 | 4.43 | 4.94 | 20.9 | 0.87 | 233 | 3.56 |
n=3
HILIC Separation Mechanism for Oligonucleotides
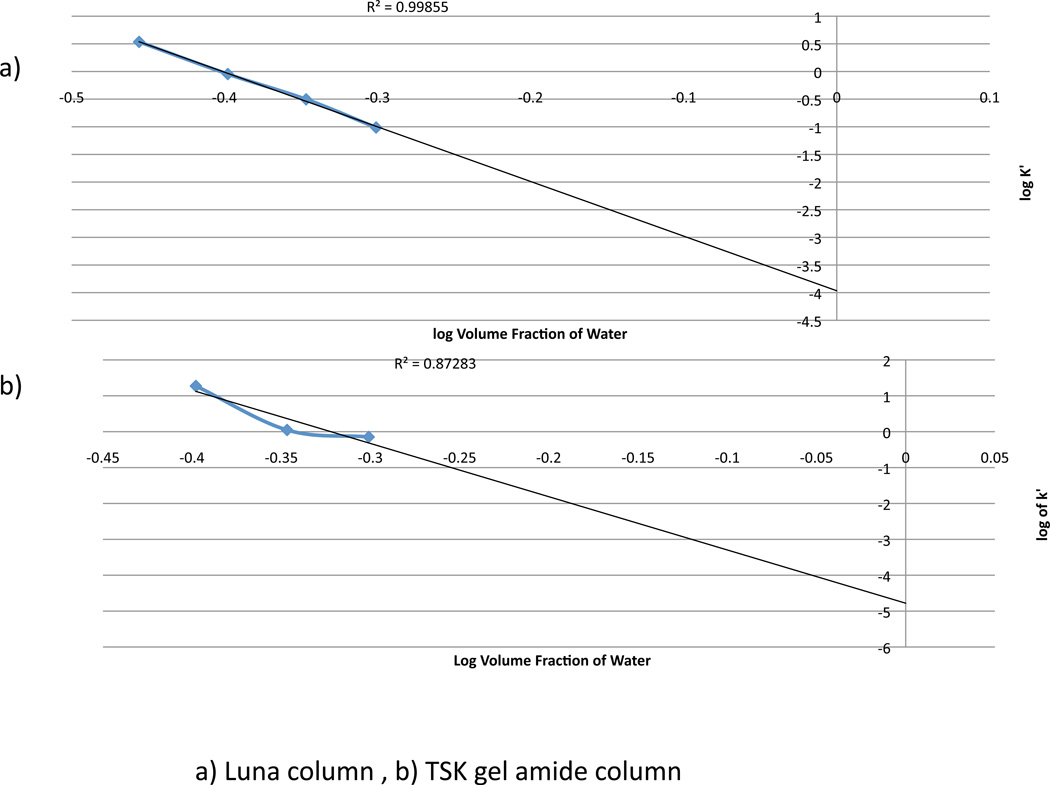
Previously Alpert proposed that the following conditions must both be present in the separation for the mode to be considered HILIC: water is the stronger eluent and retention must be by partitioning.15 Thus, it was of interest here to confirm whether the HPLC conditions utilized were consistent with a HILIC mode of separation. Plots of log k’ for each analyte versus the percent of water in the mobile phase and log k’ versus the log percent of water in the mobile phase were created for both HILIC columns, under isocratic conditions, to determine whether a partitioning mechanism was present in the separation (Figure 4). Linear log-log plots are more consistent with an adsorptive mechanism.14 For the Luna HILIC column, the plot of log k’ versus log of percent of water in the mobile phase did result in a linear fit between 45 and 55 percent water in the mobile phase. Around 45% water composition in the mobile phase, there is a slight curvature of the line suggesting that a partitioning mechanism is taking hold as the column becomes saturated. For the amide column the log-log plot did not fit the adsorptive mechanism, suggesting that a partition mechanism is involved during oligonucleotide separation using this column. However, it is possible that during gradient elution, using the conditions optimized in this study, elution at higher amounts of water (>55 percent water in the mobile phase), the adsorptive mechanism may be more prevalent and the separation will fall under conditions more common in reversed-phase chromatography.
Figure 4.
(a) Plot of log k’ versus log % water content for the crossed diol column. This log-log plot yields an R2 value of 0.9985, which suggests that adsorption is dominating the separation of the oligonucleotides. (b) Plot of log k’ versus log % water content for the gel amide column. This plot is linear until around 40% water, which indicates that a partitioning mechanism is present during the separation.
Temperature Effects
The effect of column temperature on the separation of polythymidylic acids was also examined for the TSKgel Amide-80 column. A slight increase in temperature from 25 °C to 30 °C decreased the detected peak widths, although further increases in temperature did not lead to further improvements in peak shapes or resolution.
Optimization of HILIC-ICPMS
Once appropriate HILIC conditions were found, we then sought to couple this chromatographic approach to an Agilent ICP mass spectrometer to evaluate the effectiveness of HILIC-ICPMS for oligonucleotide separation and detection. It was necessary to modify the Agilent 1200 HPLC system to handle the higher flow rate of 100 µl min−1 from the microbore column. With these modifications, the HPLC could then be coupled to the ICP mass spectrometer. Coupling was made between the HPLC column and the ICP nebulizer using 100 µm id tubing, which reduced extra-column band-broadening. Because HILIC separations utilize water as the stronger eluent in gradient separations, oxygen was added before the ICP torch to account for the relatively high amount of acetonitrile (85%) at the start of the gradient. The addition of oxygen to the plasma is necessary to prevent carbon buildup on the cones at the interface of the ICP mass spectrometer when using HPLC mobile phases containing high levels of organic solvents. The addition of oxygen here results in the combustion of acetonitrile, leaving only carbon dioxide, water vapor and nitrogen gas.27, 28 The plasma for the ICP mass spectrometer was tuned for organics by increasing the plasma power and adjusting the rf matching. It was found that as the water increases in the gradient the background also increases because of changing plasma conditions.
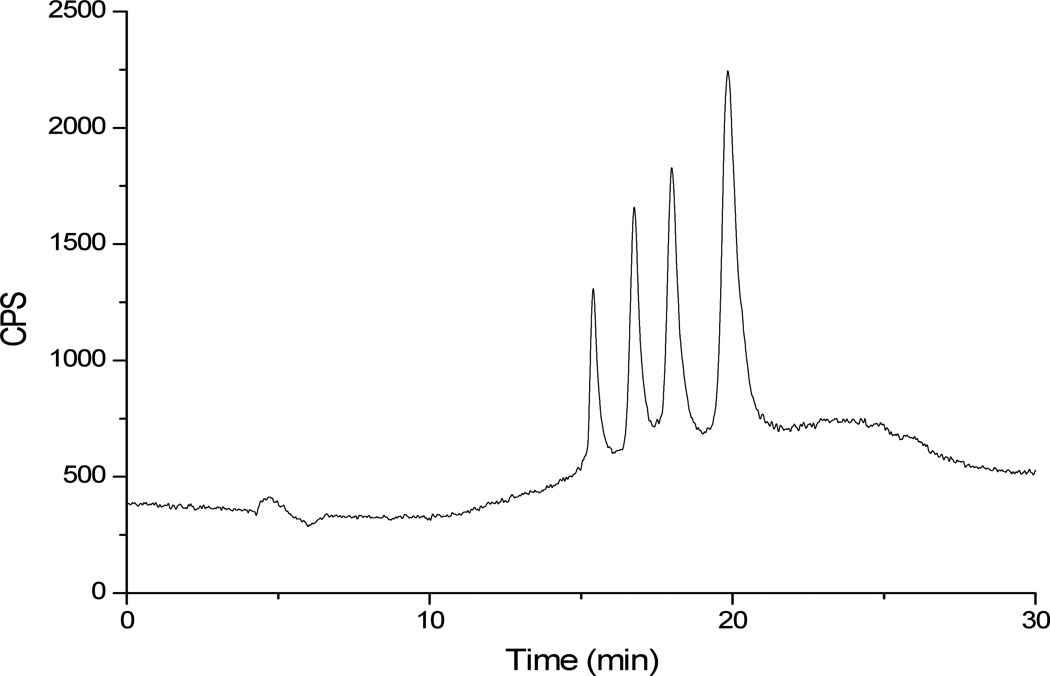
Oxygen was also used as a reaction gas in the collision reaction cell (CRC). Detection of oligonucleotides, which contain phosphodiester linkages between repeating units of this biopolymer, was performed at an m/z ratio of 47, which corresponds to 31P16O+ (Figure 5). The percent oxygen in the CRC was optimized for detection of m/z 47 and found to be 10%. It was found that at oxygen percentages in the CRC higher than that value, the background at m/z 47 increased and the overall signal corresponding to 31P16O+ decreased.
Figure 5.
HILIC-ICPMS separation and detection of dT10, dT15, dT20 and dT30 using TSK-gel amide 80 column. Solvent A: 5 mM ammonium acetate, pH 5.8; Solvent B: acetonitrile. Oligonucleotides were detected by monitoring m/z 47 (PO+). The increase in baseline towards the end of the gradient is due to the increasing water content in the mobile phase. The plasma was tuned for organic and thus reacts differently when more water is present.
Figures of merit for coupling HILIC with ICPMS are shown in Table 4. As can be seen, run-to-run reproducibility is high, which was also found for day-to-day reproducibility (data not shown). Percent RSDs are all based on three sequential injections. Limits of detection (LODs) and limits of quantitation (LOQs) were also determined for the method using the IUPAC definition of 3σ (LOD) and 10σ (LOQ) divided by the slope of the calibration curve. LODs were found to be 1.69 pmol, 1.21 pmol, 1.0 pmol and 0.55 pmol on-column injection for the 10, 15, 20, and 30-mer, respectively. Collectively, these LODs correspond to several nanograms of sample injected on-column. Likewise, LOQs were determined and found to be 5.63 pmol, 4.05 pmol, 3.34 pmol, and 1.83 pmol on-column injection for the 10, 15, 20, and 30-mer, respectively.
Table 4.
Figures of merit for HILIC-ICPMS separation of polythymidilic acids. LOD and LOQs were determined based on the IUPAC definition of 3σ and 10σ, respectively, divided by the slope of the calibration curve.
| Analyte | Capacity Factor |
Resolution | # of plates |
Average Retention Time |
%RSDa | Average Area |
%RSDa |
|---|---|---|---|---|---|---|---|
| 10 | 2.27 | 23.04 | 80.2 | 15.4 | 0.28 | 150499 | 4.42 |
| 15 | 2.57 | 4.00 | 96.7 | 16.8 | 0.06 | 223952 | 3.04 |
| 20 | 2.83 | 3.09 | 89.0 | 17.9 | 0.06 | 287628 | 1.68 |
| 30 | 3.22 | 3.53 | 98.0 | 19.8 | 0.16 | 562153 | 2.05 |
n=3
As oligonucleotides size increases, the limit of detection decreases. In this case, this is due to the increasing number of phosphorus atoms that are present in the oligonucleotide. For ICPMS, phosphorus is a monoisotopic element that has a common interference with NOH+, an ion commonly created in the plasma. This interference is corrected differently by each manufacturer. Phosphorus can be detected as low as 0.06 ng/ml using an axial field dynamic reaction cell ICPMS29 and 0.02 ng/ml using a sector field ICPMS.30 When using a reaction gas, such as oxygen, phosphorus can be detected as low as 0.06 ng/ml as phosphorus oxide (m/z 47). When coupling HILIC with ICPMS, the high organic composition of the mobile phase does decreases the sensitivity. A detection limit of 0.336 ng/ml for a 30-mer oligonucleotide was determined in this study when the oligonucleotide is detected via the phosphorus oxide, 31P16O+. While an order of magnitude higher than typically found for other ICPMS based analyses of phosphorus, these initial results demonstrate that HILIC can be coupled directly to ICPMS to enable the separation and detection of oligonucleotides. It would be of interest to determine if electrostatic repulsion hydrophilic interaction liquid chromatography (ERLIC) would result in even lower detection limits when coupled to ICPMS due to the reduction in initial organic solvent required for oligonucleotide elution.16
Mitchell and co-workers have reported a general comparison of HILIC separations to RP-HPLC separations using ESI-MS and found that HILIC separations are typically 5–10 times more sensitive when coupled with ESI-MS than were the RP-HPLC separations.31 To date, there are no published studies examining the performance of HILIC combined with electrospray ionization mass spectrometry (ESIMS) for the separation and detection of oligonucleotides. Thus, a comparison of the limits of detection for our HILIC-ICPMS method to the HILIC-ESIMS method is not possible. Typical LODs for LC-ESI-MS analyses of oligonucleotides are on the order of fmol µL−1,32 which corresponds to ng mL−1 detection limits for intact oligonucleotides. Whether further reductions in the LODs reported here are possible likely depends on the influence of the organic component of the mobile phase on the ICP process.
CONCLUSION
It was found that HILIC-ICPMS is an effective method for the separation and detection of oligonucleotides. The four oligonucleotides utilized in these experiments, dT10, dT15, dT20 and dT30, were all separated under gradient conditions without any organic modifiers, such as HFIP, in less than 25 min. Oligonucleotides can be detected directly using ICPMS by monitoring phosphorus oxide, which enables future developments of quantitative assays to characterize mixtures of oligonucleotides. Of particular note, the present method should also be readily applicable to modified oligonucleotides such as phosphorothioate oligonucleotides, which can be detected via both phosphorus and sulfur using the CRC-based oxide method presented here. Further refinements in HILIC separation conditions will be necessary to resolve oligonucleotides that differ by one or two nucleotide residues. Finally, HILIC-ICPMS may be particularly beneficial when applied to the quantitative characterization of phosphorothioate synthesis by- and side-products,33 and future developments in this area are planned.
ACKNOWLEDGMENTS
Financial support for this work was provided by the National Institutes of Health (GM58843 to Patrick A. Limbach) and Pfizer Pharmaceuticals Global Research Development Fund (SRS 00566 to Patrick A. Limbach). The authors are grateful to Agilent Technologies for the loan of the ICPMS instrumentation used in this study.
REFERENCES
- 1.Wind M, Edler M, Jakubowski N, Linscheid M, Wesch H, Lehmann WD. Analytical Chemistry. 2001;73:29–35. doi: 10.1021/ac0009595. [DOI] [PubMed] [Google Scholar]
- 2.Krüger R, Kübler D, Pallissé R, Burkovski A, Lehmann WD. Analytical Chemistry. 2006;78:1987–1994. doi: 10.1021/ac051896z. [DOI] [PubMed] [Google Scholar]
- 3.Sarmiento-González A, Encinar J, Cantarero-Roldán A, Marchante-Gayón J, Sanz-Medel A. Anal Chem. 2008;80:8702–8711. doi: 10.1021/ac801029p. [DOI] [PubMed] [Google Scholar]
- 4.Ellis J, Grimm R, Clark J, Pyne-Gaithman G, Wilbur S, Caruso J. J Proteome Res. 2008;7:4736–4742. doi: 10.1021/pr800294r. [DOI] [PMC free article] [PubMed] [Google Scholar]
- 5.Afton S, Catron B, Caruso J. J Exp Bot. 2009;60:1289–1297. doi: 10.1093/jxb/erp003. [DOI] [PMC free article] [PubMed] [Google Scholar]
- 6.Lokits KE, Limbach PA, Caruso JA. Journal of Analytical Atomic Spectrometry. 2009;24:528–534. [Google Scholar]
- 7.Gilar M, Fountain KJ, Budman Y, Neue UD, Yardley KR, Rainville PD, Russell Ii RJ, Gebler JC. J Chromatogr A. 2002;958:167–182. doi: 10.1016/s0021-9673(02)00306-0. [DOI] [PubMed] [Google Scholar]
- 8.Huber CG, Oberacher H. Mass Spectrom Rev. 2001;20:310–343. doi: 10.1002/mas.10011. [DOI] [PubMed] [Google Scholar]
- 9.Oberacher H, Huber CG, Oefner PJ. Hum Mutat. 2003;21:86–95. doi: 10.1002/humu.10155. [DOI] [PubMed] [Google Scholar]
- 10.Oberacher H, Niederstatter H, Parson W. Int J Legal Med. 2007;121:57–67. doi: 10.1007/s00414-006-0117-7. [DOI] [PubMed] [Google Scholar]
- 11.Premstaller A, Oberacher H, Huber CG. Anal Chem. 2000;72:4386–4393. doi: 10.1021/ac000283d. [DOI] [PubMed] [Google Scholar]
- 12.Apffel A, Chakel JA, Fischer S, Lichtenwalter K, Hancock WS. J Chromatogr A. 1997;777:3–21. doi: 10.1021/ac960916h. [DOI] [PubMed] [Google Scholar]
- 13.Apffel A, Chakel JA, Fischer S, Lichtenwalter K, Hancock WS. Anal. Chem. 1997;69:1320–1325. doi: 10.1021/ac960916h. [DOI] [PubMed] [Google Scholar]
- 14.Hemstrom P, Irgum K. J. Sep. Sci. 2006;29:1784–1821. doi: 10.1002/jssc.200600199. [DOI] [PubMed] [Google Scholar]
- 15.Alpert AJ. J Chromatogr. 1990;499:177–196. doi: 10.1016/s0021-9673(00)96972-3. [DOI] [PubMed] [Google Scholar]
- 16.Alpert AJ. Anal Chem. 2008;80:62–76. doi: 10.1021/ac070997p. [DOI] [PubMed] [Google Scholar]
- 17.Holdsvendova P, Suchankova J, Buncek M, Backovska V, Coufal P. J Biochem. Biophys. Met. 2006;70:23–29. doi: 10.1016/j.jbbm.2006.11.003. [DOI] [PubMed] [Google Scholar]
- 18.Kesava Raju CS, Cossmer A, Scharf H, Panne U, Lück D. Journal of Analytical Atomic Spectrometry. 2010;25:55–61. [Google Scholar]
- 19.Falta T, Koellensperger G, Standler A, Buchberger W, Mader RM, Hann S. Journal of Analytical Atomic Spectrometry. 2009;24:1336–1342. [Google Scholar]
- 20.Künnemeyer J, Terborg L, Meermann B, Brauckmann C, Möller I, Scheffer A, Karst U. Environmental Science and Technology. 2009;43:2884–2890. doi: 10.1021/es803278n. [DOI] [PubMed] [Google Scholar]
- 21.Xie D, Mattusch J, Wennrich R. Engineering in Life Sciences. 2008;8:582–588. [Google Scholar]
- 22.Dernovics M, Lobinski R. Analytical Chemistry. 2008;80:3975–3984. doi: 10.1021/ac8002038. [DOI] [PubMed] [Google Scholar]
- 23.Nygren Y, Hemström P, Astot C, Naredi P, Björn E. J. Anal. At. Spectrom. 2008;23:948–954. [Google Scholar]
- 24.Hemström P, Nygren Y, Björn E, Irgum K. J. Sep. Sci. 2008;31:599–603. doi: 10.1002/jssc.200700480. [DOI] [PubMed] [Google Scholar]
- 25.Kuraya N, Hase S. Analytical Biochemistry. 1996;233:205–211. doi: 10.1006/abio.1996.0029. [DOI] [PubMed] [Google Scholar]
- 26.Strege MA. Analytical Chemistry. 1998;70:2439–2445. doi: 10.1021/ac9802271. [DOI] [PubMed] [Google Scholar]
- 27.Evans EH, Ebdon L. J. Anal. At. Spectrom. 1989;4:299–300. [Google Scholar]
- 28.Xie D, Mattusch J, Wennrich R. Eng. Life Sci. 2008;8:582–586. [Google Scholar]
- 29.Bandura D, Baranov V, Tanner S. Anal Chem. 2002;74:1497–1502. doi: 10.1021/ac011031v. [DOI] [PubMed] [Google Scholar]
- 30.Becker J, Boulyga S, Pickhardt C, Becker J, Buddrus S, Przybylski M. Anal Bioanal Chem. 2003;375:561–566. doi: 10.1007/s00216-002-1737-5. [DOI] [PubMed] [Google Scholar]
- 31.Mitchell CR, Bao Y, Benz NJ, Zhang S. Journal of Chromatography B: Analytical Technologies in the Biomedical and Life Sciences. 2009;877:4133–4139. doi: 10.1016/j.jchromb.2009.10.027. [DOI] [PubMed] [Google Scholar]
- 32.Oberacher H, Niederstätter H, Parson W. Journal of Mass Spectrometry. 2005;40:932–945. doi: 10.1002/jms.870. [DOI] [PubMed] [Google Scholar]
- 33.Nikcevic I, Wyrzykiewicz TK, Limbach PA. Int. J. Mass Spectrom. 2010 doi: 10.1016/j.ijms.2010.06.001. in press. [DOI] [PMC free article] [PubMed] [Google Scholar]


