

Abstract
Only one low‐density lipoprotein cholesterol (LDL‐C) genome‐wide association study (GWAS) has been previously reported in ‐African Americans. We performed a GWAS of LDL‐C in African Americans using data extracted from electronic medical records (EMR) in the eMERGE network. African Americans were genotyped on the Illumina 1M chip. All LDL‐C measurements, prescriptions, and diagnoses of concomitant disease were extracted from EMR. We created two analytic datasets; one dataset having median LDL‐C calculated after the exclusion of some lab values based on comorbidities and medication (n= 618) and another dataset having median LDL‐C calculated without any exclusions (n= 1,249). SNP rs7412 in APOE was strongly associated with LDL‐C in both datasets (p < 5 × 10⁻⁸). In the dataset with exclusions, a decrease of 20.0 mg/dL per minor allele was observed. The effect size was attenuated (12.3 mg/dL) in the dataset without any lab values excluded. Although other signals in APOE have been detected in previous GWAS, this large and important SNP association has not been well detected in large GWAS because rs7412 was not included on many genotyping arrays. Use of median LDL‐C extracted from EMR after exclusions for medications and comorbidities increased the percentage of trait variance explained by genetic variation. Clin Trans Sci 2012; Volume 5: 394–399
Keywords: GWAS, LDL, electronic medical records
Introduction
Several genome‐wide association studies (GWAS) of low‐density lipoprotein cholesterol (LDL‐C) have been published in the past 3 years; the NHGRI Catalog of published GWAS 1 currently lists at least 11 studies under the search term “LDL Cholesterol.” The largest LDL‐C GWAS, by Teslovich et al., 2 presents a GWAS meta‐analysis of 46 lipid GWAS including 95,454 individuals with LDL‐C measurements. This meta‐analysis detected 37 loci significantly (p < 5 × 10⁻⁸) associated with LDL‐C which, combined together, accounted for 12.2% of LDL‐C trait variance in the Framingham Heart Study. 2 However, the Teslovich meta‐analysis included primarily only individuals of European ancestry. Although Teslovich and others have examined SNPs detected in European‐ancestry GWAS in other ethnic groups including African Americans, only one LDL‐C GWAS study in African American adults has been published. In this analysis of 8,090 African Americans from the CARe consortium, eight signals from previous European‐ancestry LDL‐C GWAS were replicated and one novel LDL‐C association, for SNP rs13161895 on chromosome five, was reported. 3
The eMERGE network has been established to link phenotypes from electronic medical records (EMR) with genetic information in biorepositories at the participating institutions. In the eMERGE network, we had the opportunity to conduct a GWAS of LDL‐C in African Americans using phenotypes extracted from EMR and a high‐density GWAS chip. We hypothesized that, despite a modest sample size, we might detect novel LDL‐C GWAS associations in our sample because of (a) our use of the Illumina 1M genotyping array, an array not used in the CARe consortium3 or in the participating studies of the Teslovich GWAS meta‐analysis2 and (b) our use of EMR‐derived phenotypes which permitted use of median LDL‐C and careful exclusion for medications and diseases which may alter LDL‐C levels. It has previously been demonstrated in eMERGE that traits constructed from longitudinal lipid data (right censored based on relevant comorbidity and medication history) can be leveraged to detect genotype–phenotype associations not previously recognized (such as TRIB1 in an earlier HDL GWAS4).
Methods
The eMERGE network
The eMERGE Network is a consortium of five US institutions (Northwestern University, Marshfield Clinic, Mayo Clinic, Vanderbilt University, and the Group Health Cooperative, University of Washington, and Fred Hutchinson Cancer Research Partnership) with DNA biorepositories linked to secure encrypted EMR data. The network is described in detail elsewhere.5 Institutional review boards at all participating institutions approved the project. As part of the consortium, each site conducted a GWAS on a specific phenotype derived from their EMR records. Members of the consortium then combined all genotyped samples across the network into one merged dataset6 and conducted further GWAS analyses7 by working across the Network to extract and harmonize phenotypes from all five sites’ databases. Here, we present analyses using a subset of African American individuals in eMERGE who were genotyped on the Illumina 1M‐Duo (1M) (Illumina, San Diego, CA, USA) genotyping platform, a chip which includes many SNPs targeting variation in individuals of recent African descent. These individuals were originally included in a case‐control study of diabetes that was a collaboration between Northwestern University and Vanderbilt8 and a study of QRS interval from normal electrocardiograms led by Vanderbilt University.9
Genotyping and quality control
DNA samples from subjects who were self‐reported (Northwestern) or observer‐reported (Vanderbilt University) to be African American were genotyped on the Illumina 1M platform. Genotyping was performed at the Broad Institute of MIT and Harvard. Genotyping calls made using BeadStudio version 3.3.7 (Illumina) and Gentrain version 1.0 (Illumina). SNP data were cleaned using the eMERGE quality control (QC) pipeline developed by the eMERGE genomics working group.10 The cleaning process included evaluation of sample and marker call rate, gender anomalies, duplicate and Hap Map concordance, batch effects, evaluation of Hardy–Weinberg equilibrium, Mendelian errors, sample relatedness, and population stratification. Cryptic relatedness was assessed for all pairs within and across sites. Any pairs estimated to be at the half‐sibling level or higher were resolved by dropping the member of the pair with the lower genotype call rate. Additional cleaning was completed when samples from Northwestern and Vanderbilt were merged.6 The 1M chip contains 1,199,887 SNPs. As part of initial cleaning, 44,496 intensity‐only SNPs were removed. After completing the QC pipeline and removing all SNPs with a minor allele frequency less than 0.05, 910,341 SNPs remained in the analytic sample. Principal components to attempt to account for ancestry and to avoid population stratification were estimated for the all eMERGE participants typed on the 1M chip using Eigenstrat (Eigensoft v3.0, Smartpca 8000) at Northwestern University.11, 12
Phenotype extraction
eMERGE investigators have worked collaboratively to develop algorithms for extracting phenotypes from EMRs for use in genetic research.5, 13, 14 The algorithm for LDL‐C values and exclusion dates was a modification of an earlier HDL‐C eMERGE algorithm.4 All LDL‐C measurements were extracted from longitudinal lipid panel data obtained during the course of clinical care. Dates of prescriptions for medications that may have altered LDL‐C level (antilipid medications, estrogen hormone replacement therapy, and exogenous androgens) were also extracted. Date of earliest cancer diagnosis was also extracted from the EMR, as was date of first diagnosis of diabetes, hyperthyroidism, or hypothyroidism, using diabetes8 and hyper/hypothyroidism15 algorithms developed for other eMERGE projects. The complete algorithm for extracting this information from the EMR is available at https://www.mc.vanderbilt.edu/victr/dcc/projects/acc/index.php/Library_of_Phenotype_Algorithms#Lipids. Once all LDL‐C values, measurement dates, and exclusion dates were extracted from the EMR, the data were transferred to Northwestern University for analysis.
For this project, two datasets were created from the sample of eMERGE African Americans for analysis. For the first dataset, the median LDL‐C for each individual was calculated without the removal of any LDL‐C values from the medical record (called the dataset without lab values excluded). For the second dataset, LDL‐C values that were recorded for an individual after the earliest known exclusion date (date of drug prescription, diabetes, hyperthyroidism, hypothyroidism, or cancer diagnosis) were removed from the dataset and then the median LDL‐C calculated from remaining LDL‐C values (we refer to this dataset as the dataset with exclusions). These two datasets included different numbers of individuals as some individuals had all LDL‐C values removed before the calculation of the median in the second dataset. It is important to note that individuals included in both datasets did not necessarily have the same median LDL‐C value in the two dataset. A diagram depicting the algorithm for extracting LDL‐C lab values and exclusion dates from the EMR and the creation of the two datasets is presented in Figure 1 .
Figure 1.
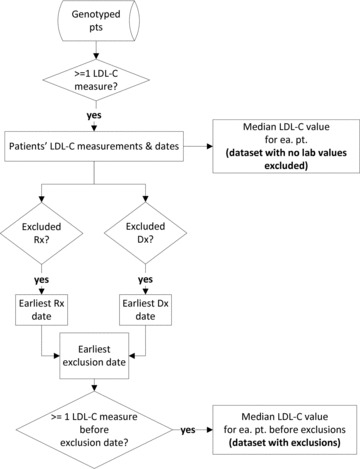
EMR extraction of LDL‐C values and exclusion dates and creation of the analytic datasets. Rx = prescription, Dx = prevalent disease. This flowchart depicts the information extracted from the EMR, and the phenotypes and analytic dataset created from the extracted EMR information. The start of the process is depicted at the top of the figure. Diamonds represent questions asked to extract information or restrict the analytic dataset, while rectangles represent data collected. The top third of the figure depicts how the dataset with no lab values excluded was assembled, while the bottom two thirds show the additional steps required to assemble the more restrictive dataset after exclusions. The figure demonstrates that median LDL‐C was calculated at two separate points for the two dataset; for this reason, an individual present in both datasets may have different LDL‐C values in each dataset.
Individuals with only one measurement of LDL‐C were included in the datasets; this measurement was considered the median LDL‐C. For individuals with an even number of LDL‐C measurements, the median LDL‐C was chosen as whichever of the two central measurements was closest to the mean of LDL‐C measurements (so as to have an actual LDL measurement and associated age of measurement for analysis). In an effort to minimize inclusion of errant LDL‐C values due to lab or data entry errors, unusually low LDL‐C levels due to unrecognized concomitant medical illness, or unusually high LDL‐C due to unrecognized familial hyperlipidemia, the following a priori exclusion criteria for median LDL‐C were used: any record from either dataset with a median measurement less than 50 mg/dL and greater than 210 mg/dL was excluded. This exclusion removed approximately 3.5% of individuals from the first dataset, over 75% of whom were individuals with only a single measure of LDL‐C.
Once median LDL‐C values were determined, the date of measurement for this LDL‐C value was extracted from the EMR. For individuals who had identical LDL‐C measurements on different dates, the earliest date on which the value was measured was extracted (and associated age used in analysis). A similar process to that used for the extraction of LDL values was also used to extract total cholesterol values.
Statistical methods
Univariate statistical analyses were performed in SAS version 9.2 (Cary, NC, USA). GWAS analyses were performed in PLINK.16 Genotypes were modeled additively. GWAS analyses were controlled for age, age2, sex, eMERGE recruitment site (Northwestern or Vanderbilt), genotyping batch (type 2 diabetes project or QRS project), and first three principal components to attempt to adjust for ancestry. A genomic inflation factor of 1 was calculated for the LDL‐C GWAS in both datasets, so genomic control was not applied. Estimates of r 2 between SNPs were calculated using the Hap Map website.
Results
Table 1 lists the characteristics of the eMERGE African Americans included in each dataset for the two LDL‐C GWAS. On average, the participants in the GWAS with exclusions (n= 618) were younger and had a higher median LDL‐C than participants with the GWAS without any lab values excluded (n= 1,249). For both datasets, nearly 70% of participants were female and approximately 30% were recruited at Northwestern.
Table 1.
Characteristics of the study sample.
| Dataset with exclusions (n = 618) | Dataset with no lab values excluded (n = 1,249) | |
|---|---|---|
| Age (years)* | 44.2 (13.1) | 50.1 (14.4) |
| Age range (years) | 14–87 | 14–90 |
| Median LDL‐C (mg/dL)* | 112.2 (31.5) | 103.7 (29.1) |
| Percentage of participants recruited from Northwestern | 32.4% | 26.6% |
| Percentage of female participants | 69.1% | 69.0% |
*Mean (SD).
Figures 2A and B show Manhattan plots for the GWAS of LDL‐C in the eMERGE network with exclusions (A) and without any lab values excluded (B). QQ plots for both GWAS analyses are presented in Figures S1(A) and (B). In each dataset, only one association, of SNP rs7412 in APOE and median LDL‐C, reached genome‐wide significance (p < 5 × 10 − 8). In the dataset with exclusions, the effect size (β) per minor allele of rs7412 was –20.0 mg/dL (95% CI =–25.9 mg/dL to –14.1 mg/dL, p value for association = 6.3 × 10 − 11). The estimated percentage trait variance (r 2) accounted for by this SNP in this dataset was 6.8%. In the dataset without any lab values excluded, the effect size (β) per minor allele of rs7412 was –12.3 mg/dL (95% CI =–16.3 mg/dL to –8.4 mg/dL, p value for association = 1.5 × 10 − 9). The estimated percentage trait variance (r 2) accounted for by this SNP in this dataset was 2.9%. The minor allele frequency of rs7412 in both datasets was 0.10. Forcing additional SNPs in the APOE region into the model as covariates did not substantially attenuate the effect size for the association of rs7412 with LDL‐C. A regional association plot for the LDL‐C analysis in the dataset without exclusions which includes information about linkage disequilibrium (LD) between rs7412 and nearby SNPs, is presented in Figure S2. SNP rs7412 was also strongly associated with total cholesterol levels in the dataset with exclusions (the effect size [β] per minor allele of rs7412 was –16.7 mg/dL, p value for association = 9.6 × 10 − 7).
Figure 2.
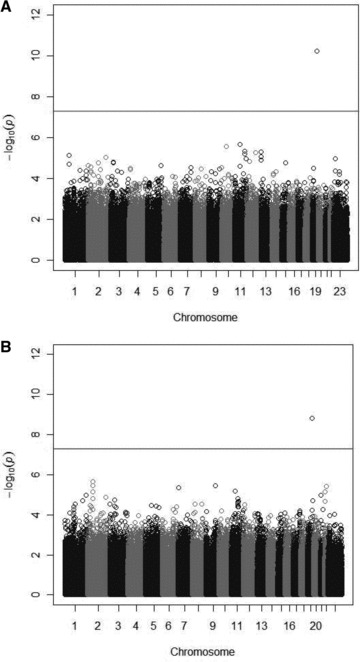
(A) GWAS of LDL‐C in eMERGE African Americans with exclusions. (B) GWAS of LDL‐C in eMERGE African Americans without any lab values excluded. Manhattan plots display the p values for the association of approximately 1 million SNPs with LDL‐C; each circle represents a single SNP association plotted by chromosome position (x axis) and log(10) transformed p value (y axis). The p values are from regression equations with SNPs modeled additively, adjusted for age2, sex, eMERGE site, genotyping batch, and the first three principal components. In both plots, only the association of LDL‐C and SNP rs7412 in APOE exceeded the genome‐wide threshold for significance.
Table S1 shows SNP/LDL‐C associations for three SNPs identified in a previous African American GWAS of LDL‐C.3 Given our small sample size, we were not sufficiently powered to replicate these associations, but the beta estimates for the eMERGE dataset with exclusions were consistent with (within 1 standard error of) the Lettre et al.3 estimates supporting the validity of LDL‐C measures in this dataset.
Discussion
In this GWAS of LDL‐C in African Americans using a high‐density GWAS chip and EMR, we detected a single strong and GWAS‐significant association with SNP rs7412 in APOE. This association was genome‐wide significant whether or not lab values were excluded using information on medications and concomitant illness from the EMR. However, the effect size of the association and the percentage of trait variance explained were larger in the analysis with exclusions.
APOE circulates on very low‐density lipoprotein and is a ligand for LDL receptors, which participate in the removal of LDL from circulation. The E2 allele (a haplotype characterized primarily by rs7214) is known to be associated with lower LDL‐C levels17 as well as with type III hyperlipoproteinemia.18 rs7412 is a coding SNP which changes the amino acid at position 158 in APOE from Arg to Cys. Individuals with this mutation are less efficient at making and transferring VLDLs and chylomicrons from the blood plasma to the liver. The E4 allele (another APOE haplotype, this one characterized primarily by rs429358) has been associated with increased LDL‐C levels and increased atherosclerosis.19 (A recent fine‐mapping study of several loci associated with LDL‐C in GWAS verified that SNPs rs7412 and rs429358 are independently associated with the phenotype.20) Many candidate gene studies, including some in non‐Caucasian populations, have examined the association of rs7412 (alone or in concert with rs429358) with LDL and have detected strong associations. In a 2007 meta‐analysis of 82 studies, Bennet et al. reported that individuals with the E2/E2 allele (two minor alleles of rs7412 and no minor alleles of rs429358) had an LDL‐C level 44 mg/dL lower than individuals with the E4/E4 allele (no minor alleles of rs7412 and two minor alleles of rs429358).17 The SNP has been shown to be significantly associated with lipids in African Americans; in NHANES III, rs7412 was significantly associated with LDL‐C (after FDR adjustment) in non‐Hispanic blacks. The effect size for the association was –22.54 mg/dL per minor allele.21
Despite the large number of candidate gene studies examining rs7412 and LDL‐C levels, this variant has not been included in most GWAS analyses of LDL‐C, as rs7412 was not typed, imputed, or covered by proxy well in most published LDL‐C GWAS. According to the SNAP browser,22 SNP rs7412 is only genotyped on the Illumina Human 1M single and dual, the Illumina CARe iSelect, and the Illumina Omni Quad and Express, among the common GWAS chips. The previous African American GWAS used the Affymetrix 6.0 chip (Affymetrix, Santa Clara, CA, USA);3 according to the SNAP browser proxy search, the best available proxy for SNP rs7412 in Yorubans on the Affymetrix 6.0 chip would be SNP rs930461 which has an r 2 value of 0.13 with rs7412 in the Yoruba in Ibadan HapMap sample. The vast majority of studies included in the European‐ancestry GWAS mentioned above23, 24, 25, 26, 27 also did not use any of the chips including rs7412. The lack of coverage/imputation of SNP rs7412 in many GWAS has been highlighted previously in a GWAS analysis of Alzheimer's.28
Significant signals in APOE have been detected in published GWAS. However, these signals are likely driven primarily by SNP rs429358 (rs4420638, the index SNP in the APOE region for the large Teslovich LDL‐C GWAS meta‐analysis,2 is in LD with SNP rs429358 in European‐ancestry populations [r 2= 0.62 in a recent UK sample29]). Table S2 shows index SNPs in the APOE region that have been found to be significantly associated with LDL‐C in previously published GWAS of whites and African Americans (and estimates of their LD with rs7412—all of which are low [r 2 < 0.10]). In the Teslovich GWAS, the effect of SNP rs7412 was likely detected somewhat in conditional analysis, when SNP rs445925 was found to be significantly associated with LDL after control for SNP rs4420638.2 However, inclusion of this SNP in the genetic risk score would not be expected to fully capture the effect of SNP rs7412 as the predicted r 2 between these two SNPs in the 1,000 genomes CEPH population is only 0.59.
The results of this study offer a commentary on the frequent criticism that GWAS has been unsuccessful in explaining a large percentage of trait variation. In the Teslovich paper, the largest per allele effect size for any index SNP associated with LDL‐C was +7.14 mg/dL (for SNP rs4420638).2 Our study and others suggest that the per allele effect size of rs7412 may well be two to three times this, and the percentage of LDL‐C variance explained by this SNP in our study was 6.7% (2.9% in the dataset without exclusions). Thus, the inclusion of rs7412 in an LDL‐C gene score would be expected to considerably increase the percentage of trait variance explained; a recent analysis which fine mapped five loci identified through LDL‐C GWAS saw the percentage variance in LDL‐C explained by genes increase from 3.1% to 6.5% with the addition of several variants not covered by recent GWAS, including rs7412.20 The absence of SNP rs7412 (or a suitable proxy) in previously published GWAS to date has not been highlighted prominently in the discussion of lipid GWAS which we focused primarily on novel SNP discovery. Current GWAS chips combined with imputation cover a great deal of the genome, but there are many untested common variants and these variants may be contributing considerably to trait variation. This issue likely explains some of the “missing heritability” and is of particular relevance in African Americans, where there are more SNPs and stretches of LD are shorter.
Our results for SNPs rs7412 (APOE) and rs503662 (APOB) (whose effect sizes mirror those in previously published studies3, 21), replicate previous experience with other phenotypes in the eMERGE consortium demonstrating that variables derived from EMR can be used for GWAS and other epidemiologic studies.4, 13, 30, 31 We initially hypothesized that using LDL‐C from EMR might prove difficult because some individuals may not have followed instructions to fast before blood draws. However, we believe the use of the median LDL‐C measure helped to protect against the selection of incorrect measurements due to nonfasting status. If some nonfasting calculated LDL‐C measurements did enter the dataset, we would anticipate that this would not occur differentially by genotype, and thus any error introduced should have biased the estimate of effect to the null. The detection of the rs7412 signal in a relatively small population and the relatively large percentage variance explained by the SNP suggest that the extraction of the phenotype from EMR may actually be advantageous in some ways compared to previous analyses undertaken in traditional epidemiologic studies. We believe this is due to our ability both to use a median measure and to eliminate phenotypic noise due to multiple types of medication usage and concomitant illness reduced trait variance. Previously, it has been demonstrated that GWAS using average measures have increased power,32 and that an HDL‐C GWAS right censored based on relevant comorbidity and medication history detected novel loci.4 Furthermore, our results in the dataset with no lab values excluded compared to the dataset with exclusions show how much more trait variance is explained by a SNP in a sample with less phenotypic noise due to medications and illness. Earlier studies have typically not censored values based on such a wide variety of medications or concomitant illness; the Teslovich et al. GWAS meta‐analysis in European‐ancestry populations excluded individuals on lipid‐lowering medications, but most of the analyses in the meta‐analysis did not exclude participants based on prevalent disease,2 while the Lettre et al. GWAS meta‐analysis in African Americans used a correction to account for lipid‐lowering therapy and did not exclude individuals based on prevalent disease.3 An analysis of percentage of LDL‐C trait variance explained by a GWAS score including rs7412 in a large sample with multiple LDL‐C values appropriately censored for medications and prevalent illness may demonstrate that common genetic variation explains a larger percentage of variance in the trait in healthy individuals.
Conclusion
We performed a GWAS study of LDL‐C in African Americans which showed a very strong association with SNP rs7412 in APOE using a phenotype derived from EMR. Although this association has been reported previously in candidate‐gene studies, it has not been reported in previous GWAS studies because the SNP was likely not typed or imputed in previous analyses. Using median LDL‐C values extracted from EMR after censoring for medication and concomitant illness resulted in a SNP association that explained a relatively large percentage of trait variance. These results suggest we should be cautious in interpreting the small percentage of trait variance detected in large GWAS studies and continue to underscore the value of phenotypes derived from EMRs in genetic and epidemiologic research.
Conflict of Interest
We have no conflicts to disclose.
Supporting information
Figure S1. (A) QQ plot for LDL GWAS in dataset with exclusions. Genomic inflation factor for this analysis is equal to 1.0. (B) QQ plot for LDL GWAS in dataset with no lab values excluded. Genomic inflation factor for this analysis is equal to 1.0.
Figure S2. LD/association plot of APOE region from LDL GWAS in dataset with exclusions.
Table S1. Association of LDL‐C with three SNPs identified in a previous African American GWAS of LDL‐C for the eMERGE African American datasets
Table S2. Details of SNPs from the APOE region previously detected in LDL GWAS
Supporting info item
Acknowledgments
The eMERGE Network was initiated and funded by NHGRI, with additional funding from NIGMS through the following grants: U01‐HG‐004610 (Group Health Cooperative); U01‐HG‐004608 (Marshfield Clinic); U01‐HG‐04599 (Mayo Clinic); U01HG004609 (Northwestern University); U01‐HG‐04603 (Vanderbilt University), and the State of Washington Life Sciences Discovery Fund award to the Northwest Institute of Medical Genetics.
LJRT was supported by the National Center for Research Resources (NCRR) and the National Center for Advancing Translational Sciences (NCATS), National Institutes of Health (NIH) through grant number KL2 RR025740. The content is solely the responsibility of the authors and does not necessarily represent the official views of the NIH.
References
- 1. Hindorff LA, Junkins HA, hall PN, Mehta JP, Manolio TA. A Catalog of Published Genome‐Wide Association Studies. 2010. Available at: http://www.genome.gov/gwastudies. Accessed on August 24, 2010.
- 2. Teslovich TM, Musunuru K, Smith AV, et al Biological, clinical and population relevance of 95 loci for blood lipids. Nature. 2010; 466(7307): 707–713. [DOI] [PMC free article] [PubMed] [Google Scholar]
- 3. Lettre G, Palmer CD, Young T, et al Genome‐wide association study of coronary heart disease and its risk factors in 8,090 African Americans: the NHLBI CARe Project. PLoS Genet. 2011; 7(2): e1001300. [DOI] [PMC free article] [PubMed] [Google Scholar]
- 4. Turner SD, Berg RL, Linneman JG, et al Knowledge‐driven multi‐locus analysis reveals gene‐gene interactions influencing HDL cholesterol level in two independent EMR‐linked biobanks. PLoS One. 2011; 6(5): e19586. [DOI] [PMC free article] [PubMed] [Google Scholar]
- 5. McCarty CA, Chisholm RL, Chute CG, et al The eMERGE Network: a consortium of biorepositories linked to electronic medical records data for conducting genomic studies. BMC Med Genomics. 2011; 4: 13. [DOI] [PMC free article] [PubMed] [Google Scholar]
- 6. Zuvich RL, Armstrong LL, Bielinski SJ, et al Pitfalls of merging GWAS data: lessons learned in the eMERGE network and quality control procedures to maintain high data quality. Genet Epidemiol. 2011; 35(8): 887–898. [DOI] [PMC free article] [PubMed] [Google Scholar]
- 7. Crosslin DR, McDavid A, Weston N, et al Genetic variants associated with the white blood cell count in 13,923 subjects in the eMERGE Network. Hum Genet. 2012; 131(4): 639–652. [DOI] [PMC free article] [PubMed] [Google Scholar]
- 8. Kho AN, Hayes MG, Rasmussen‐Torvik L, et al Use of diverse electronic medical record systems to identify genetic risk for type 2 diabetes within a genome‐wide association study. J Am Med Inform Assoc. 2012; 19(2): 212–218. [DOI] [PMC free article] [PubMed] [Google Scholar]
- 9. Denny JC, Ritchie MD, Crawford DC, et al Identification of genomic predictors of atrioventricular conduction: using electronic medical records as a tool for genome science. Circulation. 2010; 122(20): 2016–2021. [DOI] [PMC free article] [PubMed] [Google Scholar]
- 10. Turner S, Armstrong LL, Bradford Y, et al Quality control procedures for genome‐wide association studies. Curr Protoc Hum Genet. 2011; Chapter 1:Unit1 19. [DOI] [PMC free article] [PubMed] [Google Scholar]
- 11. Patterson N, Price AL, Reich D. Population structure and eigenanalysis. PLoS Genet. 2006; 2(12): e190. [DOI] [PMC free article] [PubMed] [Google Scholar]
- 12. Price AL, Patterson NJ, Plenge RM, Weinblatt ME, Shadick NA, Reich D. Principal components analysis corrects for stratification in genome‐wide association studies. Nat Genet. 2006; 38(8): 904–909. [DOI] [PubMed] [Google Scholar]
- 13. Kho AN, Pacheco JA, Peissig PL, et al Electronic medical records for genetic research: results of the eMERGE consortium. Sci Transl Med. 2011; 3(79): 79re1. [DOI] [PMC free article] [PubMed] [Google Scholar]
- 14. Kullo IJ, Ding K, Shameer K, et al Complement receptor 1 gene variants are associated with erythrocyte sedimentation rate. Am J Hum Genet. 2011; 89(1): 131–138. [DOI] [PMC free article] [PubMed] [Google Scholar]
- 15. Denny JC, Crawford DC, Ritchie MD, et al Variants near FOXE1 are associated with hypothyroidism and other thyroid conditions: using electronic medical records for genome‐ and phenome‐wide studies. Am J Hum Genet. 2011; 89(4): 529–542. [DOI] [PMC free article] [PubMed] [Google Scholar]
- 16. Purcell S, Neale B, Todd‐Brown K, et al PLINK: a tool set for whole‐genome association and population‐based linkage analyses. Am J Hum Genet. 2007; 81(3): 559–575. [DOI] [PMC free article] [PubMed] [Google Scholar]
- 17. Bennet AM, Di Angelantonio E, Ye Z, et al Association of apolipoprotein E genotypes with lipid levels and coronary risk. JAMA. 2007; 298(11): 1300–1311. [DOI] [PubMed] [Google Scholar]
- 18. Rall SC, Jr. , Mahley RW. The role of apolipoprotein E genetic variants in lipoprotein disorders. J Intern Med. 1992; 231(6): 653–659. [DOI] [PubMed] [Google Scholar]
- 19. Davignon J, Gregg RE, Sing CF. Apolipoprotein E polymorphism and atherosclerosis. Arteriosclerosis. 1988; 8(1): 1–21. [DOI] [PubMed] [Google Scholar]
- 20. Sanna S, Li B, Mulas A, et al Fine mapping of five Loci associated with low‐density lipoprotein cholesterol detects variants that double the explained heritability. PLoS Genet. 2011; 7(7): e1002198. [DOI] [PMC free article] [PubMed] [Google Scholar]
- 21. Chang MH, Yesupriya A, Ned RM, Mueller PW, Dowling NF. Genetic variants associated with fasting blood lipids in the U.S. population: Third National Health and Nutrition Examination Survey. BMC Med Genet. 2010; 11: 62. [DOI] [PMC free article] [PubMed] [Google Scholar]
- 22. Johnson AD, Handsaker RE, Pulit SL, Nizzari MM, O’Donnell CJ, de Bakker PI. SNAP: a web‐based tool for identification and annotation of proxy SNPs using HapMap. Bioinformatics. 2008; 24(24): 2938–2939. [DOI] [PMC free article] [PubMed] [Google Scholar]
- 23. Willer CJ, Sanna S, Jackson AU, et al Newly identified loci that influence lipid concentrations and risk of coronary artery disease. Nat Genet. 2008; 40(2): 161–169. [DOI] [PMC free article] [PubMed] [Google Scholar]
- 24. Kathiresan S, Melander O, Guiducci C, et al Six new loci associated with blood low‐density lipoprotein cholesterol, high‐density lipoprotein cholesterol or triglycerides in humans. Nat Genet. 2008; 40(2): 189–197. [DOI] [PMC free article] [PubMed] [Google Scholar]
- 25. Kathiresan S, Willer CJ, Peloso GM, et al Common variants at 30 loci contribute to polygenic dyslipidemia. Nat Genet. 2009; 41(1): 56–65. [DOI] [PMC free article] [PubMed] [Google Scholar]
- 26. Aulchenko YS, Ripatti S, Lindqvist I, et al Loci influencing lipid levels and coronary heart disease risk in 16 European population cohorts. Nat Genet. 2009; 41(1): 47–55. [DOI] [PMC free article] [PubMed] [Google Scholar]
- 27. Sabatti C, Service SK, Hartikainen AL, et al Genome‐wide association analysis of metabolic traits in a birth cohort from a founder population. Nat Genet. 2009; 41(1): 35–46. [DOI] [PMC free article] [PubMed] [Google Scholar]
- 28. Beecham GW, Martin ER, Gilbert JR, Haines JL, Pericak‐Vance MA. APOE is not associated with Alzheimer disease: a cautionary tale of genotype imputation. Ann Hum Genet. 2010; 74(3): 189–194. [DOI] [PMC free article] [PubMed] [Google Scholar]
- 29. Ken‐Dror G, Talmud PJ, Humphries SE, Drenos F. APOE/C1/C4/C2 gene cluster genotypes, haplotypes and lipid levels in prospective coronary heart disease risk among UK healthy men. Mol Med. 2010; 16(9–10): 389–399. [DOI] [PMC free article] [PubMed] [Google Scholar]
- 30. Ritchie MD, Denny JC, Crawford DC, et al Robust replication of genotype‐phenotype associations across multiple diseases in an electronic medical record. Am J Hum Genet. 2010; 86(4): 560–572. [DOI] [PMC free article] [PubMed] [Google Scholar]
- 31. Kullo IJ, Fan J, Pathak J, Savova GK, Ali Z, Chute CG. Leveraging informatics for genetic studies: use of the electronic medical record to enable a genome‐wide association study of peripheral arterial disease. J Am Med Inform Assoc. 2010; 17(5): 568–574. [DOI] [PMC free article] [PubMed] [Google Scholar]
- 32. Rasmussen‐Torvik LJ, Alonso A, Li M, et al Impact of repeated measures and sample selection on genome‐wide association studies of fasting glucose. Genet Epidemiol. 2010; 34(7): 665–673. [DOI] [PMC free article] [PubMed] [Google Scholar]
Associated Data
This section collects any data citations, data availability statements, or supplementary materials included in this article.
Supplementary Materials
Figure S1. (A) QQ plot for LDL GWAS in dataset with exclusions. Genomic inflation factor for this analysis is equal to 1.0. (B) QQ plot for LDL GWAS in dataset with no lab values excluded. Genomic inflation factor for this analysis is equal to 1.0.
Figure S2. LD/association plot of APOE region from LDL GWAS in dataset with exclusions.
Table S1. Association of LDL‐C with three SNPs identified in a previous African American GWAS of LDL‐C for the eMERGE African American datasets
Table S2. Details of SNPs from the APOE region previously detected in LDL GWAS
Supporting info item