Abstract
MIF-1 (Pro-Leu-Gly-NH2) has potent therapeutic effects in depression and Parkinson’s disease, but its CNS sites of production are not yet clear. In this study, the concentration of MIF-1 in different brain regions was measured by the multiple reaction monitoring technique on a 4000 QTRAP mass spectrometer. The limit of quantification was 300 fg of MIF-1, and limit of detection was 60 fg. The low molecular weight fractions of tissue homogenates from different regions of mouse brain were analyzed. The concentration of MIF-1 ranged from 22 ± 3 fg/μg protein in cerebral cortex to 930 ± 60 fg/μg protein in the hypothalamus. Moderate concentrations were also detected in all other regions tested, including the striatum, thalamus, and hippocampus. By incubation of stable isotope-labeled oxytocin with tissue preparations, it was also confirmed that oxytocin at least partially contributed to the production of MIF-1 in the hypothalamus by action of peptidases. Regional differences were also found. The results are the first to show the ultrasensitive quantification of MIF-1 in different brain regions, and support the neuromodulatory actions of MIF-1 in the striatum.
Keywords: MIF-1, Peptide, Brain, Peptidases, Mass spectrometry, Multiple reaction monitoring (MRM)
1. Introduction
MIF-1, Pro-Leu-Gly-NH2, was the first hypothalamic peptide shown to act on higher centers in the brain. It is effective in animal models of mental depression and Parkinson’s disease, as well as in some patients suffering from these disorders. These studies have been reviewed recently [34].
The isolation of MIF-1 from brain tissue was reported almost four decades ago. Five thousand bovine hypothalami were used. The tissue fractions were concentrated 11,000-fold and analyzed by thin layer chromatography (TLC), before the common use of mass spectrometry [32,44]. Functional assays further showed that the extracts of cerebral cortex were less active than those from the hypothalamus in inhibiting the release of melanocyte stimulating hormone (MSH). With the advent of highly sensitive and specific mass spectrometric techniques, we are now able to measure the concentration of MIF-1 in different regions of mouse brain.
We hypothesize that MIF-1 is synthesized not only by the hypothalamus but also by extra-hypothalamic regions of the brain, and that MIF-1 can be differentially derived from oxytocin or other precursors depending upon the region. The C-terminal tail of oxytocin contains Pro-Leu-Gly-NH2, connected to cysteine in the ring structure. The evidence suggesting that MIF-1 is a breakdown product of oxytocin came from studies on microsomal/mitochondrial fractions; an extract from the hypothalamus contained an exopeptidase that released MIF-1, whereas an extract from the cerebral cortex failed to show this exopeptidase activity and MIF-1 production [9,10,52]. The evidence against the oxytocin-origin of MIF-1 arises from studies with synaptosomal membrane preparations from combined hippocampal, septal, and hypothalamic tissue. In these synapsomal membrane preparations, the authors failed to find MIF-1 from proteolytic conversion of oxytocin even though aminopeptidase and C-terminal cleaving peptidase activities were highest in the hypothalamus [4-7,50]. In the present study, we used stable isotope-labeled oxytocin to examine the origin of MIF-1 in mouse brain tissue.
2. Materials and methods
2.1. Reagents and chemicals
Chemically synthesized MIF-1 was purchased from Phoenix Pharmaceuticals, Inc. (Burlingame, CA). All reagents including water were HPLC grade. Oxytocin was uniformly labeled (Keck Biotechnology Center, Yale University) with the stable isotopes 13C and 15N on the leucine residue of the C-terminal tripeptide chain that is MIF-1. Therefore, when oxytocin is proteolyzed to generate MIF-1, the molecular mass of heavy isotope-labeled MIF-1 is 7 Da greater than that of endogenous MIF-1. Stock solutions of MIF-1 (1 mg/mL) and oxytocin (10 μg/mL) were prepared in water. Working solutions for calibration and quality control were prepared from stock solution by adequate dilution with 2% acetonitrile in 0.1% formic acid. A Pierce protease inhibitor cocktail (Cat 78429, Thermo Fisher Scientific Products, Rockford, IL) was added before tissue homogenization. The components of the cocktail include 4-(2-aminoethyl) benzenesulfonyl fluoride hydrochloride (AEBSF), aprotinin, bestatin, E-64, leupeptin, and pepstatin A that was added immediately before the assay.
2.2. Animals and tissue processing
2.2.1. Detection of endogenous MIF-1
Mouse processing followed animal protocols approved by the Institutional Animal Care and Use Committee. Brain tissues from four adult female B6 mice (Jackson Laboratory, Bar Harbor ME) were obtained after anesthesia with intraperitoneal (ip) injection of ketamine/xylazine and decapitation. Pooled tissues were homogenized in dH2O in the presence of the protease inhibitor cocktail, passed through a 30 gauge needle, and centrifuged at 15,000 × g for 30 min at 4 °C. The low molecular weight fraction (less than 3 kD) was obtained by use of Microcon centrifugal filter units (Millipore, Billerica, MA) with a MW cutoff of 3 kDa and centrifugation at 15,000 × g for 2 h at 4 °C. The samples were frozen at −80 °C, and lyophilized to about 0.1 ml of volume overnight. The protein concentration was determined by the bicinchoninic acid assay (Pierce, Rockford, IL). Tissue extracts were reconstituted in water to equivalent protein concentration of 3 mg/ml. Samples were further diluted five-fold in 0.1% formic acid and 2% acetonitrile.
2.2.2. Degradation profiles of stable isotope-labeled oxytocin
Hypothalamus from two mice were pooled for each sample and homogenized in 250 μl of phosphate buffered saline (PBS) by passage through 22 and 30 gauge needles in the presence or absence of protease inhibitor cocktail. Cortex from two mice were pooled for each sample and first homogenized in 2 ml PBS with a glass tissue homogenizer in the presence and absence of protease inhibitor cocktail. Afterwards, 250 μl of cortical homogenate was transferred to a 1.5 ml microcentrifuge tube and further homogenized by passing through 22 and 30 gauge needles. Ten μg/ml of labeled oxytocin was added to the homogenates and incubated at 37 °C for 30 min. All homogenates were centrifuged at 15,000 × g for 30 min at 4 °C. Low molecular weight species (<3 kDa) from the supernatant were concentrated to a final volume of 30–50 μL as described above in Section 2.2.1. Cortex and hypothalamus extracts were reconstituted in water to equivalent protein concentration of 4.5 mg/mL and 1.5 mg/mL, respectively.
2.3. Equipment
All samples were analyzed by reverse phase liquid chromatography/mass spectrometry (rpHPLC–MS/MS) with multiple reaction monitoring (MRM) for quantification of MIF-1. Experiments were performed on a hybrid triple quadrupole linear ion trap mass spectrometer (4000 QTRAP®, Applied Biosystems). MRM experiments may be performed on a variety of instruments; however, triple quadrupoles are preferred as they offer a linear response with low noise, high sensitivity and high selectivity. MRM on the 4000 Q TRAP® instrument uses the first quadrupole to resolve the precursor ion mass with radio-frequency (RF) and direct current (DC) voltages applied, therefore allowing only ions with specific mass-to-charge ratio (m/z) to pass. Ions from the first quadrupole (Q1) are accelerated into the collision cell (in the RF only mode). Here ions undergo collision-activated dissociation (CAD) and the resultant fragment/product ions are accelerated to the third quadrupole (Q3) which selectively monitors pre-selected product ions (Fig. 1). A signal is detected if a selected precursor mass in Q1 results in the fragment ion monitored in Q3. Subsequently, once an MRM signal is detected, the Q3 can then be switched to a linear ion trap mode to obtain full MS/MS spectra for identity verification. The 4000 QTRAP® was operated in the triple quadrupole mass spectrometer mode using an electrospray ionization (ESI) source in the experiments presented here.
Fig. 1.
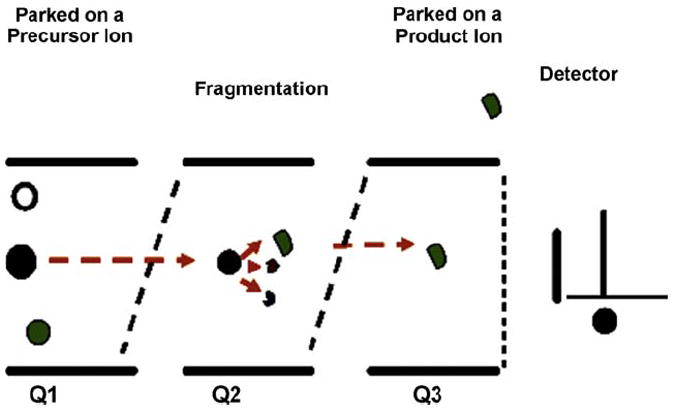
Schematic presentation of the MRM process in a triple quadrupole mass spectrometer.
Chromatography was performed on a Shimadzu LC system (Shimadzu Corp.) with 0.1% formic acid as solvent A and 100% acetonitrile in 0.1% formic acid as solvent B. Samples (50 μL) were injected on an Aquasil C18 column (2.1 × 150 mm) and eluted at 400 μL/min with a gradient of 0–60% Solvent B in 8 min. Samples eluted from the chromatographic column were ionized by the ESI source and analyzed by the 4000 QTRAP® mass analyzer. The various parameters of the mass spectrometer were optimized for maximum sensitivity.
To determine endogenous concentration of MIF-1 in various brain regions, the precursor ion of MIF-1 at m/z 285.1 was mass selected by the Q1 operating to transmit ions within a narrow window (0.7 Da) and three major product ions; 183.1, 211.2 and 188.1, were sequentially transmitted through the Q3 mass window of 0.7 Da. Thus, three MRM transitions (precursor-to-fragment ion transitions) 285.1/183.1, 285.1/211.2 and 285.1/ 188.1 were monitored and the cycle (dwell time of 150 ms for each MRM transition) was repeated for the entire chromatographic gradient.
To measure formation of MIF-1 from labeled oxytocin, two precursor ions at m/z 285.1 (unlabeled MIF-1) and at m/z 292.1 (labeled MIF-1 as a proteolytic degradant from labeled oxytocin) were sequentially selected by the first quadrupole. Thus, six MRM transitions 285.1/183.1, 285.1/211.2, 285.1/188.1, 292.1/189.0, 292.1/218.2 and 292.1/195.1 were monitored and the cycle was repeated for the entire chromatographic gradient.
3. Results
3.1. Method development
We used the MRM signal to quantify MIF-1 levels in mouse brain samples (Fig. 1). The MRM assay included two stages of mass selection resulting in high specificity and selectivity for targeted detection of analytes. Both Q1 and Q3 quadrupoles were used as static mass filters to monitor particular fragment ions of the selected precursor ion resulting in increased sensitivity. This assay was first optimized and validated with chemically synthesized MIF-1 as described below.
The product ion spectrum of MIF-1 in positive ionization mode is presented in Fig. 2. The predominant [M + H]+ ion at 285.1 was used as the precursor ion to obtain the product ion spectra of MIF-1. Three most sensitive and reproducible precursors to fragment transitions from m/z 285.1 to m/z 183.1, from m/z 285.1 to m/z 211.2 and from m/z 285.1 to m/z 188.1 were optimized and monitored in all samples for quantification of MIF-1.
Fig. 2.
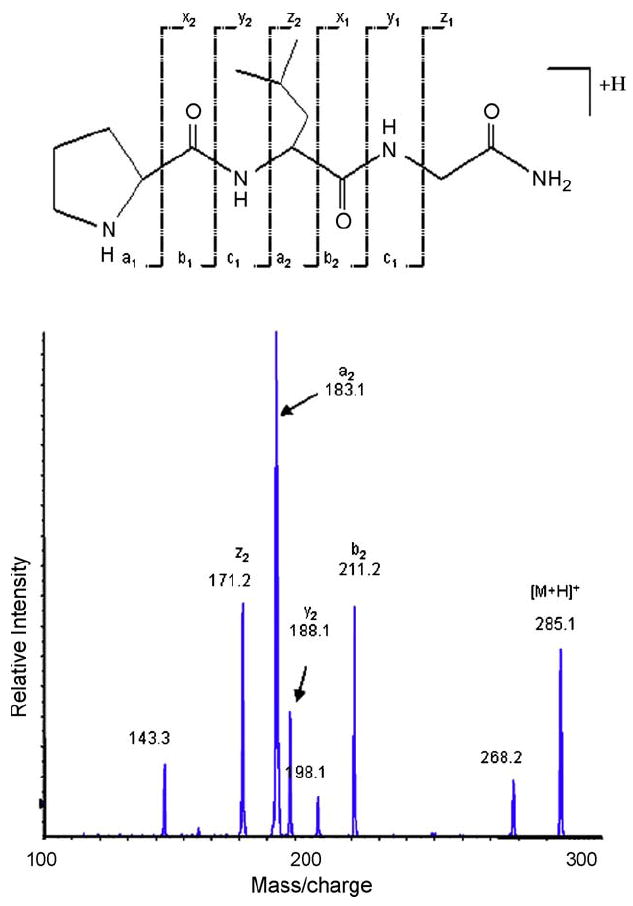
Characteristic electrospray ionization–tandem mass spectrum (ESI-MS/MS) of MIF-1. The peptide structure and the corresponding fragment ions are shown on the top. Fragment ions observed in the spectrum are labeled. These results were used to design and optimize the LC–MS/MS experiment. Three precursor-to-fragment transitions 285.1/183.1, 285.1/211.2 and 285.1/188.1 were monitored for all MIF-1 samples.
Fig. 3A presents representative extracted ion chromatograms of all three MRMs obtained from a sample containing 10 pg of chemically synthesized MIF-1. Extracted ion chromatograms for all three MRM transitions of MIF-1 overlap. This provides additional confirmation and validation of its presence.
Fig. 3.
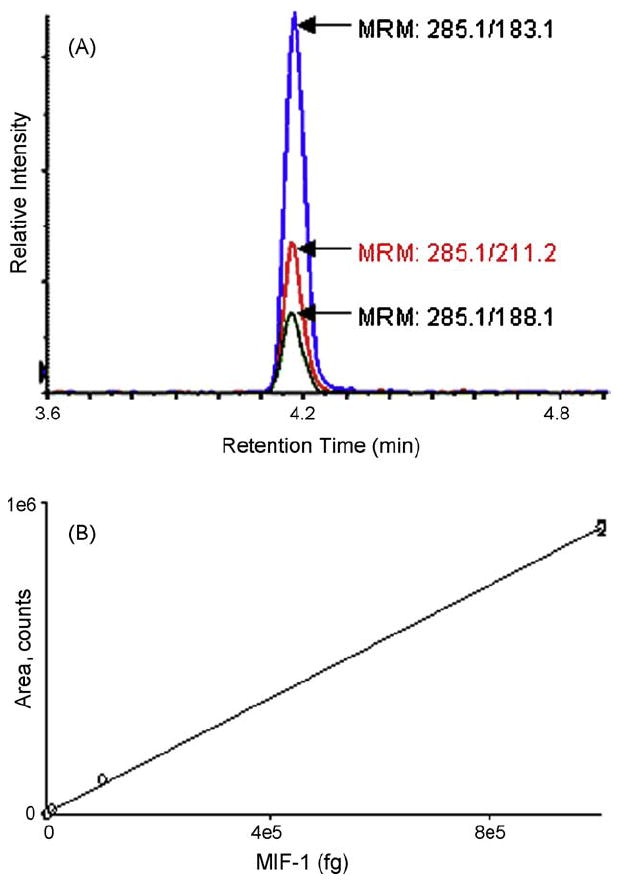
Validation of MRM. (A) Representative extracted ion chromatograms for three transitions 285.1/183.1, 285.1/211.2 and 285.1/188.1 obtained from a sample containing 1 pg of chemically synthesized MIF-1. MIF-1 (100 fg–10 ng) was loaded onto the chromatography column followed by MRM analysis to determine the limit of quantification, limit of detection, and linearity response of the assay. (B) The assay was linear over four orders of magnitude and the limits of quantification and detection were determined to be 300 fg and 60 fg, respectively. The error bars in (B) represent the standard deviation of the mean and in some cases are equal to or smaller than the size of the symbol.
3.2. Assay validation
To determine the limit of quantification, detection and linear response of MIF-1 in the MRM assay, 100 fg to 10 ng of MIF-1 was analyzed. The calibration curve was linear over four orders of magnitude (Fig. 3B). The limits of quantification and detection were determined to be 300 fg (signal-to-noise ratio of 10) and 60 fg (signal-to-noise ratio of 3), respectively. Fig. 3B shows the calibration curve for the MRM transition 285.1/183.1. The calibration curve presented in Fig. 3B was performed with chemically synthesized MIF-1 dissolved in 2% acetonitrile in 0.1% formic acid.
3.3. Detection of endogenous MIF-1 from different brain regions by MRM assay
Fig. 4 (A–E) presents extracted ion chromatograms (285.1/183.1) obtained for samples from various regions of the brain. MIF-1 was detected in all samples, which were reconstituted to the equivalent total protein concentration of 3 mg/mL. All analyses were performed in triplicate. The concentration of MIF-1 in various regions of the brain was determined with the calibration curve presented in Fig. 3B. The hypothalamus had the highest concentration of MIF-1, whereas the hippocampus had the lowest (Fig. 4F).
Fig. 4.
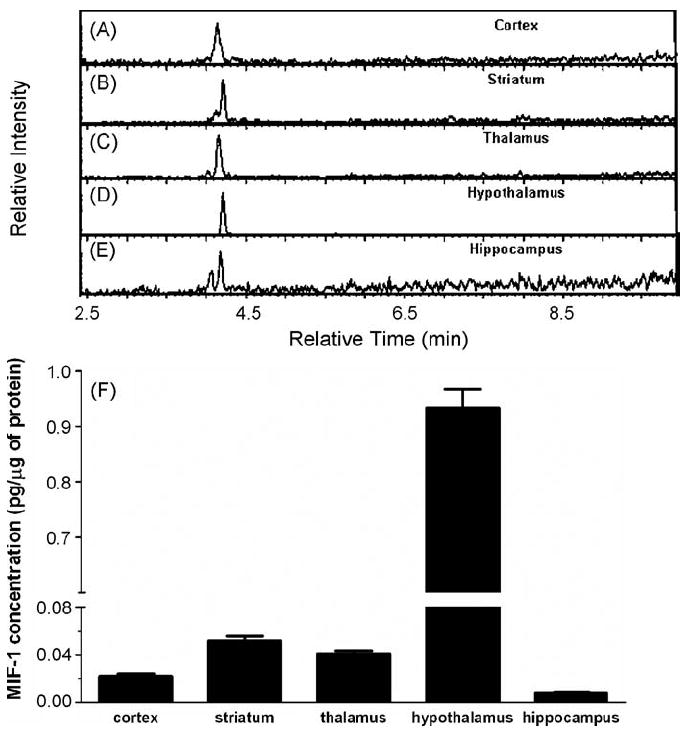
Endogenous concentrations of MIF-1. (A–E) extracted ion chromatograms (285.1/183.1) obtained for samples from various regions of the brain. MIF-1 was detected in all samples. All runs were performed in triplicate. (F) The bar graph shows that the hypothalamus had the highest concentration of MIF-1 whereas the hippocampus had the lowest.
3.4. Is MIF-1 a proteolytic product of oxytocin?
To determine whether MIF-1 is derived from oxytocin in the brain, we added stable isotope-labeled oxytocin to homogenized samples from different brain regions. Since stable isotope-labeled oxytocin was synthesized with leucine at position eight uniformly labeled with C13 and N15, if oxytocin is proteolyzed to generate MIF-1, the molecular mass of labeled MIF-1 would be 7 Da more than endogenous MIF-1. Levels of both labeled and unlabeled MIF-1 were measured simultaneously by monitoring three MRM transitions 285.1/183.1, 285.1/211.2, 285.1/188.1 for endogenous MIF-1, and three MRM transitions 292.1/189.0, 292.1/218.2 and 292.1/195.1 for stable isotope-labeled MIF-1 released as a proteolytic product of oxytocin. The dwell time for each MRM is 150 ms, and six transitions were monitored over a 6 s wide peak (Fig. 5). The chromatographic properties of both labeled and unlabeled MIF-1 were similar. Fig. 5 presents extracted ion chromatograms for MRM transitions 285.1/183.1 (unlabeled MIF-1) and 292.1/189.0 (labeled MIF-1) obtained after injection of 15 μg of the protein sample extracted from the hypothalamic region of the brain. Since the most MIF-1 was measured in the hypothalamus, the assay facilitates determination of whether oxytocin was proteolyzed to MIF-1 in the hypothalamus.
Fig. 5.
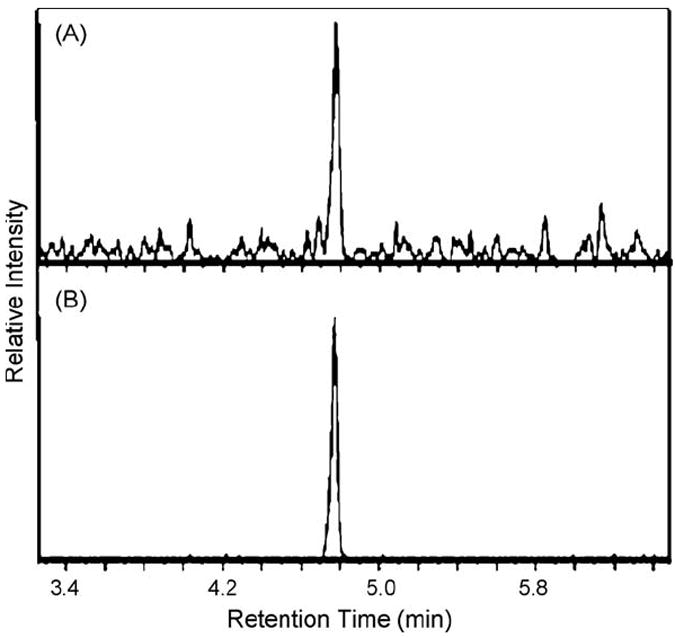
MRM monitoring of heavy isotope-labeled oxytocin. Extracted ion chromatograms showing (A) MRM transitions 285.1/183.1 (unlabeled MIF-1) and (B) 292.1/189.0 (labeled MIF-1) after injection of 15 μg of the hypothalamic protein sample.
The hypothalamus and cortex from mice were isolated and homogenized in phosphate buffer in the presence or absence of the protease inhibitor cocktail, and incubated with more isotope-labeled MIF-1 (10 μg/ml) as described in Section 2.2.2. In the absence of the protease inhibitor cocktail, there was heavier isotope-labeled MIF-1 in the hypothalamus than in the cerebral cortex. The presence of the protease inhibitor cocktail significantly reduced the amount of 13C15N-MIF-1 in the hypothalamus (Fig. 6). Since the degradation of heavy isotope-labeled oxytocin was at least partially inhibited by the protease inhibitors, the result indicates that hypothalamic MIF-1 could be derived from oxytocin. In the cerebral cortex, however, the amount of 13C15N-MIF-1 was not decreased by addition of the protease inhibitor cocktail, but rather was increased. This suggests that proteolysis of oxytocin might not play a major role in the production of endogenous MIF-1 in the cortex.
Fig. 6.
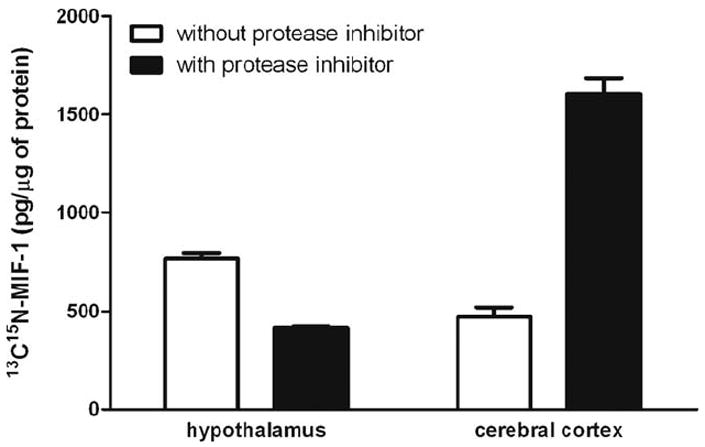
Stable isotope-labeled oxytocin was incubated with protein samples from either hypothalamus or cerebral cortex in the presence or absence of the protease inhibitor cocktail. The protease inhibitors reduced the amount of labeled MIF-1 formed from the labeled oxytocin in the hypothalamus but not in the cortex.
4. Discussion
The tripeptide MIF-1 is a representative member of the Tyr-MIF-1 family of peptides, including the endormorphins [53]. Unlike the endormorphins that act selectively on μ-opiate receptors and are present in areas with high receptor density [54], the receptor for MIF-1 has not been definitively identified, although non-opiate binding sites have been reported [11,12,29]. Nonetheless, the therapeutic effects of MIF-1 on Parkinson’s disease and depression [34] indicate that MIF-1 is an important neuromodulator. Most recently, we have shown that MIF-1 treatment induces immediate early gene c-Fos activation in specific brain regions and a unique profile of intracellular signaling (Khan et al., unpublished observations). These recent preliminary results reignited the quest to learn more about MIF-1. Here, we quantified the endogenous concentration of MIF-1 and examined whether oxytocin is a precursor for MIF-1 in different brain regions.
MRM technology was used to measure trace amounts of MIF-1 in mouse brain. The high specificity of MRM assay lies in the constraint that the analyte must meet two m/z requirements. The first is for the precursor ion of the analyte in the first quadrupole. The second is for the specific fragment ion from the precursor, induced by collisional excitation with a neutral gas in a pressurized collision cell in the second quadrupole, and specific diagnostic fragment ions (transitions) from that precursor in the third quadrupole. The two stages of mass selection in the MRM assay filters out co-eluting background ions and provides enhanced selectivity. In addition, several transitions (precursor and fragment ion pairs) can be monitored in a single experiment further enhancing the selectivity and specificity of the assay. The non-scanning nature of this technique (rapid and continuous monitoring of specific ions of interest) results in increased sensitivity by several orders of magnitude compared with that obtained by acquisition of full product ion scans (MS/MS spectra). With this sensitive technique, we were able to detect as little as 0.025 ng/ml of MIF-1 from the hippocampus.
Consistent with binding assays of tritiated MIF-1 in rat [12] and human [11] brain homogenates, MIF-1 was present in the striatum and thalamus, areas involved in movement disorders. After injection of tritiated MIF-1 into the lateral ventricle of rats, autoradiography has revealed specific accumulation of large amounts in the cells of the putamen and globus pallidus of the striatum [35]. The location by specific mass spectrometry of relatively high amounts of endogenous MIF-1 in the striatum is consistent with the activity of MIF-1 in animal models of Parkinson’s disease [3,8,13,23,37-41,51], including MPTP [30,47], as well as in clinical studies in patients with this disorder [2,18-20,45,48]. The striatum is also involved in mental depression [28,31,43,46], and known antidepressants are effective in some of the animal tests for Parkinson’s disease in which MIF-1 is active [22,23,37-41,51]. MIF-1 is also effective in more specific models of depression [21,24,26,27,33,36,42] and has shown great promise in clinical trials of depression, characterized by an early onset of improvement [15-17,49].
Besides areas involved in extrapyramidal movement disorders and mental depression, we also showed that MIF-1 has its highest concentration in the hypothalamus and can be detected in the hippocampus and cerebral cortex. This indicates a wide spectrum of actions of endogenous MIF-1. Further, it is known that the site of production and site of action of a peptide in the brain may differ greatly. Many peptides may be transported along with axonal projections to distal areas where receptors are located. Hypothalamic hormones may also exit the brain by the portal circulation and reach the CNS again by permeating the blood-brain barrier (BBB). Once present in the peripheral circulation, MIF-1 crosses the BBB rapidly to reach the CNS and tends to be retained there [1]. These factors can probably explain why the concentration of MIF-1 was highest in the hypothalamus in this study, whereas the binding of MIF-1 was higher in the striatum than in the hypothalamus [11,12].
Since the primary amino acid structure of oxytocin contains the sequence of MIF-1, it is reasonable to speculate that oxytocin may be the precursor for MIF-1, although previous studies have shown opposing findings as discussed in the introduction. Oxytocin is produced by neurosecretory cells in the supraoptic and paraventricular nuclei of the hypothalamus and transported to the posterior pituitary. It provides neuroendocrine regulation related mainly to reproductive behavior, and has a saturable transport system across the BBB that is not affected by MIF-1 [14]. The concentration of endogenous MIF-1 in the hypothalamus was shown by MRM to be more than 17-times higher than elsewhere in the brain. After incubation with 13C15N-Leu8- oxytocin, there was more 13C15N-MIF-1 formed from oxytocin in the hypothalamus than cortex. This suggests that peptidase activity generating MIF-1 from oxytocin may be much higher in the hypothalamus than in the cortex. This is further supported by results in the presence of the protease inhibitor cocktail, which at least partially blocked the enzymatic degradation. In the hypothalamus, enzyme inhibitors reduced the amount of 13C15N-MIF-1 in comparison with the group without enzyme inhibitors, suggesting that hypothalamic MIF-1 may be derived from oxytocin. In the cortex, opposite results were found. It is possible that oxytocin may not be the major source of MIF-1 there, since endogenous oxytocin is much less prevalent in the cortex than in the hypothalamus, and enzymatic activity converting oxytocin to MIF-1 is rather weak in the cerebral cortex. Nonetheless, there might be parallel pathways from alternative precursors producing MIF-1; if these pathways were blocked with less native MIF-1, there would be less feedback inhibition of the 13C15N-Leu8- oxytocin-produced 13C15N-MIF-1. Moreover, the larger cortical tissue might release more proteolytic enzymes during ex-vivo processing, thus explaining the regional difference of 13C15N-MIF-1 production in the presence of protease inhibitor cocktail which probably only provides partial inhibition. Although homogenization may release enzymes not inhibited by the cocktail added, the combined results suggest different routes of formation of MIF-1 in different areas of the brain.
The discrepant results in the literature concerning oxytocin generation of MIF-1 may be because synapsomal preparations do not contain as much enzymatic activity as intracellular sites shown with microsomal exopeptidases. A similar situation may occur with the formation of MIF-1 from Tyr-MIF-1; MIF-1 can arise from Tyr-MIF-1 by incubation with brain mitochondria but not by incubation with brain homogenates [25]. Moreover, the tyrosyl residue in the ring of oxytocin is not adjacent to the tripeptide tail representing MIF-1. Another explanation may lie in the cerebral location from which the tissue was taken for digestion by synaptomal preparations. Burbach et al. found that for conversion of oxytocin, both the C-terminal cleaving peptidase activity and the more active aminopeptidase activity are needed; in synaptomal fractions from eight areas of rat brain, the highest aminopeptidase activity occurs in the medial basal hypothalamus whereas the lowest is in the parietal cortex [7]. Thus, if MIF-1 was formed from oxytocin, this is more likely to occur in the hypothalamus than in the cortex.
In summary, this is the first report that MIF-1 concentration can be directly measured in the striatum, thalamus, hypothalamus, hippocampus, and cerebral cortex. The extreme sensitivity of MRM in comparison with other methods available indicates the importance and novelty of the study. Incubation of oxytocin with extracts from hypothalamus and cortex shows differential formation of MIF-1. The application of the latest isolation techniques to measure MIF-1 in brain regions besides its primary location in the hypothalamus reveals concentration-functional correlations. Thus, the MRM technique with a 4000 QTRAP® has great potential in neuropeptide research.
Acknowledgments
The authors acknowledge Dr. Steven A. Barker, Izabela Lomnicka, Connie David and Madhavi Minnamreddy for assistance in pilot trials.
References
- 1.Banks WA, Kastin AJ. Opposite direction of transport across the blood-brain barrier for Tyr-MIF-1 and MIF-1: comparison with morphine. Peptides. 1994;15:23–9. doi: 10.1016/0196-9781(94)90165-1. [DOI] [PubMed] [Google Scholar]
- 2.Barbeau A. Potentiation of levodopa effect by intravenous l-prolyl-l-leucyl-glycine amide in man. Lancet. 1975;2:683–4. doi: 10.1016/s0140-6736(75)90778-3. [DOI] [PubMed] [Google Scholar]
- 3.Bjorkman S, Castensson S, Sievertsson H. Tripeptide analogues of melanocyte-stimulating hormone release-inhibiting hormone (Pro-Leu-Gly-NH2) as inhibitors of oxotremorine-induced tremor. J Med Chem. 1979;22:931–5. doi: 10.1021/jm00194a009. [DOI] [PubMed] [Google Scholar]
- 4.Burbach JP, Lebouille JL. Proteolytic conversion of arginine-vasopressin and oxytocin by brain synaptic membranes. Characterization of formed peptides and mechanisms of proteolysis. J Biol Chem. 1983;258:1487–94. [PubMed] [Google Scholar]
- 5.Burbach JP, Schotman P, de Kloet ER. Oxytocin biotransformation in the rat limbic brain: chemical characterization of two oxytocin fragments and proposed pathway for oxytocin conversion. Biochem Biophys Res Commun. 1980;97:1005–13. doi: 10.1016/0006-291x(80)91476-x. [DOI] [PubMed] [Google Scholar]
- 6.Burbach JPH, Bohus B, Kovacs G, Van Nispen J, Greven H, De Wied D. Oxytocin is a precursor of potent behaviourally active neuropeptides. Eur J Pharmacol. 1983;94:125–31. doi: 10.1016/0014-2999(83)90449-1. [DOI] [PubMed] [Google Scholar]
- 7.Burbach JPH, De Kloet E, De Wied D. Oxytocin biotransformation in the rat limbic brain: characterization of peptidase activities and significance in the formation of oxytocin fragments. Brain Res. 1980;202:401–14. doi: 10.1016/0006-8993(80)90151-1. [DOI] [PubMed] [Google Scholar]
- 8.Castensson S, Sievertsson H, Lindeke B, Sum CY. Studies on the inhibition of oxotremorine induced tremor by a melanocyte-stimulating hormone release-inhibiting factor, thyrotropin releasing hormone and related peptides. FEBS Lett. 1974;44:101–5. doi: 10.1016/0014-5793(74)80315-7. [DOI] [PubMed] [Google Scholar]
- 9.Celis ME, Taleisnik S. Formation of a melanocyte-stimulating hormone-release inhibiting factor by hypothalamic extracts from rats. Int J Neurosci. 1971;1:223–30. doi: 10.3109/00207457109146974. [DOI] [PubMed] [Google Scholar]
- 10.Celis M, Taleisnik S, Walter R. Regulation of formation and proposed structure of the factor inhibiting the release of melanocyte-stimulating hormone. Proc Natl Acad Sci. 1971;68:1428–33. doi: 10.1073/pnas.68.7.1428. [DOI] [PMC free article] [PubMed] [Google Scholar]
- 11.Chiu S, Wong YW, Ferris JA, Johnson RL, Mishra RK. Binding studies of l-prolyl-l-leucyl-glycinamide (PLG), a novel antiparkinsonian agent, in normal human brain. Pharmacol Res Commun. 1983;15:41–51. doi: 10.1016/s0031-6989(83)80079-4. [DOI] [PubMed] [Google Scholar]
- 12.Chiu S, Wong YW, Wan YP, Chiu P, Mishra RK. Are the pharmacological effects of l-prolyl-l-leucyl-glycinamide (PLG) mediated through specific receptor mechanisms? Prog Neuropsychopharmacol Biol Psychiatry. 1983;7:739–42. doi: 10.1016/0278-5846(83)90056-8. [DOI] [PubMed] [Google Scholar]
- 13.Dickinson SL, Slater P. A comparison of the effects of Pro-Leu-Gly NH2 and l-leucine on tremorine-induced tremor and rigidity in rats. J Pharm Pharmacol. 1982;34:336–7. doi: 10.1111/j.2042-7158.1982.tb04721.x. [DOI] [PubMed] [Google Scholar]
- 14.Durham DA, Banks WA, Kastin AJ. Carrier-mediated transport of labeled oxytocin from brain to blood. Neuroendocrinology. 1991;53:447–52. doi: 10.1159/000125756. [DOI] [PubMed] [Google Scholar]
- 15.Ehrensing RH, Kastin AJ. Melanocyte-stimulating hormone-release inhibiting hormone as an anti-depressant: a pilot study. Arch Gen Psychiat. 1974;30:63–5. doi: 10.1001/archpsyc.1974.01760070047007. [DOI] [PubMed] [Google Scholar]
- 16.Ehrensing RH, Kastin AJ. Dose-related biphasic effect of prolyl-leucyl-glycinamide (MIF-I) in depression. Am J Psychiatry. 1978;135:562–6. doi: 10.1176/ajp.135.5.562. [DOI] [PubMed] [Google Scholar]
- 17.Ehrensing RH, Kastin AJ, Wurzlow GF, Michell GF, Mebane AH. Improvement in major depression after low subcutaneous doses of MIF-1. J Affect Disord. 1994;31:227–33. doi: 10.1016/0165-0327(94)90098-1. [DOI] [PubMed] [Google Scholar]
- 18.Fischer PA, Schneider E, Jacobi P, Maxion H. Effect of melanocyte-stimulating hormone-release inhibiting factor (MIF) in Parkinson’s syndrome. Eur Neurol. 1974;12:360–8. doi: 10.1159/000114633. [DOI] [PubMed] [Google Scholar]
- 19.Gerstenbrand F, Poewe W, Aichner F, Kozma C. In: Central nervous system effects of hypothalamic hormones and other peptides. Collu R, editor. New York: Raven Press; 1979. p. 415. [Google Scholar]
- 20.Gerstenbrand F, Binder H, Kozma C, Pusch ST, Reisner T. Infusion therapy with mif (melanocyte inhibiting factor) in Parkinson’s disease (author’s transl) Wien Klin Wochenschr. 1975;87:822–3. [PubMed] [Google Scholar]
- 21.Hatta K, Wolterink G, Van Ree J. Prolyl-leucyl-glycinamide, thyrotropin-releasing hormone and beta-endorphin-(10-16), like antidepressants, antagonize melatonin-induced behavioural changes in rats. Eur J Pharmacol. 1995;284:327–30. doi: 10.1016/0014-2999(95)00473-x. [DOI] [PubMed] [Google Scholar]
- 22.Huidobro-Toro JP, De Carolis AS, Longo VG. Action of two hypothalamic factors (TRH, MIF) and of angiotensin II on the behavioral effects of l-DOPA and 5-hydroxytryptophan in mice. Pharmacol Biochem Behav. 1974;2:105–9. doi: 10.1016/0091-3057(74)90141-5. [DOI] [PubMed] [Google Scholar]
- 23.Huidobro-Toro JP, Scotti dC, Longo VG. Intensification of central catecholaminergin and serotonergic processes by the hypothalamic factors MIF and TRF and by angiotensin II. Pharmacol Biochem Behav. 1975;3:235–42. doi: 10.1016/0091-3057(75)90153-7. [DOI] [PubMed] [Google Scholar]
- 24.Kastin AJ, Abel DA, Ehrensing RH, Coy DH, Graf MV. Tyr-MIF-1 and MIF-1 are active in the water wheel test for antidepressant drugs. Pharmacol Biochem Behav. 1984;21:767–71. doi: 10.1016/s0091-3057(84)80017-9. [DOI] [PubMed] [Google Scholar]
- 25.Kastin AJ, Hahn K, Zadina JE, Banks WA, Hackler L. Melanocyte-stimulating hormone release-inhibiting factor-1 (MIF-1) can be formed from Tyr-MIF-1 in brain mitochondria but not in brain homogenate. J Neurochem. 1995;64:1855–9. doi: 10.1046/j.1471-4159.1995.64041855.x. [DOI] [PubMed] [Google Scholar]
- 26.Kastin AJ, Scollan EL, Ehrensing RH, Schally AV, Coy DH. Enkephalin and other peptides reduce passiveness. Pharmacol Biochem Behav. 1978;9:515–9. doi: 10.1016/0091-3057(78)90051-5. [DOI] [PubMed] [Google Scholar]
- 27.Kostowski W, Danysz W, Dyr W, Jankowska E, Krzascik P, Palejko W, et al. MIF-1 potentiates the action of tricyclic antidepressants in an animal model of depression. Peptides. 1991;12:915–8. doi: 10.1016/0196-9781(91)90037-p. [DOI] [PubMed] [Google Scholar]
- 28.Larisch R, Klimke A, Vosberg H, Loffler S, Gaebel W, Muller-Gartner HW. In vivo evidence for the involvement of dopamine-D2 receptors in striatum and anterior cingulate gyrus in major depression. Neuroimage. 1997;5:251–60. doi: 10.1006/nimg.1997.0267. [DOI] [PubMed] [Google Scholar]
- 29.Luciano MG, Zadina JE, Kastin AJ, Coy DH. Mu and delta opiate receptors in rat brain are affected by GTP but not by MIF-1. Brain Res Bull. 1981;7:677–82. doi: 10.1016/0361-9230(81)90117-9. [DOI] [PubMed] [Google Scholar]
- 30.Marcotte ER, Chugh A, Mishra RK, Johnson RL. Protection against MPTP treatment by an analog of Pro-Leu-Gly-NH2 (PLG, MIF-1) Peptides. 1998;19:403–6. doi: 10.1016/s0196-9781(97)00321-5. [DOI] [PubMed] [Google Scholar]
- 31.Matsuo K, Rosenberg DR, Easter PC, MacMaster FP, Chen HH, Nicoletti M, et al. Striatal volume abnormalities in treatment-naive patients diagnosed with pediatric major depressive disorder. J Child Adolesc Psychopharmacol. 2008;18:121–31. doi: 10.1089/cap.2007.0026. [DOI] [PubMed] [Google Scholar]
- 32.Nair RMG, Kastin AJ, Schally AV. Isolation and structure of hypothalamic MSH release-inhibiting hormone. Biochem Biophys Res Commun. 1971;43:1376–425. doi: 10.1016/s0006-291x(71)80026-8. [DOI] [PubMed] [Google Scholar]
- 33.Niesink RJ, van Ree JM. Neuropeptides and social behavior of rats tested in dyadic encounters. Neuropeptides. 1984;4:483–96. doi: 10.1016/0143-4179(84)90092-1. [DOI] [PubMed] [Google Scholar]
- 34.Pan W, Kastin AJ. From MIF-1 to endomorphin: the Tyr-MIF-1 family of peptides. Peptides. 2007;28:2411–34. doi: 10.1016/j.peptides.2007.10.006. [DOI] [PubMed] [Google Scholar]
- 35.Pelletier G, Labrie F, Kastin AJ, Coy D, Schally AV. Radioautographic localization of radioactivity in rat brain after intraventricular or intracarotid injection of 3H-l-prolyl-l-leucyl glycinamide. Pharmacol Biochem Behav. 1975;3:675–9. doi: 10.1016/0091-3057(75)90191-4. [DOI] [PubMed] [Google Scholar]
- 36.Pignatiello MF, Olson GA, Kastin AJ, Ehrensing RH, McLean JH, Olson RD. MIF-1 is active in a chronic stress animal model of depression. Pharmacol Biochem Behav. 1989;32:737–42. doi: 10.1016/0091-3057(89)90027-0. [DOI] [PubMed] [Google Scholar]
- 37.Plotnikoff NP, Kastin AJ. Oxotremorine antagonism by prolyl-leucyl-glycine amide administered by different routes and with several anticholinergics. Pharmacol Biochem Behav. 1974;2:417–9. doi: 10.1016/0091-3057(74)90090-2. [DOI] [PubMed] [Google Scholar]
- 38.Plotnikoff NP, Kastin AJ, Anderson MS, Schally AV. DOPA potentiation by a hypothalamic factor, MSH release-inhibiting hormone (MIF) Life Sci. 1971;10:1279–83. doi: 10.1016/0024-3205(71)90326-2. [DOI] [PubMed] [Google Scholar]
- 39.Plotnikoff NP, Kastin AJ, Anderson MS, Schally AV. Oxotremorine antagonism by a hypothalamic hormone, melanocyte-stimulating hormone release-inhibiting factor, MIF. Proc Soc Exp Biol Med. 1972;140:811–4. doi: 10.3181/00379727-140-36558. [DOI] [PubMed] [Google Scholar]
- 40.Plotnikoff NP, Kastin AJ, Anderson MS, Schally AV. Deserpidine antagonism by a tripeptide, l-prolyl-l-leucylglycinamide. Neuorendocrinology. 1973;11:67–71. doi: 10.1159/000122119. [DOI] [PubMed] [Google Scholar]
- 41.Plotnikoff NP, Minard FN, Kastin AJ. DOPA potentiation in ablated animals and brain levels of biogenic amines in intact animals after prolyl-leucylglycinamide. Neuroendocrinology. 1974;14:271–9. doi: 10.1159/000122270. [DOI] [PubMed] [Google Scholar]
- 42.Pulvirenti L, Kastin AJ. Blockade of brain dopamine receptors antagonizes the anti-immobility effect of MIF-1 and Tyr-MIF-1 in rats. Eur J Pharmacol. 1988;151:289–92. doi: 10.1016/0014-2999(88)90810-2. [DOI] [PubMed] [Google Scholar]
- 43.Rektorova I, Srovnalova H, Kubikova R, Prasek J. Striatal dopamine transporter imaging correlates with depressive symptoms and tower of London task performance in Parkinson’s disease. Mov Disord. 2008;23:1580–7. doi: 10.1002/mds.22158. [DOI] [PubMed] [Google Scholar]
- 44.Schally AV, Kastin AJ. Purification of a bovine hypothalamic factor which elevates pituitary MSH levels in rats. Endocrinology. 1966;79:768–72. doi: 10.1210/endo-79-4-768. [DOI] [PubMed] [Google Scholar]
- 45.Schneider E, Fischer PA, Jacobi P, Reh W. The influence of MIF (melanocyte-stimulating hormone-release inhibiting factor) on psychomotor function and mood in Parkinsonian patients Preliminary report (author’s transl.) Arzneimittelforschung. 1978;28:1296–7. [PubMed] [Google Scholar]
- 46.Shah PJ, Glabus MF, Goodwin GM, Ebmeier KP. Chronic, treatment-resistant depression and right fronto-striatal atrophy. Br J Psychiatry. 2002;180:434–40. doi: 10.1192/bjp.180.5.434. [DOI] [PubMed] [Google Scholar]
- 47.Sheng JG, Xu DL, Yu HZ, Xu XR, Tang QM. Partial protection from the dopaminergic neurotoxin 1-methyl-4-phenyl-1,2,3,6-tetrahydropyridine (MPTP) by Pro-Leu-Gly-NH2(PLG; MIF-1) Life Sci. 1987;40:2007–10. doi: 10.1016/0024-3205(87)90291-8. [DOI] [PubMed] [Google Scholar]
- 48.Straub RH, Wolff C, Fassold A, Hofbauer R, Chover-Gonzales A, Richards LJ, et al. Anti-inflammatory role of endomorphins in osteoarthritis, rheumatoid arthritis, and adjuvant arthritis. Rheumatology and Arthritis. 2008;58:456–66. doi: 10.1002/art.23206. [DOI] [PubMed] [Google Scholar]
- 49.van der Velde CD. Rapid clinical effectiveness of MIF-I in the treatment of major depressive illness. Peptides. 1983;4:297–300. doi: 10.1016/0196-9781(83)90136-5. [DOI] [PubMed] [Google Scholar]
- 50.Versteeg D. Neurohypophyseal hormones and brain neurochemistry. Pharmacol Ther. 1983;19:297–325. doi: 10.1016/0163-7258(82)90071-7. [DOI] [PubMed] [Google Scholar]
- 51.Voith K. Synthetic. MIF analogues. Part II. Dopa potentiation and fluphenazine antagonism. Arzneimittelforschung. 1977;27:2290–3. [PubMed] [Google Scholar]
- 52.Walter R, Griffiths E, Hooper K. Production of MSH-release-inhibiting hormone by a particulate preparation of hypothalami: mechanisms of oxytocin inactivation. Brain Res. 1973;60:449–57. doi: 10.1016/0006-8993(73)90802-0. [DOI] [PubMed] [Google Scholar]
- 53.Zadina JE, Hackler L, Ge L-J, Kastin AJ. A potent and selective endogenous agonist for the m-opiate receptor. Nature. 1997;386:499–502. doi: 10.1038/386499a0. [DOI] [PubMed] [Google Scholar]
- 54.Zadina JE, Martin-Schild S, Gerall AA, Kastin AJ, Hackler L, Ge L-J, et al. Endomorphins: a novel endogenous μ-opiate receptor agonist in regions of high μ-opiate receptor density. Ann NY Acad Sci. 1999;897:136–44. doi: 10.1111/j.1749-6632.1999.tb07885.x. [DOI] [PubMed] [Google Scholar]


