

Abstract
Injured CNS tissue often contains elevated iron and its storage protein ferritin, which may exacerbate tissue damage through pro-oxidative mechanisms. Therefore, therapeutic studies often target iron reduction as a neuroprotective strategy. However, iron may be crucial for oligodendrocyte replacement and remyelination. For instance, we previously showed that intraspinal toll-like receptor 4 macrophage activation induced the generation of new ferritin-positive oligodendrocytes, and that iron chelation significantly reduced this oligodendrogenic response. Since macrophages can secrete ferritin, we hypothesize that ferritin is a macrophage-derived signal that promotes oligodendrogenesis. To test this, we microinjected ferritin into intact adult rat spinal cords. Within 6 h, NG2+ progenitor cells proliferated and accumulated ferritin. By 3 d, many of these cells had differentiated into new oligodendrocytes. However, acute neuron and oligodendrocyte toxicity occurred in gray matter. Interestingly, ferritin-positive NG2 cells and macrophages accumulated in the area of cell loss, revealing that NG2 cells thrive in an environment that is toxic to other CNS cells. To test whether ferritin can be transferred from macrophages to NG2 cells in vivo, we loaded macrophages with fluorescent ferritin then transplanted them into intact spinal white matter. Within 3–6 d, proliferating NG2 cells migrated into the macrophage transplants and accumulated fluorescently labeled ferritin. These results show that activated macrophages can be an in vivo source of ferritin for NG2 cells, which induces their proliferation and differentiation into new oligodendrocytes. This work has relevance for conditions in which iron-mediated injury and/or repair likely occur, such as hemorrhage, stroke, spinal cord injury, aging, Parkinson's disease, and Alzheimer's disease.
Introduction
Iron is essential for normal myelin development, and during the early postnatal period, microglia are thought to be the iron source for oligodendrocytes. In fact, microglia have been described as “iron capacitors” (Todorich et al., 2009) because they accumulate iron before myelination and then decrease iron levels while oligodendrocytes simultaneously accumulate iron (Connor et al., 1995; Cheepsunthorn et al., 1998). Oligodendrocytes, the primary iron-containing cells in the CNS, require iron as a cofactor for enzymes involved in myelin production and maintenance (Pinero and Connor, 2000). However, oligodendrocytes often accumulate excessive iron levels following trauma or disease, which can lead to oxidative damage and cell death (Boullerne et al., 1999; Kress et al., 2002; Izawa et al., 2010). Indeed, oligodendrocyte loss occurs in a variety of CNS insults displaying elevated iron concentrations, including trauma, ischemia, and excitotoxicity (McTigue and Tripathi, 2008).
Oligodendrocyte replacement following injury or disease requires that endogenous NG2+ progenitor cells proliferate then differentiate into mature oligodendrocytes (Nishiyama et al., 1996; Keirstead and Blakemore, 1997). This process can be influenced by activated microglia and macrophages, which are common in sites of CNS pathology and release numerous bioactive molecules including iron and ferritin (Zhang et al., 2006; Schonberg et al., 2007; Schonberg and McTigue, 2009). Therefore, these cells may serve as a source of ferritin-bound iron for oligodendrocyte progenitors, which need sufficient iron for proliferation and differentiation. In vitro studies have shown that macrophages actively secrete ferritin, which promotes survival of oligodendrocyte cultures (Hulet et al., 2000; Zhang et al., 2006; Todorich et al., 2009). Oligodendrocyte lineage cells express the H-ferritin receptor Tim-2, and can internalize ferritin through a clathrin-dependent mechanism (Hulet et al., 2000; Todorich et al., 2008). Therefore, in CNS pathology, microglia and macrophages may play a neuroprotective role by internalizing excess iron and/or ferritin, which is toxic to CNS parenchyma. Then, as repair processes begin, these cells may shuttle iron or ferritin to NG2 cells, which is used as they proliferate and differentiate into new oligodendrocytes.
This idea is supported by our previous work which showed that intraspinal microinjection of LPS, a canonical proinflammatory stimulus acting through the toll-like receptor 4, activated macrophages, causing them to sequester iron and upregulate ferritin (Schonberg and McTigue, 2009). Seven days later, newly formed ferritin-positive oligodendrocytes colocalized with these macrophages; iron chelation in this model significantly reduced NG2 cell proliferation and formation of new ferritin-positive oligodendrocytes. Together, these data reveal that microglia/macrophage-derived iron and/or ferritin are necessary for maximal oligodendrocyte replacement. Although in vitro data support this hypothesis, in vivo data demonstrating ferritin effects on NG2 cells or transfer between macrophages and oligodendrocyte lineage cells are lacking. Thus, in this study we tested the hypothesis that extracellular ferritin promotes oligodendrocyte genesis in the adult spinal cord and that iron-bound ferritin can be shuttled from intraspinal macrophages to oligodendrocyte progenitor cells in vivo. These data provide novel information on intercellular interactions within the adult CNS as well as insight into mechanisms that may be involved in cellular damage and replacement following CNS injury or disease.
Materials and Methods
General microinjection protocol.
All surgical and postoperative care procedures were performed in accordance with The Ohio State University Institutional Animal Care and Use Committee. As in previous microinjection studies (Schonberg et al., 2007), adult female Sprague Dawley rats (230–250 g; n = 4/group) were anesthetized with ketamine (80 mg/kg, i.p.) and xylazine (10 mg/kg, i.p.) and given prophylactic antibiotics (Gentocin, 5 mg/kg, s.c.). Using an aseptic technique, a laminectomy was performed to expose the spinal cord at the T8 vertebral level. After removing the dura, a glass micropipette (custom pulled and beveled to an external tip diameter of 30–40 μm) was inserted 0.7 mm lateral to midline and 1.1 mm ventral to the surface of the spinal cord. A pneumatic picopump (DKI) was used for all microinjections. Immediately following injection, the micropipette was slowly withdrawn and the injection site was marked with sterile charcoal (Sigma). The musculature surrounding the laminectomy was sutured, the skin was closed with wound clips, and each rat was given 5 ml of saline before placement in a warmed recovery cage.
Ferritin microinjections.
To determine whether ferritin can directly promote NG2 cell proliferation and/or differentiation into new oligodendrocytes, 0.5 μl of ferritin (equine spleen ferritin, estimated to have 85% L-ferritin and 15% H-ferritin and an iron content of 7 mg/ml or 12.7%; Sigma) dissolved in sterile saline was microinjected into the spinal cord white matter near the white matter/gray matter border. Three doses were tested in pilot studies (0.5, 5, and 50 mg/ml). The higher two doses showed the most reproducible results and were used for all subsequent experiments. Animals survived for 6 h or 3 d postinjection (n = 5–6/group); an additional set of animals received 50 mg/ml injections and survived for 1 or 3 h after injection (n = 3–4/group). Spinal cord sections around the injection site were processed for immunohistochemistry. In a different series of experiments, fluorescently tagged ferritin was used to identify cells internalizing ferritin. To add the fluorescent tag, ferritin was labeled with DyLight 549 (Pierce), which adds a fluorescent tag to the ferritin molecule, according to manufacturer's instructions. To determine whether neurons, microglia, and/or NG2 cells can internalize ferritin, rats received an intraspinal microinjection as above of prelabeled ferritin into the lateral gray matter (0.4 mm lateral to midline, 1.0 mm ventral) and survived for 1, 3, or 6 h (n = 4/group).
Bromodeoxyuridine administration.
To label proliferating cells, the thymidine analog bromodeoxyuridine (BrdU; 20 mg/ml in sterile saline; Roche Diagnostics) was injected intraperitoneally (50 mg/kg) 15 min following surgery and then either every 2 h for the 6 h survival group or daily for the 3 and 6 d survival groups.
Tissue processing.
At the time of killing, rats were deeply anesthetized with ketamine and xylazine (1.5× surgery dose above), and then perfused transcardially with PBS followed by 250 ml of 4% paraformaldehyde in PBS. Spinal cords were removed, postfixed for 2 h at 4°C, and placed in 0.2 m PB overnight. Tissue was cryoprotected in 30% sucrose at 4°C for 48 h. For tissue embedding, spinal cords were frozen on dry ice and cut into 4 mm blocks centered on the injection site. After submersion in OCT compound (Electron Microscopy Sciences), blocks were frozen, and cross sections were cut at 10 μm on a cryostat and mounted onto slides. Tissue was stored at −20°C until used.
Immunohistochemistry.
Sections were rinsed in 0.1 m PBS and blocked for nonspecific antigen binding using 4% BSA/0.1% Triton-100/PBS (BP+) for 1 h. Next, sections were incubated in primary antibody overnight at 4°C. Sections were rinsed and treated with mouse or rabbit biotinylated antiserum (horse anti-mouse IgG 1:800 or goat anti-rabbit IgG 1:4000 in BP+; Vector Laboratories) for 1 h at room temperature. After rinsing, endogenous peroxidase activity was quenched using a 4:1 solution of methanol/30% hydrogen peroxide for 15 min in the dark. Sections were then treated with Elite avidin–biotin enzyme complex (ABC; Vector Laboratories) for 1 h. Visualization of labeling was achieved using DAB or SG substrates (Vector Laboratories). Sections were rinsed, dehydrated, and coverslipped with Permount (Fisher Scientific). For BrdU immunohistochemistry, sections were treated with 2N HCl at 37°C for 25 min before primary antibody incubation. Sections labeled with CC1 and GFAP antibodies to identify oligodendrocytes and astrocytes, respectively, were counterstained with methyl green. Sections labeled with NG2 antibody were counterstained with neutral red.
Immunofluorescence.
Sections were rinsed in 0.1 m PBS and blocked for nonspecific antigen binding using BP+ for 1 h. Next, sections were incubated in primary antibody overnight at 4°C. Sections were rinsed and treated with Alexa Fluor secondary antibody (1:1000; Invitrogen) for 30 min. To label nuclei, Draq5 (1:3000; Biostatus) was added with secondary antibody. For double- and triple-label immunofluorescence, sections were blocked and treated with primary and secondary antibodies, as above. After rinses, slides were coverslipped with Immu-Mount (Thermo Scientific). See Table 1 for a summary of antibody information.
Table 1.
Antibody information
| Antibody: specificity | 1o Concentration | Host species | Vendor |
|---|---|---|---|
| A2B5: OPCs | 1:1000 | Mouse | Chemicon |
| CC1: mature oligodendrocytes | 1:1000 | Mouse | Abcam |
| NG2: progenitor cells | 1:1000 (DAB) 1:100 (FL) | Mouse | Chemicon |
| Ox42: CD11b on microglia and macrophages | 1:2000 | Mouse | Serotec |
| BrdU: proliferating cells | 1:200 | Mouse | DSHB |
| GFAP: astrocytes | 1:2000 | Mouse | Sigma |
| NeuN: neurons | 1:50,000 | Mouse | Chemicon |
| Ferritin | 1:100 | Rabbit | Santa Cruz Biotechnology |
Fluorescently conjugated ferritin.
DyLight 549 (Pierce) was used to fluorescently label ferritin. Briefly, 40 μl of borate buffer (0.67 m) was added to 0.5 ml of ferritin in PBS (2 mg/ml; Sigma). The ferritin was then added to the DyLight Reagent vial, centrifuged, and incubated for 60 min at room temperature in the dark. After adding a purification resin, the contents were mixed to ensure uniform suspension and centrifuged for 45 s at 3000 rpm to remove the storage solution. The labeled ferritin was stored at −20°C.
Fluorescent ferritin-loaded bone marrow-derived macrophage microinjections.
Bone marrow-derived macrophages (BMDMs) were isolated from adult rats using a previously published protocol (Longbrake et al., 2007). Briefly, femurs and tibias were dissected from adult female Sprague Dawley rats, and bone marrow was flushed with RPMI 1640, 10% FBS (Hyclone), 1% penicillin/streptomycin, 1% HEPES, and 1% Glutamax. Cells were spun for 5 min, and red blood cells were lysed. After respinning, cells were suspended in supplemented RPMI 1640 (1% penicillin/streptomycin, 1% HEPES, 1% Glutamax, 0.001% b-mercaptoethanol, and 10% FBS). To drive the bone marrow cells toward a macrophage phenotype, 20% supernatant from L929 fibroblast cell line (that secretes macrophage colony-stimulating factor) was added to the media. Cells were plated at a density of 1 × 10⁶ cells/ml in T75 Falcon flasks.
After allowing 6 d to reach maturity, BMDMs were plated into nonstick Teflon wells (Savillex) and allowed to equilibrate for 24 h. The next day, BMDMs were treated with LPS (Sigma; 100 ng/ml) and DyLight-conjugated ferritin at a concentration of 100 μg/ml per well, and were allowed to incubate for 24 h. Macrophages (2 × 10⁶ cells) loaded with ferritin were rinsed, spun, and resuspended in 10 μl of sterile PBS. Rats underwent a laminectomy at the T8-T9 vertebral level (see Materials and Methods), and 0.5 μl of cells (100,000 BMDMs) were slowly microinjected into the lateral funiculus. The pipette remained in place for 5 min to prevent backflux of the cells, and then the laminectomy site was closed as described above. Rats survived for 1, 3, or 6 d (n = 3–6/group) after transplant. At the appropriate time, they underwent intracardiac perfusion and the spinal cords were prepared for immunohistochemistry.
Quantitative analysis.
Although the ferritin solution was microinjected into the white matter, it diffused to the adjacent gray matter and altered cellular responses therein. Because the overall cell responses were not identical between white and gray matter, these regions were analyzed separately. For white matter analysis, standardized sampling boxes (230 μm2) were placed in the dorsal columns and lateral funiculus bordering the gray matter ipsilateral to the injection site. Cell numbers were averaged for all boxes for each section analyzed. For gray matter counts, all immunopositive cells were manually counted throughout the right half of the gray matter (ipsilateral to injection site).
Confocal microscopy (Olympus FV1000 Laser Scanning confocal microscope) was used to visualize cells double-labeled for CC1/BrdU immunofluorescence in thin optical sections (≤1 μm) spanning the lesion sites. A Zeiss Axioskop 2 Plus microscope with a Sony 970 three-chip color camera was used to analyze nonfluorescent sections, including quantification of cells immunopositive for NG2, NG2/BrdU, CC1, and NeuN. For all analyses, data were collected as the number of cells per square millimeter; to facilitate comparisons across cell types over time, all data are expressed as a percentage of vehicle control. The criteria for double-labeled cells included each profile having a well defined border surrounding an identifiable nucleus. A cell was only considered double labeled if both criteria were met in the same plane of focus. Each time point and location (gray matter and white matter) was compared separately to its own vehicle control; therefore, differences between groups were compared using a one-way ANOVA followed by Bonferroni's post hoc analysis. When two groups were compared, an unpaired t test was used. Significance was set at p < 0.05. Statistical analysis and graphs were generated using Prism 5.0 (GraphPad Software).
Results
Ferritin promotes NG2 cell proliferation and new oligodendrocyte formation in vivo
To test whether extracellular ferritin can modulate progenitor proliferation or survival in vivo, we microinjected ferritin (5 or 50 mg/ml) or sterile PBS into intact spinal white matter of adult rats and quantified NG2 cell proliferation and total NG2 cell number (Fig. 1A–I). As expected, NG2/BrdU cell numbers were low in vehicle control spinal cords (∼1 cell/mm2). (Note: to facilitate comparisons across cell types, all controls have been set to 100% in figures.) By 6 h after ferritin injection, a twofold to threefold increase in NG2/BrdU cells (∼3 cells/mm2) was detected in white matter injection sites, indicating that cell proliferation was rapidly induced by ferritin. NG2/BrdU cell numbers in white matter returned to naive levels by 3 d (Fig. 1J). NG2 cell proliferation increased in the adjacent gray matter in a delayed time course relative to white matter. That is, NG2/BrdU cell numbers were similar to controls at 6 h (∼2 cells/mm2) but increased significantly by 3 d after injecting either ferritin dose compared with vehicle (p < 0.01) (Fig. 1A–F,J). Rats surviving for 3 d had daily BrdU injections, which led to an average of NG2/BrdU cells of ∼9 cells/mm2 in controls compared with ∼38 cells/mm2 in cords receiving either dose of ferritin.
Figure 1.
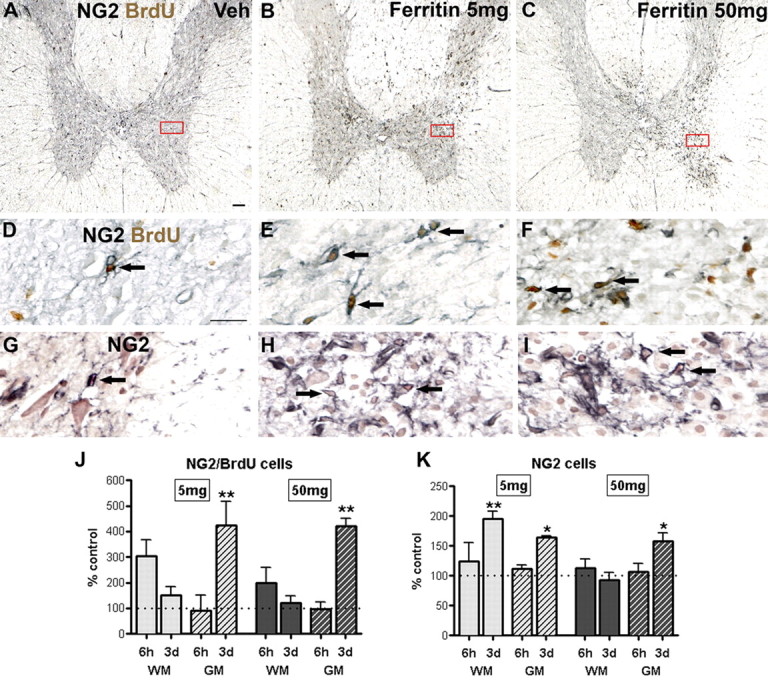
Ferritin microinjection increased NG2 cell proliferation and total NG2 cell number. A–C, Low-power images of cross sections from the injection site obtained 3 d after injection immunolabeled for NG2/BrdU (black and brown, respectively). High-power views of boxes are shown in D–F. NG2/BrdU cell numbers (arrows) increased following ferritin injection compared with vehicle (Veh). No cell loss or tissue disruption was detected in response to vehicle injection. G–I, High-power views of adjacent sections immunolabeled for NG2 and counterstained with neutral red. J, Quantification of NG2/BrdU double-labeled cells in ipsilateral white matter (WM) and gray matter (GM) at 6 h and 3 d after injection. K, Quantification of total NG2 cell number in WM and GM at 6 h and 3 d postinjection. Data represent mean ± SEM and are expressed relative to vehicle control numbers. *p < 0.05, **p < 0.01 versus vehicle, which is indicated by dotted line. Scale bars: A–C, 100 μm; D–I, 20 μm.
As expected with enhanced cell proliferation, there was a concomitant twofold increase in total NG2 cell numbers by 3 d in the white matter of the lower dose compared with vehicle (∼34 vs ∼70 cells/mm2) and gray matter from both doses (∼80 vs ∼130 cells/mm2) (Fig. 1G–I,K). Ongoing studies examining the effect of ferritin on oligodendrocyte precursor cell (OPC) proliferation in vitro using an MTT assay (Roche Applied Science) or BrdU incorporation suggest that ferritin can directly promote OPC proliferation and differentiation (D. L. Schonberg, E. Goldstein, and D. M. McTigue, unpublished observation).
Adult NG2 cells are comprised at least in part of proliferating oligodendrocyte progenitor cells that can differentiate into oligodendrocytes. Thus, we next asked whether any new oligodendrocytes were present 3 d after ferritin injection. For this, tissue was immunolabeled for BrdU and CC1, which labels mature oligodendrocytes. Since mature oligodendrocytes present at the time of injection are postmitotic, they would not have incorporated BrdU. Thus, if BrdU-positive oligodendrocytes were present, they would have arisen from progenitor cells that had incorporated BrdU during the cell cycle and then differentiated into oligodendrocytes.
Three days after microinjecting 5 mg/ml ferritin, BrdU-positive oligodendrocytes were prevalent in the white matter injection sites, in contrast to vehicle-injected cords where BrdU-positive oligodendrocytes were rare to absent (Fig. 2A–F). Quantification revealed an approximate fourfold increase in new oligodendrocytes in white matter from the low-ferritin-dose group (p < 0.05) and a nonsignificant rise in gray matter (∼28 vs 8 cells/mm2 in controls) (Fig. 2G). This increase in new oligodendrocytes translated to a 40–60% elevation of total oligodendrocytes compared with controls (p < 0.05) (Fig. 2H). The greater relative increase in BrdU-positive oligodendrocytes compared with overall oligodendrocyte numbers may reflect differences in immunolabeling techniques (fluorescent vs DAB) or there may have been a small loss of oligodendrocytes in response to the ferritin, and then these cells were replaced by the newly generated oligodendrocytes.
Figure 2.

Ferritin microinjection stimulated generation of new oligodendrocytes and increased overall oligodendrocyte numbers. A–C, Single-label and merged confocal images (≤1 μm) from a vehicle (Veh) injection site in the white matter 3 d after injection. Section is labeled for oligodendrocytes (A, CC1; red), proliferating cells (B, BrdU; green), and merged image (C). No new (i.e., double-labeled) oligodendrocytes are present in this section. D–F, Single-label and merged confocal images (≤1 μm) from a 5 mg/ml ferritin injection site 3 d after injection and labeled as above. Several new oligodendrocytes (arrows) are present in this field. Double-labeled cell near top of F is shown at higher power in inset. G, H, The number of BrdU-positive oligodendrocytes (G) and the total number of oligodendrocytes (H) at 3 d were quantified in ipsilateral white matter (WM) and gray matter (GM). Data represent mean ± SEM and are expressed relative to vehicle control numbers, indicated by dotted line. *p < 0.05, **p < 0.01, ***p < 0.001 versus vehicle control. Scale bar: (in F) A–F, 20 μm.
In contrast to the lower dose, 50 mg/ml ferritin induced a nonsignificant doubling of BrdU-positive oligodendrocyte numbers by 3 d in white matter with no change in gray matter (Fig. 2G). Interestingly, the white matter increase occurred on a background of oligodendrocyte toxicity, as the total number of oligodendrocytes in the white matter (and gray matter) was significantly reduced 6 h after injection (p < 0.01) (Fig. 2H), but returned to control values by 3 d. This suggests that the new oligodendrocytes generated from progenitor cells over 3 d replaced the oligodendrocytes lost acutely. In gray matter, total oligodendrocyte number remained significantly lower than controls at 3 d (p < 0.001) (Fig. 2H). Notably, the sections immunolabeled for oligodendrocytes were double stained with GFAP for astrocytes. This revealed that astrocytes were also absent in the areas of oligodendrocyte loss (data not shown). Collectively, these data reveal that oligodendrocyte progenitors are able to survive, proliferate, and differentiate an environment that is toxic to their mature counterparts.
High concentrations of extracellular ferritin are neurotoxic
Since excess iron can also be toxic to neurons, we quantified neuron numbers in sections adjacent to those used for oligodendrocyte counts (Fig. 3A–F). Neurons in the entire ipsilateral gray matter were counted. Vehicle injections did not alter neuron number. Elevated extracellular ferritin, however, was toxic and killed neurons in a dose-dependent manner. Low-dose ferritin had little effect on neuron survival at 6 h but induced moderate neuron loss by 3 d postinjection, at which time neurons were reduced ∼20% compared with controls (p < 0.05) (Fig. 3G). At this time, neuron loss was detected in ∼1.5 mm of tissue centered on the injection site. In contrast to the delayed loss after the low dose, high-dose ferritin rapidly caused ∼25% neuron loss by 6 h, which increased to 40% at 3 d (p < 0.001) (Fig. 3G). Neuron loss in these spinal cords was present in ∼5 mm of tissue centered on the injection site. Notably, all neuron loss occurred in the same lateral and ventral horn regions in which oligodendrocytes (and astrocytes) were lost and in which proliferating NG2 cells accumulated.
Figure 3.

Ferritin injection caused neurotoxicity. Neurons were identified with an antibody against NeuN and counted in the ipsilateral gray matter. A–C, Low-power views of gray matter 6 h after injection of vehicle (Veh; A), low-dose ferritin (B), or high-dose ferritin (C). Subtle neuron loss was evident in ventral horn of sections injected 6 h prior with high-dose ferritin (C). D–F, Low-power views of gray matter 3 d after injection of vehicle (D), low-dose ferritin (E), or high-dose ferritin (F). Between 6 h and 3 d, low-dose ferritin caused ∼20% neuron loss; during this same time, neuron loss had progressed in spinal cords receiving high-dose ferritin. G, Quantification of neurons in ipsilateral gray matter revealed a significant cell loss after microinjecting 5 mg (20% decrease at 3 d) and 50 mg of ferritin (25% decrease at 6 h and 40% decrease at 3 d). Data represent mean ± SEM and are expressed relative to vehicle control numbers, indicated by dotted line. *p < 0.05, **p < 0.01, ***p < 0.001 versus vehicle control. Scale bar: (in D) A–F, 100 μm.
Elevated ferritin induces robust microglia and macrophage activation
We next examined whether microglia and macrophage activation occurred in the injection site and/or gray matter regions of cell loss and proliferation (Fig. 4A–L). Vehicle injection caused no detectable changes at 6 h or 3 d in microglia, which displayed a resting, ramified morphology (Fig. 4A,D,G,J). Following ferritin injection, microglia/macrophages assumed an activated morphology and colocalized with regions of cell genesis and cell loss. Within 6 h of ferritin injection, small, rounded microglia/macrophages were prevalent throughout the injection sites of the low- and high-dose groups, suggesting that microglia were directly activated by ferritin (Fig. 4B,C,E,F). By 6 h in gray matter, considerable microglial/macrophage activation was present in spinal cords injected with the higher ferritin dose (Fig. 4C). This was likely due to a combination of direct activation by ferritin and activation subsequent to the neuron and oligodendrocyte death that had occurred by 6 h after injection.
Figure 4.

Ferritin induced robust microglia and macrophage activation, especially in gray matter. A–C, Low-power views of 6 h injection site cross sections immunolabeled for Ox42 to identify microglia and macrophages from vehicle (Veh; A), 5 mg/ml ferritin (B), and 50 mg/ml ferritin (C) groups. D–F, High-power views of rectangles in white matter are shown below each low-power image. Microglia remained as a resting phenotype in vehicle cords while subtle activation noted by morphological change was detected in white matter of both ferritin groups. G–I, Low-power view of 3 d injection site cross sections from vehicle (Veh; G), 5 mg/ml ferritin (H), and 50 mg/ml ferritin (I). J–L, High-power view of rectangles from gray matter are shown below each low-power image. By 3 d, robust microglial and macrophage activation was present in gray matter regions corresponding to regions of neuron and oligodendrocyte loss. Scale bars: A–C, G–I, 100 μm; D–F, J–L, 20 μm.
By 3 d, activated macrophages had increased in the gray matter of both groups and directly correlated with the region of ongoing oligodendrocyte and neuron loss (Fig. 4G–L). Thus, accumulation of extracellular ferritin is associated with microglia/macrophage activation and OPC proliferation and differentiation; however, at high concentrations, these cellular responses occur concomitant with neuron and oligodendrocyte toxicity.
Ferritin is rapidly internalized by microglia, NG2 cells, and neurons
To examine the cellular phenotypes directly responsive to ferritin, we added a fluorescent tag to ferritin then microinjected the fluorescently tagged ferritin (1 mg/ml; the maximal concentration possible with the kit) into naive spinal cords. Injections were targeted to the gray matter to examine possible ferritin uptake by neurons, microglia, and NG2 cells.
At 1 h postinjection, the injected fluorescent ferritin bolus was visible in the injection site (Fig. 5A). In sections double labeled for NeuN, we found multiple examples of neurons that were positive for fluorescent ferritin, which was mainly concentrated in the nucleus (Fig. 5B). At 3 and 6 h postinjection, ferritin-positive cellular profiles with neuronal morphology were present, but they no longer expressed NeuN, suggesting neuron pathology (data not shown). Expression of the ferritin receptor Tim-2 has not been described on neurons; thus, it is currently unknown whether neurons use this receptor or a different mechanism to internalize ferritin. At least one report suggests that transferrin receptors, which neurons do express, can internalize ferritin (Li et al., 2010). However, there is not consensus on this phenomenon in the field.
Figure 5.

Confocal images (≤1 μm) of cross sections from spinal cords 1 h after injecting fluorescent ferritin (red) into the gray matter. A, Low-power view of injection site immunolabeled for NeuN (green) and Draq5 (blue) revealing bolus of injected fluorescent ferritin in gray matter. B–B″, High-power view of region denoted by box in A. Neurons (B) were present in region of fluorescent ferritin (B′). A neuron (arrow) is visible that had internalized the injected ferritin, which distributed though the cytoplasm and nucleus (B″); this was a common finding. C–C″, Single-channel and merged image of an Ox42-positive macrophage that had internalized the injected ferritin; these cells were rare at this time. D–D″, Single-channel and merged Z-stack image of an NG2 cell (arrow) that internalized the injected ferritin; these fluorescent ferritin-positive cells were also rare at this time but were more common at subsequent times. Scale bars: A, 100 μm; B–B″, 50 μm; C–C″, 10 μm; D–D″, 20 μm.
To determine whether microglia or NG2 cells also internalize ferritin, sections were immunolabeled for Ox42 or NG2. Within 1 h of ferritin injection, a low number of microglia had taken up the fluorescent ferritin, some of which had an activated phagocytic profile (Fig. 5C). A small number of NG2 cells had also internalized ferritin within 1 h of injection (Fig. 5D). Thus, neurons, microglia, and NG2 cells in vivo can rapidly internalize extracellular ferritin. Oligodendrocyte lineage cells express Tim-2, the ferritin receptor (Todorich et al., 2008); thus, these data are consistent with the idea that these cells have the ability to internalize ferritin.
By 3 d after injection, fluorescent ferritin was no longer visible. Thus, sections were immunolabeled with cell markers to determine which cells had elevated intracellular ferritin, either from the injectate or due to endogenously produced ferritin (Fig. 6A–D). At 3 d postinjection, ferritin-positive neurons were no longer present, suggesting that neurons with excess ferritin were lost by 3 d. At this time, as shown above, a robust accumulation of activated macrophages was present in the region of neuron loss. Most of these macrophages were ferritin positive (Fig. 6A). Interestingly, ferritin-positive NG2 cells appeared to thrive in this environment, as they closely intermingled with the macrophages (Fig. 6C). Microglia and NG2 cells in the white matter injection site also maintained elevated ferritin levels 3 d after injection (Fig. 6B,D).
Figure 6.

Double-labeled confocal images reveal ferritin immunoreactivity (red) in macrophages and NG2 cells at 3 d in gray matter (GM, *) and white matter (WM) after 50 mg ferritin microinjection. A, By 3 d postinjection, a dense accumulation of ferritin-positive macrophages (Ox42, green) was present in gray matter in the region of neuron loss. B, Microglia in white matter injection sites also expressed ferritin at 3 d. C, Section adjacent to A reveals that ferritin-positive NG2 cells (green) closely intermingled with activated macrophages in gray matter. D, Ferritin-positive NG2 cells were present in white matter injection sites 3 d after injection. Scale bar: (in D) A–D, 20 μm.
NG2 cells internalize macrophage-derived ferritin in vivo
As shown above, ferritin-positive NG2 cells were significantly increased by 3 d in the gray matter. It is possible that the ferritin-positive macrophages provided a chemotactic signal and served as a source of iron-containing ferritin for NG2 cells as they do for erythroid precursors (Leimberg et al., 2008). Indeed, erythroid precursors depend on macrophage-derived ferritin for differentiation and heme production. Thus, it is possible that macrophages play a similar role in the CNS and provide iron-containing ferritin for oligodendrocyte precursors. To determine whether macrophage-derived ferritin transfer to OPCs occurs in vivo, macrophages were preloaded with fluorescent ferritin in vitro then were microinjected into the intact dorsolateral white matter of adult rat spinal cords. The transplanted cells were easily identified in the lateral funiculus after transplantation (Fig. 7A,B).
Figure 7.

In vivo transplants into lateral spinal white matter of Ox42-positive macrophages (green) preloaded in vitro with fluorescent ferritin (red). Bone marrow-derived macrophages were simultaneously stimulated with LPS (100 ng/ml) and loaded with fluorescently conjugated ferritin (red; 100 μg/ml) in vitro. After 24 h, ∼100,000 cells/μl were transplanted into the lateral funiculus. A, B, At 1 d (A) and 3 d (B) after transplant, the bolus of ferritin-loaded macrophages was visible in the white matter injection site. Scale bar: (in B) A, B, 20 μm.
Within 1 d of transplant, NG2 cell bodies and processes were in contact with transplanted macrophages at the transplant border (Fig. 8A,B). Over the next 2 d, NG2 cells began to migrate deeper into the transplants. At this time, NG2 cells containing macrophage-derived fluorescent ferritin were detected in all animals (Fig. 8C,D). Thus, NG2 cells internalize macrophage-derived ferritin in vivo. Similar results were obtained in vitro (data not shown). Macrophage transplants also induced a proliferative response in NG2 cells within and around the transplants as BrdU-positive NG2 cells were detected at 3 d post-transplant (Fig. 8E). By 6 d, NG2 cells were completely distributed throughout the macrophage transplants, suggesting that the macrophages were chemoattractive for NG2 cells in vivo (Fig. 8F), which could have been due to release of ferritin and/or other factors by the activated macrophages.
Figure 8.

Endogenous NG2 cells migrate into fluorescent ferritin (red)-loaded macrophage transplants, proliferate, and incorporate macrophage-derived ferritin. Macrophage injections into the white matter resulted in a loss of oligodendrocytes and astrocytes in the transplanted area; therefore, the fluorescence observed can be attributed to the prelabeled macrophages. A, Low-power confocal image of transplant injection site immunolabeled for NG2 (green) and counterstained with Draq5 (blue). B, High-power view of box from A showing NG2 cell (arrow) in close contact with a transplanted macrophage containing fluorescent ferritin. C, D, By 3 d post-transplant, NG2 cells had infiltrated further into the macrophage transplants, some of which now contained fluorescent ferritin (arrows), revealing that ferritin was released from macrophages in vivo and taken up by NG2 cells. E, NG2 cells (blue) within and around transplants contained BrdU-positive (green; arrow) nuclei, indicating that they were proliferating. Cell indicated by arrow shown at higher power in inset. F, By 6 d post-transplant, NG2 cells (green, arrow) had distributed throughout the entire region of macrophage transplants. Scale bars: A, 50 μm; (in F) B–F, 20 μm.
Discussion
This work highlights the relationship between NG2 cells and macrophages in vivo and provides new information on possible roles of ferritin on oligodendrocyte lineage cell functions. Ferritin, the major iron-containing protein in the body, can sequester >4000 iron atoms and is well known for its role in intracellular iron storage. In addition, the heavy-chain ferritin subtype has antioxidant functions and converts the highly toxic ferrous (Fe+2) molecule to the less reactive ferric (Fe+3) form. Ferritin is also present in the circulation and delivers iron to the brain, likely through receptor-mediated transcytosis across CNS blood vessels (Fisher et al., 2007). Once inside the CNS, ferritin can potentially move throughout the interstitial fluid through permeable water-filled channels between the cellular layers (Bradbury, 1997). Thus, neurons and glia are exposed to ferritin in CSF, the concentration of which will rise during vascular leakage, tissue disruption, or systemic inflammation.
Since ferritin can contain thousands of iron molecules, its role in iron delivery may be substantial, especially compared with transferrin, the prototypical iron delivery protein that carries only two iron atoms. However, if released, the large amount of iron within ferritin could be dangerous if intraparenchymal ferritin levels become excessive, which is common in regions of CNS pathology. Many features of injury and disease, such as inflammation, oxidative stress, and hemorrhage, cause iron and/or ferritin levels to rise extracellularly and within neurons, microglia, and macrophages. Not surprisingly, excess ferritin and iron have been detected in diverse pathologies including spinal cord injury (Rathore et al., 2008), Huntington's disease (Simmons et al., 2007), stroke (Wu et al., 2003), multiple sclerosis (LeVine, 1997; Hulet et al., 1999), Parkinson's disease, and aging brains (Sofic et al., 1988; Jellinger et al., 1990; Benkovic and Connor, 1993; Berg et al., 2001). Because ferritin and iron are ubiquitous in the injured CNS, it is important to understand how these molecules affect indices of cell death and endogenous repair.
Our data suggest that transfer of ferritin to progenitors from the extracellular space or macrophages may contribute to tissue repair by stimulating proliferation and formation of new oligodendrocytes. This was especially evident in the white matter, where NG2 cell proliferation and oligodendrogenesis were not potentially confounded by ferritin-induced neuron death. Since NG2/BrdU cell number doubled within 6 h of ferritin injection (Fig. 1), ferritin likely acted directly on these cells, presumably through binding the TIM-2 ferritin receptor and subsequent internalization (Todorich et al., 2008). Once inside, ferritin localized to the cytoplasm and nucleus of NG2 cells, macrophages, and neurons. Intranuclear ferritin has been reported before and is thought to function as a regulator of gene transcription and to protect DNA from iron-mediated damage (for review, see Alkhateeb and Connor, 2010). Once inside the cells, iron likely dissociates from ferritin (Hulet et al., 2000) and would be free to act as a cofactor with proteins that regulate the cell cycle. For instance, iron deprivation studies revealed that iron is necessary for proper expression of cyclins and Cdks, which are essential for mitosis (Kulp et al., 1996; Simonart et al., 2000; Alcantara et al., 2001). Iron deficiency also stimulates cell cycle inhibitors such as p21WAF1/CIP1 and p27KIP1 (Wang et al., 2004; Fu and Richardson, 2007). Accordingly, Wang et al. (2004) showed that supplying serum-starved cells with iron could reverse cell cycle arrest, which has relevance to in vivo models in which high iron levels may promote progenitor proliferation. For instance, iron and ferritin are increased after spinal cord trauma (Rathore et al., 2008), and we previously showed robust accumulation of proliferating NG2 cells in the lesion and lesion borders after spinal cord injury (McTigue et al., 2006; Tripathi and McTigue, 2007). Thus, the presence of elevated iron and/or ferritin within this region may be a potent stimulus for NG2 cell responses.
Our current data also show that some dividing progenitors differentiate into new oligodendrocytes within 3 d of ferritin injection and that these cells replace at least a portion of oligodendrocytes killed by excess ferritin. It is possible that as ferritin accumulates in the cell, elevated iron prompts proliferation, but that once iron concentration passes a certain threshold, proliferation ceases and differentiation is initiated. For instance, studies showed that when proliferating OPCs were exposed to high levels of iron, the cells stopped dividing and underwent differentiation (Morath and Mayer-Pröschel, 2001). It was postulated that the mechanism for this transition from a dividing cell to a differentiated phenotype was due to the pro-oxidant properties of iron. Oxidation is known to cause cell cycle arrest by upregulating cell cycle inhibitors (Russo et al., 1995; Anderson et al., 1998; Morath and Mayer-Pröschel, 2001). Thus, iron and ferritin can regulate both proliferation and differentiation, and further work is needed to elucidate the exact mechanisms involved in each process in vivo.
In our study, elevated ferritin was toxic to oligodendrocytes, resulting in losses as early at 6 h after exposure. Compared with other cells, oligodendrocytes contain low levels of antioxidants (Thorburne and Juurlink, 1996), which renders them vulnerable to the free radical production that can accompany a rapid increase in intracellular iron. Neurons at the injection sites were similarly affected by ferritin-induced toxicity. Neurons internalized ferritin within 1 h of injection, and significant neuron loss occurred by 6 h. Neurons do not typically express the L-chain of ferritin, which is necessary for long-term iron mineralization and storage (Connor et al., 1994). Therefore, if iron was released from ferritin upon internalization, neurons would have difficulty adequately storing the excess and would be susceptible to iron-mediated damage.
To identify cells that directly took up ferritin, we microinjected fluorescent ferritin into spinal cord gray matter. In addition to a few NG2 cells and microglia that internalized ferritin within 1 h of injection, many examples of neurons containing fluorescent ferritin were observed. Thus, neurons may preferentially incorporate the injected ferritin within 1–3 h. At later times, neurons (and oligodendrocytes) were lost in the region of ferritin injection, while there was a concomitant dense accumulation of macrophages and NG2 cells, both of which contained elevated ferritin. Their ferritin was possibly derived from the injected bolus as well as from dying neurons, as the number of ferritin-positive macrophages and NG2 cells was much greater at this time compared with earlier time points. Interestingly, rather than succumb to the high concentration of extracellular ferritin, NG2 cells were maintained in the region of cell death, where they proliferated and intermingled with activated macrophages. Thus, NG2 cells appeared to thrive in regions of cell death and inflammation.
The increased ferritin in NG2 cells also may have been due to upregulation of endogenous ferritin synthesis or derived from ferritin released from activated macrophages. Our data show that activated macrophages can internalize ferritin, and data from other laboratories indicate that macrophages release H-ferritin by exocytosis (Tran et al., 1997; Leimberg et al., 2008). Ferritin uptake and release from macrophages may occur in a manner similar to that described for transferrin, which is internalized, the iron is removed, and then transferrin is recycled back to the cell membrane and released. Our macrophage transplant study verifies that macrophages can serve as a source of ferritin in vivo. Indeed, within 3 d of intraspinal injection of ferritin-loaded macrophages, macrophage-derived fluorescent ferritin was detected in NG2 cells in all animals tested (n = 3/3). During this time, NG2 cells within and around the macrophages also began to proliferate, which could be a direct effect of ferritin-derived iron (see above) and/or the plethora of other macrophage secretory products that can promote migration and proliferation, such as IL-1β, IL-6, CNTF, IGF-1, leukemia inhibitory factor, BDNF, and Gro-α (Robinson et al., 1998; Hinks and Franklin, 1999; Dougherty et al., 2000; Herx et al., 2000; Mason et al., 2000; Vela et al., 2002; Nakanishi et al., 2007).
These data are consistent with results from a previous experiment in our laboratory using a model of intraspinal macrophage activation (Schonberg et al., 2009). In that study, ferritin-positive NG2 cells accumulated near a focus of ferritin-expressing activated macrophages. Within 6 d, proliferating NG2 cells and ferritin-positive new oligodendrocytes were prevalent in the activated macrophage cluster. Collectively, our data imply that in the adult CNS, microglia and macrophages can function as a source of iron/ferritin for NG2 cells and that this may be an important feature of oligodendrocyte replacement in regions of tissue pathology.
The current data have implications for a wide range of CNS disorders and injuries. Since excess iron promotes oxidative injury, focal accumulation of iron/ferritin can contribute to ongoing cascades of cell death, especially of neurons and oligodendrocytes. However, iron and ferritin may also play an important role in tissue repair as NG2 cells become activated and begin the process of oligodendrocyte replacement. In light of its essential role in maintenance of cell physiology and its ability to cause and exacerbate oxidative injury, it is critical that strategies be developed that restore iron balance while maintaining its beneficial actions. By doing so, the pathological consequences of neurological disease may be mitigated and repair mechanisms enhanced.
Footnotes
This work was funded by Grants P30NS045758 and NS059776 from The Ohio State University. We acknowledge the excellent technical assistance of A. Todd Lash.
The authors declare no competing financial interests.
References
- Alcantara O, Kalidas M, Baltathakis I, Boldt DH. Expression of multiple genes regulating cell cycle and apoptosis in differentiating hematopoietic cells is dependent on iron. Exp Hematol. 2001;29:1060–1069. doi: 10.1016/s0301-472x(01)00683-x. [DOI] [PubMed] [Google Scholar]
- Alkhateeb AA, Connor JR. Nuclear ferritin: a new role for ferritin in cell biology. Biochim Biophys Acta. 2010;1800:793–797. doi: 10.1016/j.bbagen.2010.03.017. [DOI] [PubMed] [Google Scholar]
- Anderson D, Yardley-Jones A, Yu TW, Hughes JA, Brinkworth MH. Modulation of ras p21 oncoprotein levels and DNA strand breakage in human cells with chemotherapeutic agents and/or deferoxamine. Teratog Carcinog Mutagen. 1998;18:219–230. [PubMed] [Google Scholar]
- Benkovic SA, Connor JR. Ferritin, transferrin, and iron in selected regions of the adult and aged rat brain. J Comp Neurol. 1993;338:97–113. doi: 10.1002/cne.903380108. [DOI] [PubMed] [Google Scholar]
- Berg D, Gerlach M, Youdim MB, Double KL, Zecca L, Riederer P, Becker G. Brain iron pathways and their relevance to Parkinson's disease. J Neurochem. 2001;79:225–236. doi: 10.1046/j.1471-4159.2001.00608.x. [DOI] [PubMed] [Google Scholar]
- Boullerne AI, Nedelkoska L, Benjamins JA. Synergism of nitric oxide and iron in killing the transformed murine oligodendrocyte cell line N20.1. J Neurochem. 1999;72:1050–1060. doi: 10.1046/j.1471-4159.1999.0721050.x. [DOI] [PubMed] [Google Scholar]
- Bradbury MW. Transport of iron in the blood-brain-cerebrospinal fluid system. J Neurochem. 1997;69:443–454. doi: 10.1046/j.1471-4159.1997.69020443.x. [DOI] [PubMed] [Google Scholar]
- Cheepsunthorn P, Palmer C, Connor JR. Cellular distribution of ferritin subunits in postnatal rat brain. J Comp Neurol. 1998;400:73–86. [PubMed] [Google Scholar]
- Connor JR, Boeshore KL, Benkovic SA, Menzies SL. Isoforms of ferritin have a specific cellular distribution in the brain. J Neurosci Res. 1994;37:461–465. doi: 10.1002/jnr.490370405. [DOI] [PubMed] [Google Scholar]
- Connor JR, Pavlick G, Karli D, Menzies SL, Palmer C. A histochemical study of iron-positive cells in the developing rat brain. J Comp Neurol. 1995;355:111–123. doi: 10.1002/cne.903550112. [DOI] [PubMed] [Google Scholar]
- Dougherty KD, Dreyfus CF, Black IB. Brain-derived neurotrophic factor in astrocytes, oligodendrocytes, and microglia/macrophages after spinal cord injury. Neurobiol Dis. 2000;7:574–585. doi: 10.1006/nbdi.2000.0318. [DOI] [PubMed] [Google Scholar]
- Fisher J, Devraj K, Ingram J, Slagle-Webb B, Madhankumar AB, Liu X, Klinger M, Simpson IA, Connor JR. Ferritin: a novel mechanism for delivery of iron to the brain and other organs. Am J Physiol Cell Physiol. 2007;293:C641–C649. doi: 10.1152/ajpcell.00599.2006. [DOI] [PubMed] [Google Scholar]
- Fu D, Richardson DR. Iron chelation and regulation of the cell cycle: 2 mechanisms of posttranscriptional regulation of the universal cyclin-dependent kinase inhibitor p21CIP1/WAF1 by iron depletion. Blood. 2007;110:752–761. doi: 10.1182/blood-2007-03-076737. [DOI] [PubMed] [Google Scholar]
- Herx LM, Rivest S, Yong VW. Central nervous system-initiated inflammation and neurotrophism in trauma: IL-1 beta is required for the production of ciliary neurotrophic factor. J Immunol. 2000;165:2232–2239. doi: 10.4049/jimmunol.165.4.2232. [DOI] [PubMed] [Google Scholar]
- Hinks GL, Franklin RJ. Distinctive patterns of PDGF-A, FGF-2, IGF-I, and TGF-beta1 gene expression during remyelination of experimentally-induced spinal cord demyelination. Mol Cell Neurosci. 1999;14:153–168. doi: 10.1006/mcne.1999.0771. [DOI] [PubMed] [Google Scholar]
- Hulet SW, Powers S, Connor JR. Distribution of transferrin and ferritin binding in normal and multiple sclerotic human brains. J Neurol Sci. 1999;165:48–55. doi: 10.1016/s0022-510x(99)00077-5. [DOI] [PubMed] [Google Scholar]
- Hulet SW, Heyliger SO, Powers S, Connor JR. Oligodendrocyte progenitor cells internalize ferritin via clathrin-dependent receptor mediated endocytosis. J Neurosci Res. 2000;61:52–60. doi: 10.1002/1097-4547(20000701)61:1<52::AID-JNR6>3.0.CO;2-T. [DOI] [PubMed] [Google Scholar]
- Izawa T, Yamate J, Franklin RJ, Kuwamura M. Abnormal iron accumulation is involved in the pathogenesis of the demyelinating dmy rat but not in the hypomyelinating mv rat. Brain Res. 2010;1349:105–114. doi: 10.1016/j.brainres.2010.06.030. [DOI] [PubMed] [Google Scholar]
- Jellinger K, Paulus W, Grundke-Iqbal I, Riederer P, Youdim MB. Brain iron and ferritin in Parkinson's and Alzheimer's diseases. J Neural Transm Park Dis Dement Sect. 1990;2:327–340. doi: 10.1007/BF02252926. [DOI] [PubMed] [Google Scholar]
- Keirstead HS, Blakemore WF. Identification of post-mitotic oligodendrocytes incapable of remyelination within the demyelinated adult spinal cord. J Neuropathol Exp Neurol. 1997;56:1191–1201. doi: 10.1097/00005072-199711000-00003. [DOI] [PubMed] [Google Scholar]
- Kress GJ, Dineley KE, Reynolds IJ. The relationship between intracellular free iron and cell injury in cultured neurons, astrocytes, and oligodendrocytes. J Neurosci. 2002;22:5848–5855. doi: 10.1523/JNEUROSCI.22-14-05848.2002. [DOI] [PMC free article] [PubMed] [Google Scholar]
- Kulp KS, Green SL, Vulliet PR. Iron deprivation inhibits cyclin-dependent kinase activity and decreases cyclin D/CDK4 protein levels in asynchronous MDA-MB-453 human breast cancer cells. Exp Cell Res. 1996;229:60–68. doi: 10.1006/excr.1996.0343. [DOI] [PubMed] [Google Scholar]
- Leimberg MJ, Prus E, Konijn AM, Fibach E. Macrophages function as a ferritin iron source for cultured human erythroid precursors. J Cell Biochem. 2008;103:1211–1218. doi: 10.1002/jcb.21499. [DOI] [PubMed] [Google Scholar]
- LeVine SM. Iron deposits in multiple sclerosis and Alzheimer's disease brains. Brain Res. 1997;760:298–303. doi: 10.1016/s0006-8993(97)00470-8. [DOI] [PubMed] [Google Scholar]
- Li L, Fang CJ, Ryan JC, Niemi EC, Lebrón JA, Björkman PJ, Arase H, Torti FM, Torti SV, Nakamura MC, Seaman WE. Binding and uptake of H-ferritin are mediated by human transferring receptor-1. Proc Natl Acad Sci U S A. 2010;107:3505–3510. doi: 10.1073/pnas.0913192107. [DOI] [PMC free article] [PubMed] [Google Scholar]
- Longbrake EE, Lai W, Ankeny DP, Popovich PG. Characterization and modeling of monocyte-derived macrophages after spinal cord injury. J Neurochem. 2007;102:1083–1094. doi: 10.1111/j.1471-4159.2007.04617.x. [DOI] [PubMed] [Google Scholar]
- Mason JL, Jones JJ, Taniike M, Morell P, Suzuki K, Matsushima GK. Mature oligodendrocyte apoptosis precedes IGF-1 production and oligodendrocyte progenitor accumulation and differentiation during demyelination/remyelination. J Neurosci Res. 2000;61:251–262. doi: 10.1002/1097-4547(20000801)61:3<251::AID-JNR3>3.0.CO;2-W. [DOI] [PubMed] [Google Scholar]
- McTigue DM, Tripathi RB. The life, death and replacement of oligodendrocytes in the adult central nervous system. J Neurochem. 2008;107:1–19. doi: 10.1111/j.1471-4159.2008.05570.x. [DOI] [PubMed] [Google Scholar]
- McTigue DM, Tripathi R, Wei P. NG2 colocalizes with axons and is expressed by a mixed cell population in spinal cord lesions. J Neuropathol Exp Neurol. 2006;65:406–420. doi: 10.1097/01.jnen.0000218447.32320.52. [DOI] [PubMed] [Google Scholar]
- Morath DJ, Mayer-Pröschel M. Iron modulates the differentiation of a distinct population of glial precursor cells into oligodendrocytes. Dev Biol. 2001;237:232–243. doi: 10.1006/dbio.2001.0352. [DOI] [PubMed] [Google Scholar]
- Nakanishi M, Niidome T, Matsuda S, Akaike A, Kihara T, Sugimoto H. Microglia-derived interleukin-6 and leukaemia inhibitory factor promote astrocytic differentiation of neural stem/progenitor cells. Eur J Neurosci. 2007;25:649–658. doi: 10.1111/j.1460-9568.2007.05309.x. [DOI] [PubMed] [Google Scholar]
- Nishiyama A, Lin XH, Giese N, Heldin CH, Stallcup WB. Co-localization of NG2 proteoglycan and PDGF alpha-receptor on O2A progenitor cells in the developing rat brain. J Neurosci Res. 1996;43:299–314. doi: 10.1002/(SICI)1097-4547(19960201)43:3<299::AID-JNR5>3.0.CO;2-E. [DOI] [PubMed] [Google Scholar]
- Pinero DJ, Connor JR. Iron in the brain: an important contributor in normal and diseased states. Neuroscientist. 2000;6:435–453. [Google Scholar]
- Rathore KI, Kerr BJ, Redensek A, López-Vales R, Jeong SY, Ponka P, David S. Ceruloplasmin protects injured spinal cord from iron-mediated oxidative damage. J Neurosci. 2008;28:12736–12747. doi: 10.1523/JNEUROSCI.3649-08.2008. [DOI] [PMC free article] [PubMed] [Google Scholar]
- Robinson S, Tani M, Strieter RM, Ransohoff RM, Miller RH. The chemokine growth-regulated oncogene-α promotes spinal cord oligodendrocyte precursor proliferation. J Neurosci. 1998;18:10457–10463. doi: 10.1523/JNEUROSCI.18-24-10457.1998. [DOI] [PMC free article] [PubMed] [Google Scholar]
- Russo T, Zambrano N, Esposito F, Ammendola R, Cimino F, Fiscella M, Jackman J, O'Connor PM, Anderson CW, Appella E. A p53-independent pathway for activation of WAF1/CIP1 expression following oxidative stress. J Biol Chem. 1995;270:29386–29391. doi: 10.1074/jbc.270.49.29386. [DOI] [PubMed] [Google Scholar]
- Schonberg DL, McTigue DM. Iron is essential for oligodendrocyte genesis following intraspinal macrophage activation. Exp Neurol. 2009;218:64–74. doi: 10.1016/j.expneurol.2009.04.005. [DOI] [PMC free article] [PubMed] [Google Scholar]
- Schonberg DL, Popovich PG, McTigue DM. Oligodendrocyte generation is differentially influenced by toll-like receptor (TLR) 2 and TLR4-mediated intraspinal macrophage activation. J Neuropathol Exp Neurol. 2007;66:1124–1135. doi: 10.1097/nen.0b013e31815c2530. [DOI] [PubMed] [Google Scholar]
- Simmons DA, Casale M, Alcon B, Pham N, Narayan N, Lynch G. Ferritin accumulation in dystrophic microglia is an early event in the development of Huntington's disease. Glia. 2007;55:1074–1084. doi: 10.1002/glia.20526. [DOI] [PubMed] [Google Scholar]
- Simonart T, Degraef C, Andrei G, Mosselmans R, Hermans P, Van Vooren JP, Noel JC, Boelaert JR, Snoeck R, Heenen M. Iron chelators inhibit the growth and induce the apoptosis of Kaposi's sarcoma cells and of their putative endothelial precursors. J Invest Dermatol. 2000;115:893–900. doi: 10.1046/j.1523-1747.2000.00119.x. [DOI] [PubMed] [Google Scholar]
- Sofic E, Riederer P, Heinsen H, Beckmann H, Reynolds GP, Hebenstreit G, Youdim MB. Increased iron (III) and total iron content in post mortem substantia nigra of parkinsonian brain. J Neural Transm. 1988;74:199–205. doi: 10.1007/BF01244786. [DOI] [PubMed] [Google Scholar]
- Thorburne SK, Juurlink BH. Low glutathione and high iron govern the susceptibility of oligodendroglial precursors to oxidative stress. J Neurochem. 1996;67:1014–1022. doi: 10.1046/j.1471-4159.1996.67031014.x. [DOI] [PubMed] [Google Scholar]
- Todorich B, Zhang X, Slagle-Webb B, Seaman WE, Connor JR. Tim-2 is the receptor for H-ferritin on oligodendrocytes. J Neurochem. 2008;107:1495–1505. doi: 10.1111/j.1471-4159.2008.05678.x. [DOI] [PubMed] [Google Scholar]
- Todorich B, Pasquini JM, Garcia CI, Paez PM, Connor JR. Oligodendrocytes and myelination: the role of iron. Glia. 2009;57:467–478. doi: 10.1002/glia.20784. [DOI] [PubMed] [Google Scholar]
- Tran TN, Eubanks SK, Schaffer KJ, Zhou CY, Linder MC. Secretion of ferritin by rat hepatoma cells and its regulation by inflammatory cytokines and iron. Blood. 1997;90:4979–4986. [PubMed] [Google Scholar]
- Tripathi RB, McTigue DM. Prominent oligodendrocyte genesis along the border of spinal contusion lesions. Glia. 2007;55:688–711. doi: 10.1002/glia.20491. [DOI] [PubMed] [Google Scholar]
- Vela JM, Molina-Holgado E, Arévalo-Martín A, Almazán G, Guaza C. Interleukin-1 regulates proliferation and differentiation of oligodendrocyte progenitor cells. Mol Cell Neurosci. 2002;20:489–502. doi: 10.1006/mcne.2002.1127. [DOI] [PubMed] [Google Scholar]
- Wang G, Miskimins R, Miskimins WK. Regulation of p27(Kip1) by intracellular iron levels. Biometals. 2004;17:15–24. doi: 10.1023/a:1024417309370. [DOI] [PubMed] [Google Scholar]
- Wu J, Hua Y, Keep RF, Nakamura T, Hoff JT, Xi G. Iron and iron-handling proteins in the brain after intracerebral hemorrhage. Stroke. 2003;34:2964–2969. doi: 10.1161/01.STR.0000103140.52838.45. [DOI] [PubMed] [Google Scholar]
- Zhang X, Surguladze N, Slagle-Webb B, Cozzi A, Connor JR. Cellular iron status influences the functional relationship between microglia and oligodendrocytes. Glia. 2006;54:795–804. doi: 10.1002/glia.20416. [DOI] [PubMed] [Google Scholar]