Abstract
Dynein light chain LC8 is the smallest subunit of the dynein motor complex and has been shown to play important roles in both dynein dependent and dynein independent physiological functions via its interaction with a number of its binding partners. It has also been linked to pathogenesis including roles in viral infections and tumorigenesis. Structural information for LC8-target proteins is critical to understanding the underlying function of LC8 in these complexes. However, some LC8-target interactions are not amenable for structural characterization by conventional structural biology techniques due to their large size, low solubility and crystallization difficulties. Here, we report magic angle spinning (MAS) NMR studies of the homodimeric apo-LC8 protein as a first effort in addressing more complex, multi-partner LC8-based protein assemblies. We have established site-specific backbone and side chain resonance assignments for the majority of the residues of LC8, and show TALOS+ predicted torsion angles ϕ and ψ in close agreement with most residues in the published LC8 crystal structure. Data obtained through these studies will provide the first step toward using MAS NMR to examine the LC8 structure, which will eventually be used to investigate protein-protein interactions in larger systems, which cannot be determined by conventional structural studies.
Keywords: solid-state NMR, magic angle spinning, MAS, dynein, LC8
INTRODUCTION
Dynein light chain LC8 (also named DLC8, PIN, DNLC1/2 and DYNLL1/2) is an integral subunit of cytoplasmic dynein, a multisubunit microtubule-based retrograde motor.1,2 LC8 is also found in many other protein complexes such as flagellar and axonemal dynein,3–5 myosin-Va6 and nuclear pore complexes (NPCs).7 Through interactions with diverse cellular protein partners and viral proteins, LC8 plays important roles in a broad range of dynein-dependent as well as dynein-independent cellular functions and has been implicated in viral infections and cancer progression.8,9 The repertoire of LC8 binding partners and the roles LC8 plays in these interactions have grown substantially over the past few years. Recently, LC8 has been shown to interact with both Ebolavirus VP3510 and bovine immunodeficiency virus BIV,11 potentially affecting the early transcription and/or the localization of the virus.12,13 Studies also indicate that LC8 regulates axonal trafficking and synaptic levels of Bassoon, a core protein component of the presynaptic cytomatrix at the active zone of neurotransmitter release.14 Lastly, LC8 has been demonstrated to be required for nuclear import of P21- activated kinase 1 (Pak1), a process critical for development of vertebrates15 and potentially involved in cancer progression.9
LC8 is homodimeric under physiological conditions, but its dimer-monomer equilibrium is critical for its biological functions.16 Several models have been proposed to explain the underlying mechanisms for this equilibrium as well as the interactions between LC8 and its diverse binding partners. Research indicates that the dimer-monomer equilibrium of LC8 can be regulated by pH changes17, the redox state18,19, and phosphorylation of S88.9,20,21 Whether phosphorylation of S88 can occur and regulate LC8 dimerization remains controversial.22 Moreover, the phosphomimetic LC8 mutant S88E is found to be dimeric in Chlamydomonas dynein, with no obvious functional deficiency caused by this mutation.23
The LC8 homodimer is frequently assumed to function as a cargo adaptor, linking its various binding partners to the dynein complex by binding the dynein intermediate chain and its cargo proteins simultaneously.24,25 However, structural and thermodynamic data do not support this model. Specifically, each reported LC8 binding protein binds to the same groove as the dynein intermediate chain. In addition, all characterized LC8 binding proteins, including the dynein intermediate chain, are homodimeric.26,27 This situation enables these targets to interact with LC8 through a bivalent-bivalent interaction, which in general is more energetically favorable than an uncoupled trivalent interaction. Instead, the LC8 dimer has been shown to stabilize weaker target dimers, particularly through the stabilization of partially disordered regions of these proteins.8 For example, LC8 has been shown to stabilize an alpha-helical coiled-coil within the microtubule binding domain of syntaphilin, leading to the regulation of mitochondrial transport and retention in axons.28
Solution-state NMR has been extensively used to solve LC8 structures,24,29,30 to investigate interactions between LC8 and its various protein and peptide binding partners,22,24,25,31–34 and to probe mechanisms underlying LC8 dimerization.17,20,21,35 In contrast, to the best of our knowledge, solid-state NMR spectroscopy has yet to be used as a tool to study the homodimeric LC8 either alone, or in complex with its binding partners, or as a part of the entire dynein assembly. Solution NMR spectroscopy cannot be used to address the entire dynein assembly since its high molecular weight (ca. 2 MDa) broadens the resonances beyond detection due to fast transverse relaxation. Similarly, other LC8 binding partners, such as retroviral Gag,36 microtubule-binding protein syntaphilin28 and nuclear pore complex,7 cannot be studied in complex with LC8 in solution because they are also too large and/or insoluble. Furthermore, many of these assemblies are difficult to crystallize and therefore not amenable to X-ray diffraction studies. In the solid state, the linewidths are independent of the molecular weight and crystalline samples are not required. With the differential and sparse isotopic enrichment protocols as well as the recently developed pulse sequences, structure and dynamics of large protein assemblies can be studied.37–42
In this work, we examine the apo-LC8 (the primary sequence and the secondary structure of the LC8 is shown in Figure 1) by magic angle spinning NMR spectroscopy as the first step toward the investigations of LC8-containing protein assemblies. We report site-specific resonance assignments and secondary structure analysis of U-15N,13C-enriched LC8 by a combination of two- and three-dimensional magic angle spinning NMR experiments. The secondary structure predicted by TALOS+43 based on SSNMR resonance assignments is in close agreement with the published LC8 crystal structure 2PG1.26 These results enable future studies including tertiary structure determination of homodimeric apo LC8 in the solid state, as well as structural and dynamics investigations of LC8-containing protein assemblies.
Figure 1.
Amino acid sequence and secondary structure of Drosophila dynein light chain LC8 generated by PDBsum69 from the X-ray coordinates deposited in the PDB file 2PG1.26 Residues M1, S2, D3 and R4 are not included.
RESULTS
Resonance assignments of LC8 by magic angle spinning solid-state NMR spectroscopy
To establish the best experimental conditions, we have first acquired 14.1 T 2D DARR spectra of LC8 at several temperatures ranging from 0 to −35 °C. The resolution and the signal-to-noise ratio in the DARR spectra acquired at −1.7 °C, −6.7 °C, −11.7 °C and −16.7 °C are essentially the same and no peak shifts were observed in this temperature range (Figure S1 of the Supporting Information). Below −21.7 °C, the spectral quality deteriorates as evidenced by the disappearance or broadening of large number of peaks. Therefore, for all experiments we have kept the sample temperature above −16.7 °C, and specific conditions for the various experiments are indicated in the Experimental section.
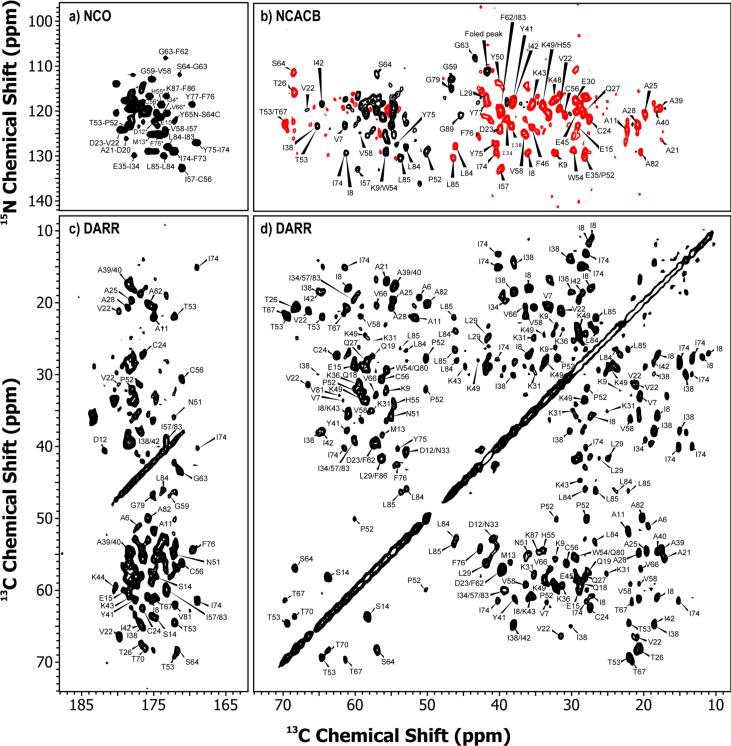
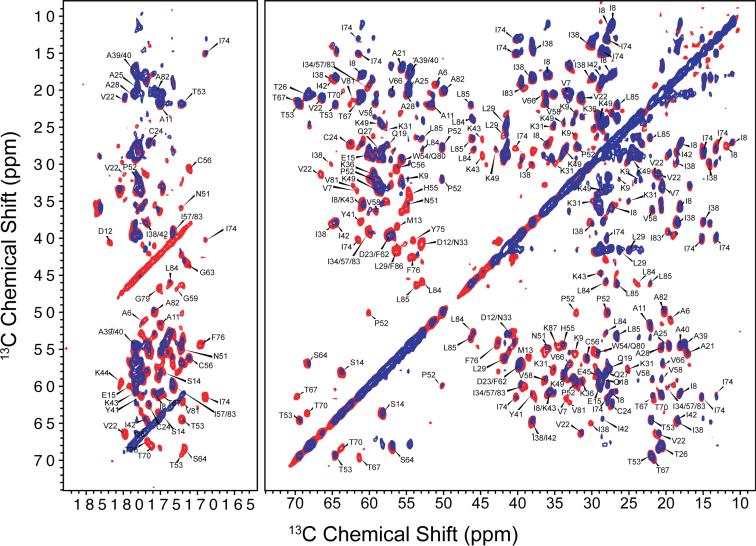
Resonance assignments of LC8 in the solid state were derived from a combination of two- and three-dimensional homo- and heteronuclear correlation MAS NMR spectra acquired at 14.1 T and 21.1 T. As expected for micro- and nanocrystalline protein preparations,39,40,44–47 the homo- and heteronuclear spectra are of high quality with the resolution of the individual peaks of the order of 0.2–0.5 ppm. Representative 2D DARR, NCACB, and NCO spectra acquired at 14.1 T are shown in Figure 2. An overlay of the 14.1 and 21.1 T DARR spectra is shown in Figure 3, and the heteronuclear 2D spectra acquired at 21.1 T are demonstrated in Figure S2 of the Supporting Information. The spectra acquired at 21.1 T exhibit superior resolution compared to the corresponding spectra acquired at 14.1 T, as expected. However, despite the resolution enhancement yielded at a high magnetic field, the two-dimensional data sets alone are insufficient for site-specific assignments due to the intrinsic signal overlap in LC8.
Figure 2.
Two-dimensional solid-state MAS NMR spectra of LC8. (a) NCO, (b) NCACB, (c) Carbonyl, and (d) aliphatic regions of the 14.4 T DARR spectrum (mixing time: 10 ms). The first contour for the spectra is set at 5×σ, with the multiplier of 1.2.
Figure 3.
Overlay of the DARR spectra acquired at 14.1 T (red) and 21.1 T (blue). DARR mixing time is 10 ms for the 14.1 T data and 50 ms for the 21.1 T data (see Table S2 in Supporting information). The spectra acquired at 21.1 T exhibit higher resolution.
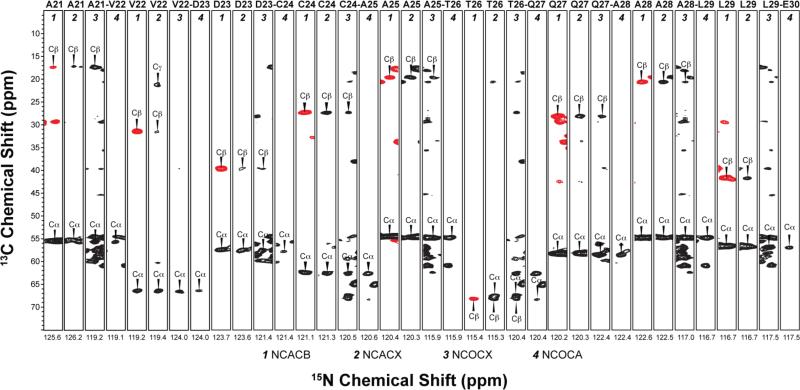
To establish residue-specific backbone assignments, we have used several three-dimensional data sets: dipolar coupling-based NCACB, NCACX, NCOCX, and scalar coupling-based NCOCA48–50 experiments, the analysis of which yielded assignments for 73 out of 89 residues. A representative backbone walk for A21–E30 is illustrated in Figure 4. For side chain assignments, we have supplemented the heteronuclear 3D data sets with 2D DARR and 3D DARR-DARR experiments, and a combination of the various spectra yielded sidechain assignments for many residues in the protein. The 13C and 15N chemical shifts for the assigned residues are tabulated in Table S1 of the Supporting Information.
Figure 4.
Backbone walk for A21–E30 using three-dimensional experiments: dipolar-based NCACB, NCACX, NCOCX and scalar-based NCOCA. Negative cross-peaks resulting from the two-bond NCβ correlations are shown in red. The first contour in all spectra is set at 5×σ with multiplier of 1.2.
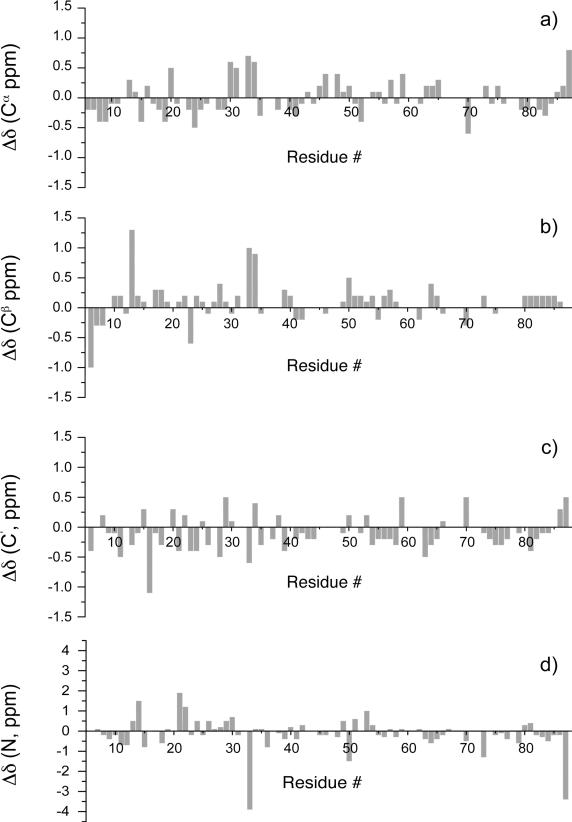
Further analysis of the 13C and 15N solid-state chemical shifts indicated that these are in very good agreement with the solution NMR chemical shifts assignments established by us earlier for the LC8 sample prepared at identical pH, with the exception of residues N33 and K87 that show large discrepancy in the backbone 15N chemical shifts. Residue-wise comparison of solid-state and solution chemical shifts is illustrated in Figure 5 and in Table S2 of the Supporting Information. The mean chemical shift deviations are: 0.3 ppm for Cα, Cβ, and C', and 0.8 ppm for NH. Close agreement between solid-state and solution shifts was also observed in our previous work on CAP-Gly40 and thioredoxin,39,51 as well as on BPTI,44 Crh42 and GB145 from other laboratories.
Figure 5.
Differences between solid-state and solution chemical shifts plotted versus residue number in LC8 for the backbone carbon and nitrogen atoms.
Torsion angle analysis of LC8 based on chemical shift assignments by TALOS+
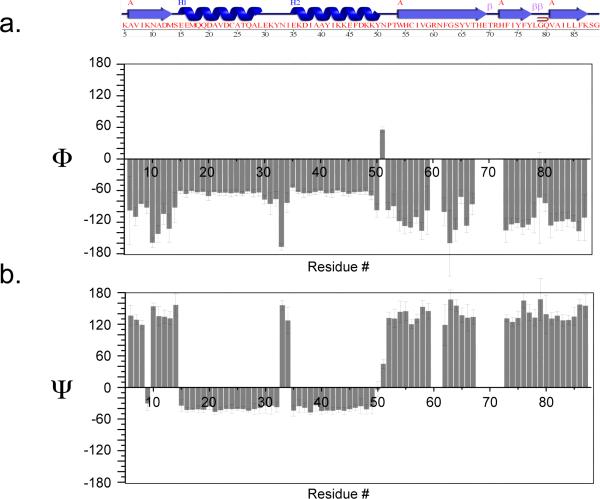
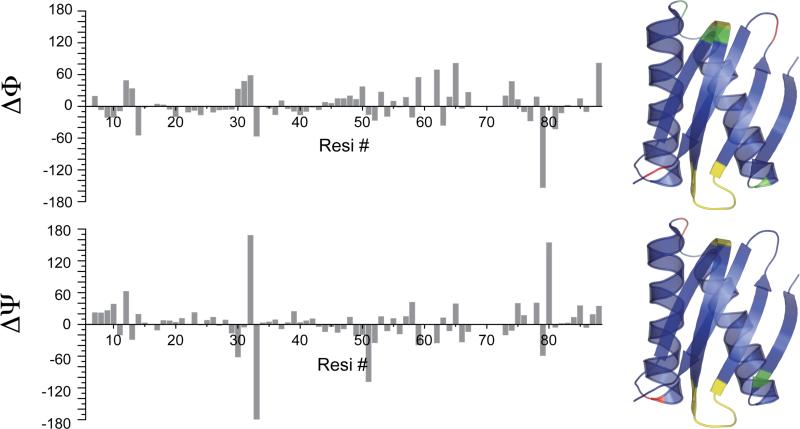
To predict the backbone torsion angles ϕ and ψ from the solid-state chemical shifts of LC8, we employed TALOS+.43 Since resonance assignments are available for 73 of 89 residues of LC8, we could not derive the torsion angles for several residues: R60, N61, H68, N69, T70, R71 and H72, because TALOS+ requires resonance assignments for three consecutive residues to make predictions for the central residue. The TALOS+-predicted torsion angles yielded the secondary structure of LC8, which is in close agreement with the crystal structure deposited in the PDB file 2PG1,26 as illustrated in Figure 6 and Figure 7. Residue-wise comparison of the SSNMR and X-ray based torsion angles indicates that the discrepancies are small for the majority of the residues except for several residues, Y32, N33, N51, G79, S88, which are located in loop or linker regions (as illustrated in Figure 7).
Figure 6.
(a) Amino acid sequence and secondary structure of dynein light chain LC8 generated by PDBsum69 from the X-ray coordinates deposited in the PDB file 2PG1.26 (b) Backbone torsion angles ϕ (top) and ψ (bottom) derived from TALOS+ analysis of isotropic solid-state chemical shifts of LC8.
Figure 7.
Residue-wise comparison of Φ and ψ torsion angles predicted by TALOS+43 and those extracted from LC8 crystal structure (PDB file 2PG126). Differences are mapped on the 2PG1 chain A, and residues are color coded as follows: blue for ΔΦ and Δψ smaller than 50 degrees; green for ΔΦ and Δψ ranging from 50 to 100 degrees; red for ΔΦ and Δψ larger than 100 degrees. Residues with no predicted angles due to the lack of resonance assignments are colored yellow (R60, N61, H68, E69, T70, R71 and H72).
DISCUSSION
With the aim of investigating interactions between LC8 and its various binding partners and gaining insight on the atomic-level resolution structures of the large LC8-based multi-component assemblies, we employed magic angle spinning solid-state NMR spectroscopy in order to derive site-specific resonance assignments, and predicted backbone torsion angles ϕ and ψ of LC8 based on the assigned isotropic chemical shifts. From a combination of homo- and heteronuclear 2D and 3D experiments, we have extracted site-specific backbone resonance assignments for 73 out of 89 residues, and obtained side chain assignments for many 13C atoms in LC8 (see Table S1 of the Supporting Information). The majority of the residues that could not be unambiguously assigned from the current datasets, namely, M1, S2, D3, R4, K5, R60, N61, H68, E69, R71, H72, L78, S88 and G89, are located in loop regions. This result is consistent with prior work of our and other laboratories44,46,52–54 indicating that it is generally more difficult to derive solid-state NMR assignments for residues in loop regions or at the termini, because generally these residues exhibit dynamic or static conformational heterogeneity and therefore, give rise to broader or missing resonances. Additionally, Y32 and D47 could not be assigned; these are located in an α-helix but their chemical shifts overlap with the shifts of other residues, hence unambiguous assignments were not possible under our conditions.
A previous solution NMR study by Mohan, et al. indicates that pH can determine the dimer-monomer equilibrium and LC8 is in its dimeric form under pH 6.17 LC8 has strong pH dependence of chemical shift patterns, indicating dimeric and monomeric forms of LC8 have very different chemical shifts.17 We noticed that SSNMR chemical shift assignments are very close to the solution NMR chemical shifts for LC8 (see figure 5) as both NMR samples are prepared at pH 6.0 (see the Materials and Methods section). We conclude that LC8 is in its dimeric form in the SSNMR sample.
We expect that the resonance assignments for LC8 can be completed with technical improvements in sample preparation and experimental design. For instance, constant-time scalar-based experiments yield inherently higher resolution than the corresponding dipolar-based experiments and are less sensitive to global molecular motion.48–50 However, the potential of these experiments was not fully exploited in our study beacause of hardware limitations on the proton decoupling powers and on the available MAS frequencies. At high MAS frequencies and high-power proton decoupling the performance of the scaler-based experiments is enhanced dramatically.48–50 Furthermore, under fast-MAS conditions (40 kHz or above), doping of the protein samples with paramagnetic salts at suitable concentrations and in low-power decoupling can yield drastic enhancements in the sensitivity due to the significantly higher spin-lattice relaxation rates (while the spin-spin relaxation rates are intact) allowing for fast recycle delays, as demonstrated recently by Ishii and coworkers.55 Similar to their results, we indeed found that LC8 samples doped with EDTA-Cu(II) have relatively long 15N T2's while the 1H T1's are dramatically shortened, indicating that this sample preparation method is beneficial for LC8 as well (data not shown). We also note, that naturally, higher resolution is afforded by recording the spectra at 21.1 T, but practical hardware limitations prevented us from being able to collect heteronuclear 3D data sets necessary for the resonance assignments. With the improvements in hardware and sample preparation, we therefore expect to achieve higher sensitivity and resolution in the future studies of LC8 at 14.1 T and higher, and to complete the resonance assignments.
Although it would be desirable to achieve complete resonance assignments, the available partial assignments already provide a platform for future studies including tertiary structure determination and characterization of protein-protein interfaces of LC8-containing protein assemblies. The close agreement between torsion angles predicted by TALOS+ on the basis of SSNMR chemical shifts, and the torsion angles from the LC8 crystal structure (PDB file 2PG1) indicates that chemical shifts are assigned reliably in the solid state. Previous structural studies22,24,26,27,56 of LC8 and its binding partners (e.g. Pak1, dynein intermediate chain IC, nNOS, etc.) revealed that residues F62–T67 form an antiparallel β sheet with a portion of the bound partner protein. It is likely that LC8 utilizes this mechanism to also interact with other proteins with fine-tuning provided by global structure and dynamics of both LC8 and the binding partner. Therefore, it is of interest to examine the structure adopted by this stretch of residues when LC8 forms large assemblies. Through our current work, chemical shift assignments are available for residues F62–T67, and indicate that this stretch of residues is in a β sheet, while the assignments for the flanking residues are missing (see Table S1 of the supporting information). Therefore, even in unfavorable cases where the chemical shifts for flanking residues are unknown such as the F62–T67 stretch above, we will still be able to investigate the functionally important interfaces of assemblies formed by LC8 and its various binding partners, through chemical shift perturbation approaches and/or differential labeling based MAS NMR experiments.37,41
EXPERIMENTS AND METHODS
Materials
Common chemicals were purchased from Fisher Scientific or Sigma Aldrich. 15N NH4Cl and U-13C6 glucose were purchased from Cambridge Laboratories, Inc.
Expression and purification of isotopically enriched LC8
Subcloning of wild type Drosophila LC8 (accession number NP 525075), expression and purification of natural abundance or U-15N, 13C isotopically enriched LC8 have been described previously.22 For isotope enrichment the Bracken protocol57 was followed. The yields of pure natural abundance and isotopically enriched LC8 are 34 mg (per 1 L of LB) and 20 mg (per 1L of LB and 250 ml of M9), respectively.
Preparation of solid-state NMR samples
11 mg pure U-13C,15N-enriched LC8 were dialyzed against 10 mM MES buffer (10 mM MgCl2, pH 6.0) and concentrated to 30 mg/ml. Solution of 32% PEG-3350 (also dissolved in 10 mM MES buffer) was gradually added to the LC8 solution following the controlled precipitation protocol developed previously for thioredoxin.39 This condition was chosen from a minimal (24 well) hanging drop screen, which yielded LC8 microcrystals in a hanging drop. More than 90% of the protein was precipitated, as confirmed by the Bradford assay. The LC8/PEG-3350 mixture was centrifuged, and the pellet was used for solid-state NMR experiments. 14.3 mg of hydrated precipitate were packed into a 3.2 mm Varian rotor and sealed using an upper spacer and a top spinner.
Solid-state NMR spectroscopy
Magic angle spinning solid-state NMR spectra were acquired at 14.1 T (600 MHz) on a narrow bore Varian InfinityPlus instrument outfitted with a 3.2 mm triple resonance T3 probe; Larmor frequencies are 599.5 MHz for 1H, 150.7 MHz for 13C, and 60.7 MHz for 15N. Dipolar-based two- and three-dimensional DARR,58 NCA, NCO, and NCACB spectra were collected at the MAS frequency of 10.000±0.001 kHz controlled by a Varian MAS controller. The dipolar NCACX and NCOCX experiments utilized the SPECIFIC-CP59 heteronuclear magnetization transfer followed by DARR homonuclear transfer; in the NCACB experiment the homonuclear DREAM mixing60 with a tangent ramp was used. Scalar-based two dimensional NCO50 and three-dimensional NCOCA48 spectra were collected at the MAS frequency of 14.705±0.001 kHz controlled by a Varian MAS controller. The temperature was calibrated for this probe at different MAS frequencies using a PbNO3 temperature sensor,61 and the actual temperature at the sample was maintained to within ±0.5 °C throughout the experiments using the Varian temperature controller. The DARR spectra were acquired at temperatures of −1.7 °C, −6.7, −11.7 °C, −16.7 °C and −21.7 °C. The heteronuclear 2D and 3D spectra were acquired at −16.7 °C (with the exception that the CANCO was acquired at −11.7 °C). 1H, 13C and 15N chemical shifts were referenced with respect to DSS, adamantane and ammonium chloride used as external referencing standards.62 The typical 90-degree pulse lengths were 2.7 μs (1H), 4.5 μs (13C), and 5 μs (15N). The 1H-13C(15N) cross polarization was performed with a linear amplitude ramp (80–100%) on 13C(15N); the 1H radio frequency field was 50 kHz with the center of ramp Hartmann-Hahn matched to the first spinning sideband. The 1H-13C and 1H-15N contact times were 1 ms and 1.6 ms, respectively. In the CANCO experiment the 1H-13C contact time was set 200 μs to preferentially excite the 13C aliphatic region. The Z-filter time was 30 ms in all scalar-based experiments. In the dipolar-based experiments, the typical 15N-to-13C SPECIFIC-CP transfer was performed with 25 kHz radio frequency field for 15N and ~15 kHz for the center of a tangential ramp on 13C; the mixing times were 6.7 ms. The DARR mixing time was set to either 2 ms or 10 ms for recoupling of two 13C nuclei separated by a short distance (mostly one-bond), and the 1H RF field strength during DARR was 10 kHz. In the DREAM mixing period (2.1 ms), a tangent ramp was applied on 13C according to the condition nωr = (ωrf2 + ω12)1/2) + (ωrf2 + ω22)1/2 55. For the scalar-based NCOCA experiment, τq = τ2 = 10.9 ms; τ3 = τ4 = 2.72 ms. The Z-filter time was 30 ms in all scalar-based experiments. TPPM decoupling63 was used, and the decoupling field strengths ranged between 80 and 100 kHz in different experiments. Recycle delays in all experiments were 2 s. TPPI64 was used for frequency discrimination in the indirect dimensions.
DARR and dipolar-based NCA and NCO spectra of LC8 were also acquired at at 21.1 T at EMSL-PNNL, on a medium bore 900 MHz Varian Inova instrument outfitted with a 3.2 mm triple resonance BioMAS probe; the Larmor frequencies are 900.575 MHz for 1H, 226.47 MHz for 13C, and 92.26 for 15N. The MAS frequency was 14.000±0.001 kHz controlled by a Varian MAS controller. The temperature was 0 °C and was maintained to within ±0.5 °C throughout the experiments using the Varian temperature controller. The typical pulse lengths were 3.0 μs (1H), 5.5 μs (13C), and 6 μs (15N); the 1H-13C and 1H-15N cross polarizations were performed with a tangent amplitude ramp (80–100%); the 1H radio frequency fields were 70.4 and 60.7 kHz, respectively with the center of the ramp Hartmann-Hahn matched to the second spinning sideband; the 1H-13C and 1H-15N contact times were 2 and 1 ms, respectively. In the NCA and NCO experiments, were performed with a tangent amplitude ramp (80–100%); the 13C radio frequency fields were 13 and 18 kHz, respectively with the center of the ramp Hartmann-Hahn matched to the first spinning sideband; the SPECIFIC-CP mixing times were 6.0 and 6.4 ms, respectively. TPPM decoupling (83 kHz) was applied during the evolution and acquisition periods. The 1H field strength during DARR was 14 kHz; DARR mixing time was 50 ms; under these conditions predominantly one-bond correlations appear in the spectra.
Other acquisition and processing parameters for data sets acquired at 14.1 and 21.1 T are specified in the figure captions and in the supporting information.
NMR data processing and analysis
The spectra were processed in NMRpipe65 and analyzed in Sparky.66 For 2D solid state NMR data, 90-, 60-, or 30- degree shifted sine bell apodization followed by a Lorentzian-to-Gaussian transformation was applied in both dimensions; forward linear prediction to twice the number of the original data points was applied in the indirect dimension for some data sets followed by zero filling to twice the total number of points. The 3D data sets were processed by using 30- or 60- degree shifted sinebells in all dimensions followed by a Lorentzian-to-Gaussian transformation (for resolution enhancement) and by using 90- degree shifted sinebells in all dimensions followed by a Lorentzian-to-Gaussian transformation (for sensitivity enhancement). The 3D spectra were also processed with maximum entropy reconstruction as implemented in the program Roland NMR Toolkit.67,68 Detailed information about processing parameters is specified in the supporting information.
CONCLUSIONS
We have established site-specific backbone and side chain resonance assignments for the majority of the residues of LC8 through magic angle spinning solid-state NMR spectroscopy. Based on these assignments, we derived torsion angles ϕ, ψ by TALOS+. The predicted angles are in close agreement with crystal structure (2PG1) for most of the residues except for several residues located in loop or linker regions.
Supplementary Material
SYNOPSIS.
Resonance assignments and secondary structure of the dynein light chain 8 (LC8) protein are presented. 73 of 89 residues have been assigned on the basis of a series of two- and three-dimensional MAS NMR experiments.
ACKNOWLEDGMENT
This work was supported by the National Institutes of Health (NIH Grants R01GM085396 from NIGMS and P20RR017716-08 from NCRR). The 21.1 T spectra were acquired at the Environmental Molecular Sciences Laboratory, a national scientific user facility sponsored by the United States Department of Energy's Office of Biological and Environmental Research and located at Pacific Northwest National Laboratory in Richland, WA. Andrew Lipton, Jesse Sears, Michael Froehlke, Sarah Burton, David Hoyt and Joseph Ford are thanked for their kind assistance during our visit to EMSL.
Footnotes
SUPPORTING INFORMATION 14.1 T 2D DARR, NCA, NCACB, NCACX and NCOCX spectra of DLC8; solid-state chemical shifts of DLC8; temperature-dependent DARR spectra; acquisition and processing parameters for solid-state and solution NMR experiments. This material is available free of charge via the Internet at http://pubs.nrc-cnrc.gc.ca.
REFERENCES
- (1).King SM. Biochim. Biophys. Acta. 2000;1496:60–75. doi: 10.1016/s0167-4889(00)00009-4. [DOI] [PubMed] [Google Scholar]
- (2).Pfister KK, Shah PR, Hummerich H, Russ A, Cotton J, Annuar AA, King SM, Fisher EM. PLoS Genet. 2006;2:e1. doi: 10.1371/journal.pgen.0020001. [DOI] [PMC free article] [PubMed] [Google Scholar]
- (3).Harrison A, Olds-Clarke P, King SM. J. Cell Biol. 1998;140:1137–47. doi: 10.1083/jcb.140.5.1137. [DOI] [PMC free article] [PubMed] [Google Scholar]
- (4).King SM, Patel-King RS. J. Biol. Chem. 1995;270:11445–52. doi: 10.1074/jbc.270.19.11445. [DOI] [PubMed] [Google Scholar]
- (5).Pazour GJ, Wilkerson CG, Witman GB. J. Cell Biol. 1998;141:979–92. doi: 10.1083/jcb.141.4.979. [DOI] [PMC free article] [PubMed] [Google Scholar]
- (6).Espindola FS, Suter DM, Partata LB, Cao T, Wolenski JS, Cheney RE, King SM, Mooseker MS. Cell. Motil. Cytoskeleton. 2000;47:269–81. doi: 10.1002/1097-0169(200012)47:4<269::AID-CM2>3.0.CO;2-G. [DOI] [PubMed] [Google Scholar]
- (7).Stelter P, Kunze R, Flemming D, Hopfner D, Diepholz M, Philippsen P, Bottcher B, Hurt E. Nat. Cell Biol. 2007;9:788–96. doi: 10.1038/ncb1604. [DOI] [PubMed] [Google Scholar]
- (8).Barbar E. Biochemistry. 2008;47:503–508. doi: 10.1021/bi701995m. [DOI] [PubMed] [Google Scholar]
- (9).Vadlamudi RK, Bagheri-Yarmand R, Yang Z, Balasenthil S, Nguyen D, Sahin AA, den Hollander P, Kumar R. Cancer Cell. 2004;5:575–85. doi: 10.1016/j.ccr.2004.05.022. [DOI] [PubMed] [Google Scholar]
- (10).Kubota T, Matsuoka M, Chang TH, Bray M, Jones S, Tashiro M, Kato A, Ozato K. J. Virol. 2009;83:6952–6. doi: 10.1128/JVI.00480-09. [DOI] [PMC free article] [PubMed] [Google Scholar]
- (11).Su Y, Qiao W, Guo T, Tan J, Li Z, Chen Y, Li X, Li Y, Zhou J, Chen Q. Cell. Microbiol. 2010;12:1098–107. doi: 10.1111/j.1462-5822.2010.01453.x. [DOI] [PubMed] [Google Scholar]
- (12).Tan GS, Preuss MA, Williams JC, Schnell MJ. Proc Natl Acad Sci U S A. 2007;104:7229–34. doi: 10.1073/pnas.0701397104. [DOI] [PMC free article] [PubMed] [Google Scholar]
- (13).Moseley GW, Roth DM, DeJesus MA, Leyton DL, Filmer RP, Pouton CW, Jans DA. Mol. Biol. Cell. 2007;18:3204–13. doi: 10.1091/mbc.E07-01-0030. [DOI] [PMC free article] [PubMed] [Google Scholar]
- (14).Fejtova A, Davydova D, Bischof F, Lazarevic V, Altrock WD, Romorini S, Schone C, Zuschratter W, Kreutz MR, Garner CC, Ziv NE, Gundelfinger ED. J. Cell Biol. 2009;185:341–55. doi: 10.1083/jcb.200807155. [DOI] [PMC free article] [PubMed] [Google Scholar]
- (15).Lightcap CM, Kari G, Arias-Romero LE, Chernoff J, Rodeck U, Williams JC. PLoS One. 2009;4:e6025. doi: 10.1371/journal.pone.0006025. [DOI] [PMC free article] [PubMed] [Google Scholar]
- (16).Barbar E, Kleinman B, Imhoff D, Li M, Hays TS, Hare M. Biochemistry. 2001;40:1596–1605. doi: 10.1021/bi002278+. [DOI] [PubMed] [Google Scholar]
- (17).Mohan PM, Barve M, Chatterjee A, Hosur RV. Protein Sci. 2006;15:335–42. doi: 10.1110/ps.051854906. [DOI] [PMC free article] [PubMed] [Google Scholar]
- (18).Jung Y, Kim H, Min SH, Rhee SG, Jeong W. J. Biol. Chem. 2008;283:23863–71. doi: 10.1074/jbc.M803072200. [DOI] [PMC free article] [PubMed] [Google Scholar]
- (19).King SM. Sci. Signal. 2008;1:pe51. doi: 10.1126/scisignal.147pe51. [DOI] [PubMed] [Google Scholar]
- (20).Song Y, Benison G, Nyarko A, Hays TS, Barbar E. J. Biol. Chem. 2007;282:17272–9. doi: 10.1074/jbc.M610445200. [DOI] [PubMed] [Google Scholar]
- (21).Song C, Wen W, Rayala SK, Chen M, Ma J, Zhang M, Kumar R. J. Biol. Chem. 2008;283:4004–13. doi: 10.1074/jbc.M704512200. [DOI] [PubMed] [Google Scholar]
- (22).Lightcap CM, Sun S, Lear JD, Rodeck U, Polenova T, Williams JC. J. Biol. Chem. 2008;283:27314–24. doi: 10.1074/jbc.M800758200. [DOI] [PMC free article] [PubMed] [Google Scholar]
- (23).Yang P, Yang C, Wirschell M, Davis S. J. Biol. Chem. 2009;284:31412–21. doi: 10.1074/jbc.M109.050666. [DOI] [PMC free article] [PubMed] [Google Scholar]
- (24).Fan J, Zhang Q, Tochio H, Li M, Zhang M. J. Mol. Biol. 2001;306:97–108. doi: 10.1006/jmbi.2000.4374. [DOI] [PubMed] [Google Scholar]
- (25).Lo KW, Kan HM, Chan LN, Xu WG, Wang KP, Wu Z, Sheng M, Zhang M. J. Biol. Chem. 2005;280:8172–9. doi: 10.1074/jbc.M411408200. [DOI] [PubMed] [Google Scholar]
- (26).Williams JC, Roulhac PL, Roy AG, Vallee RB, Fitzgerald MC, Hendrickson WA. Proc. Natl. Acad. Sci. U.S.A. 2007;104:10028–33. doi: 10.1073/pnas.0703614104. [DOI] [PMC free article] [PubMed] [Google Scholar]
- (27).Benison G, Karplus PA, Barbar E. J. Mol. Biol. 2007;371:457–468. doi: 10.1016/j.jmb.2007.05.046. [DOI] [PubMed] [Google Scholar]
- (28).Chen YM, Gerwin C, Sheng ZH. J. Neurosci. 2009;29:9429–38. doi: 10.1523/JNEUROSCI.1472-09.2009. [DOI] [PMC free article] [PubMed] [Google Scholar]
- (29).Wang W, Lo KW, Kan HM, Fan JS, Zhang M. J. Biol. Chem. 2003;278:41491–9. doi: 10.1074/jbc.M307118200. [DOI] [PubMed] [Google Scholar]
- (30).Makokha M, Huang YJ, Montelione G, Edison AS, Barbar E. Protein Sci. 2004;13:727–34. doi: 10.1110/ps.03462204. [DOI] [PMC free article] [PubMed] [Google Scholar]
- (31).Fan JS, Zhang Q, Tochio H, Zhang M. J. Biomol. NMR. 2002;23:103–14. doi: 10.1023/a:1016332918178. [DOI] [PubMed] [Google Scholar]
- (32).Hall J, Hall A, Pursifull N, Barbar E. Biochemistry. 2008;47:11940–52. doi: 10.1021/bi801093k. [DOI] [PubMed] [Google Scholar]
- (33).Benison G, Karplus PA, Barbar E. J. Mol. Biol. 2008;384:954–66. doi: 10.1016/j.jmb.2008.09.083. [DOI] [PMC free article] [PubMed] [Google Scholar]
- (34).Benison G, Barbar E. Methods Enzymol. 2009;455:237–258. doi: 10.1016/S0076-6879(08)04209-2. [DOI] [PubMed] [Google Scholar]
- (35).Nyarko A, Cochrun L, Norwood S, Pursifull N, Voth A, Barbar E. Biochemistry. 2005;44:14248–55. doi: 10.1021/bi0512694. [DOI] [PubMed] [Google Scholar]
- (36).Petit C, Giron ML, Tobaly-Tapiero J, Bittoun P, Real E, Jacob Y, Tordo N, De The H, Saib A. J. Cell Sci. 2003;116:3433–42. doi: 10.1242/jcs.00613. [DOI] [PubMed] [Google Scholar]
- (37).Yang J, Paramasivan S, Marulanda D, Cataidi M, Tasayco ML, Polenova T. Magn. Reson. Chem. 2007;45:S73–S83. doi: 10.1002/mrc.2092. [DOI] [PubMed] [Google Scholar]
- (38).Yang J, Tasayco ML, Polenova T. J. Am. Chem. Soc. 2008;130:5798–807. doi: 10.1021/ja711304e. [DOI] [PubMed] [Google Scholar]
- (39).Marulanda D, Tasayco ML, McDermott A, Cataldi M, Arriaran V, Polenova T. J. Am. Chem. Soc. 2004;126:16608–16620. doi: 10.1021/ja0464589. [DOI] [PubMed] [Google Scholar]
- (40).Sun S, Siglin A, Williams JC, Polenova T. J. Am. Chem. Soc. 2009;131:10113–26. doi: 10.1021/ja902003u. [DOI] [PubMed] [Google Scholar]
- (41).Etzkorn M, Bockmann A, Lange A, Baldus M. J. Am. Chem. Soc. 2004;126:14746–51. doi: 10.1021/ja0479181. [DOI] [PubMed] [Google Scholar]
- (42).Bockmann A, Lange A, Galinier A, Luca S, Giraud N, Juy M, Heise H, Montserret R, Penin F, Baldus M. J. Biomol. NMR. 2003;27:323–39. doi: 10.1023/a:1025820611009. [DOI] [PubMed] [Google Scholar]
- (43).Shen Y, Delaglio F, Cornilescu G, Bax A. J. Biomol. NMR. 2009;44:213–23. doi: 10.1007/s10858-009-9333-z. [DOI] [PMC free article] [PubMed] [Google Scholar]
- (44).McDermott A, Polenova T, Bockmann A, Zilm KW, Paulsen EK, Martin RW, Montelione GT. J. Biomol. NMR. 2000;16:209–219. doi: 10.1023/a:1008391625633. [DOI] [PubMed] [Google Scholar]
- (45).Franks WT, Zhou DH, Wylie BJ, Money BG, Graesser DT, Frericks HL, Sahota G, Rienstra CM. J. Am. Chem. Soc. 2005;127:12291–12305. doi: 10.1021/ja044497e. [DOI] [PubMed] [Google Scholar]
- (46).Igumenova TI, Wand AJ, McDermott AE. J. Am. Chem. Soc. 2004;126:5323–5331. doi: 10.1021/ja030546w. [DOI] [PubMed] [Google Scholar]
- (47).Pauli J, van Rossum B, Forster H, de Groot HJ, Oschkinat H. J. Magn. Reson. 2000;143:411–6. doi: 10.1006/jmre.2000.2029. [DOI] [PubMed] [Google Scholar]
- (48).Chen L, Kaiser JM, Polenova T, Yang J, Rienstra CM, Mueller LJ. J. Am. Chem. Soc. 2007;129:10650–10651. doi: 10.1021/ja073498e. [DOI] [PubMed] [Google Scholar]
- (49).Chen L, Olsen RA, Elliott DW, Boettcher JM, Zhou DH, Rienstra CM, Mueller LJ. J. Am. Chem. Soc. 2006;128:9992–9993. doi: 10.1021/ja062347t. [DOI] [PubMed] [Google Scholar]
- (50).Chen LL, Kaiser JM, Lai JF, Polenova T, Yang J, Rienstra CM, Mueller LJ. Magn. Reson. Chem. 2007;45:S84–S92. doi: 10.1002/mrc.2107. [DOI] [PubMed] [Google Scholar]
- (51).Marulanda D, Tasayco ML, Cataldi M, Arriaran V, Polenova T. J. Phys. Chem. B. 2005;109:18135–18145. doi: 10.1021/jp052774d. [DOI] [PubMed] [Google Scholar]
- (52).Igumenova TI, McDermott AE, Zilm KW, Martin RW, Paulson EK, Wand AJ. J. Am. Chem. Soc. 2004;126:6720–6727. doi: 10.1021/ja030547o. [DOI] [PubMed] [Google Scholar]
- (53).Pauli J, Baldus M, van Rossum B, de Groot H, Oschkinat H. ChemBioChem. 2001;2:272–81. doi: 10.1002/1439-7633(20010401)2:4<272::AID-CBIC272>3.0.CO;2-2. [DOI] [PubMed] [Google Scholar]
- (54).Han Y, Ahn J, Concel J, Byeon IJ, Gronenborn AM, Yang J, Polenova T. J. Am. Chem. Soc. 2010;132:1976–87. doi: 10.1021/ja908687k. [DOI] [PMC free article] [PubMed] [Google Scholar]
- (55).Wickramasinghe NP, Parthasarathy S, Jones CR, Bhardwaj C, Long F, Kotecha M, Mehboob S, Fung LW, Past J, Samoson A, Ishii Y. Nat. Methods. 2009;6:215–8. doi: 10.1038/nmeth.1300. [DOI] [PMC free article] [PubMed] [Google Scholar]
- (56).Liang J, Jaffrey SR, Guo W, Snyder SH, Clardy J. Nat. Struct. Biol. 1999;6:735–40. doi: 10.1038/11501. [DOI] [PubMed] [Google Scholar]
- (57).Marley J, Lu M, Bracken C. J. Biomol. NMR. 2001;20:71–5. doi: 10.1023/a:1011254402785. [DOI] [PubMed] [Google Scholar]
- (58).Takegoshi K, Nakamura S, Terao T. Chem. Phys. Lett. 2001;344:631–637. [Google Scholar]
- (59).Baldus M, Petkova AT, Herzfeld J, Griffin RG. Mol. Phys. 1998;95:1197–1207. [Google Scholar]
- (60).Verel R, Baldus M, Ernst M, Meier BH. Chem. Phys. Lett. 1998;287:421–428. [Google Scholar]
- (61).Neue G, Dybowski C. Solid State Nucl. Mag. 1997;7:333–336. doi: 10.1016/s0926-2040(96)01291-x. [DOI] [PubMed] [Google Scholar]
- (62).Morcombe CR, Zilm KW. J. Magn. Reson. 2003;162:479–486. doi: 10.1016/s1090-7807(03)00082-x. [DOI] [PubMed] [Google Scholar]
- (63).Bennett AE, Rienstra CM, Auger M, Lakshmi KV, Griffin RG. J. Chem. Phys. 1995;103:6951–6958. [Google Scholar]
- (64).Marion D, Wuthrich K. Biochem. Biophys. Res. Commun. 1983;113:967–974. doi: 10.1016/0006-291x(83)91093-8. [DOI] [PubMed] [Google Scholar]
- (65).Delaglio F, Grzesiek S, Vuister GW, Zhu G, Pfeifer J, Bax A. J. Biomol. NMR. 1995;6:277–93. doi: 10.1007/BF00197809. [DOI] [PubMed] [Google Scholar]
- (66).Goddard TD, Kneller DG. University of California, San Francisco; San Francisco: [Google Scholar]
- (67).Stern AS, Li KB, Hoch JC. J. Am. Chem. Soc. 2002;124:1982–1993. doi: 10.1021/ja011669o. [DOI] [PubMed] [Google Scholar]
- (68).Mobli M, Maciejewski MW, Gryk MR, Hoch JC. J. Biomol. NMR. 2007;39:133–139. doi: 10.1007/s10858-007-9180-8. [DOI] [PubMed] [Google Scholar]
- (69).Laskowski RA, Hutchinson EG, Michie AD, Wallace AC, Jones ML, Thornton JM. Trends. Biochem. Sci. 1997;22:488–90. doi: 10.1016/s0968-0004(97)01140-7. [DOI] [PubMed] [Google Scholar]
Associated Data
This section collects any data citations, data availability statements, or supplementary materials included in this article.


