

This study addresses the question of specificity in DNA-binding and regulatory interactions by elucidating the molecular activity of MITF, the master regulator of melanocyte development, at the structural level. MITF's DNA-binding specificity is determined by an unusual nonpolar interaction, and its dimerization specificity is determined by a unique kink in the zipper region. The structures uncover a novel feature of this bHLH protein subfamily, providing valuable insight into Waardenburg syndrome mutations and also having implications for MITF's potential as a melanoma therapeutic target.
Keywords: melanocyte regulation, transcription factor, DNA binding, leucine zipper, crystal structure
Abstract
Microphthalmia-associated transcription factor (MITF) is a master regulator of melanocyte development and an important oncogene in melanoma. MITF heterodimeric assembly with related basic helix–loop–helix leucine zipper transcription factors is highly restricted, and its binding profile to cognate DNA sequences is distinct. Here, we determined the crystal structure of MITF in its apo conformation and in the presence of two related DNA response elements, the E-box and M-box. In addition, we investigated mouse and human Mitf mutations to dissect the functional significance of structural features. Owing to an unusual three-residue shift in the leucine zipper register, the MITF homodimer shows a marked kink in one of the two zipper helices to allow an out-of-register assembly. Removal of this insertion relieves restricted heterodimerization by MITF and permits assembly with the transcription factor MAX. Binding of MITF to the M-box motif is mediated by an unusual nonpolar interaction by Ile212, a residue that is mutated in mice and humans with Waardenburg syndrome. As several related transcription factors have low affinity for the M-box sequence, our analysis unravels how these proteins discriminate between similar target sequences. Our data provide a rational basis for targeting MITF in the treatment of important hereditary diseases and cancer.
The microphthalmia-associated transcription factor (MITF) is a member of the basic helix–loop–helix zipper (bHLHZip) transcription factor protein family. MITF functions as a master regulator in melanocytes and is essential for melanocyte development, survival, and differentiation (Cheli et al. 2009). It also has crucial roles in osteoclasts, mast cells, the retinal pigment epithelium, and stem cells of the hair bulge (Steingrimsson et al. 2004; Nishimura et al. 2005). Mutations in the Mitf gene have been found in various species, ranging from zebrafish to humans (Steingrimsson et al. 2004). In mice, there are >30 different alleles that can be ranked according to the severity of their phenotypes (Steingrimsson et al. 2004). The most severe allele—the Mitfmi mutation (R217del)—results in premature death, whereas the mildest allele—Mitfmi-spotted (Mitfmi-sp)—lacks an 18-base-pair (bp) exon equivalent to residues 187–192 and does not lead to a visible phenotype in homozygous mice. However, when combined with other mutations at the locus, it results in enhanced spotting (Steingrimsson et al. 2004). The MitfMi-White (MitfMi-Wh) mutation, in which Ile212 is replaced by an asparagine, exhibits a particularly interesting phenotype and shows interallelic complementation (Steingrimsson 2010). In humans, MITF mutations result in two related pigmentation and deafness syndromes: Waardenburg type 2A (WS2A) and Tietz syndromes (Pingault et al. 2010).
Importantly, recent evidence shows that MITF plays a crucial role in the development of melanoma. Mitf has been proposed to act as a lineage survival oncogene (Garraway et al. 2005) that acts downstream from the BRAF pathway (Wellbrock et al. 2008), which is a major target of melanoma therapy. An activating germline mutation in Mitf has recently been described in a small fraction of melanoma patients (Bertolotto et al. 2011; Yokoyama et al. 2011). Furthermore, Mitf has been proposed to act as a rheostat in melanoma, mediating a switch from proliferating tumor cells to quiescent migrating cells (Carreira et al. 2006).
At the molecular level, MITF is closely related to the TFE family of bHLHZip transcription factors, which includes TFEB, TFEC, and TFE3. MITF binds DNA as both a homodimer and a heterodimer with each of the TFE proteins (Hemesath et al. 1994). In contrast, MITF does not form heterodimers with other bHLHZip proteins such as MYC, MAX, or USF (Hemesath et al. 1994), despite a common ability to bind to the palindromic CACGTG E-box motif through a highly conserved set of basic residues in their DNA-binding regions. These observations suggest that MITF and the TFE proteins form a distinct bHLHZip protein subfamily, but how they restrict their dimerization potential has remained enigmatic. Unlike other bHLHZip transcription factors, MITF also binds to the asymmetric TCATGTG M-box sequence, which includes an additional 5′ end flanking thymidine (Aksan and Goding 1998).
Here, we characterized the DNA-binding and dimerization specificities of MITF by structural and functional analyses. We show that, unlike other known bHLHZip transcription factors, the heptad repeat register of the leucine zipper is broken by a three-residue insertion that generates a marked kink in one of the two zipper helices. We demonstrate that this insert limits the ability of MITF to dimerize only with those related bHLHZip transcription factors that contain the same type of insertion. In the MITF DNA-binding domain, we detected a crucial nonpolar side chain interaction between Ile212 and the M-box motif, which is not observed in the similar MITF/E-box complex or in DNA complexes of the related bHLHZip transcription factors MYC, MAD, and MAX. For the MITF I212N mutant, we detected a substantial increase in nonspecific DNA binding and a concomitant reduction in specific M-box binding. Taking our data together, MITF shows unexpected and unusual structural features in terms of its mechanism for homodimeric and heterodimeric protein assembly and a delicate balance between specific and nonspecific DNA interactions. These features explain its distinct role as a master transcription factor.
Results
Purification and X-ray structure determination
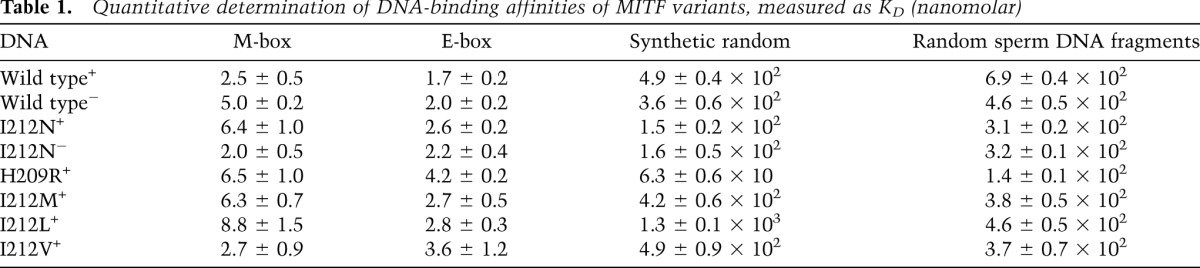
For structural and functional analyses, we used the central part of the mouse MITF protein (residues 180–296) that includes the DNA-binding region followed by the dimerization-promoting leucine zipper region. This protein, which we refer to as MITF+, and the alternatively spliced version MITF− (lacking residues 187–192) were purified separately. We quantitatively determined the binding affinities of these MITF fragments to 16-bp oligonucleotides encompassing the E-box or M-box motifs (Fig. 1A) by isothermal titration calorimetry (ITC). They bind to both motifs with similar dissociation constants (KD) of 2–5 nM (Supplemental Fig. S1; Table 1; Supplemental Table S1), but the MITF− variant binds with slightly less affinity to both the E-box and the M-box. This finding is in agreement with previous electrophoretic mobility shift assay (EMSA) data (Hemesath et al. 1994) and indicates a moderate modulation of the specific DNA-binding affinity of the two forms. Binding of MITF to a synthetic random oligonucleotide was at least two orders of magnitude weaker than to the E-box and M-box (Fig. 1A; Table 1). Furthermore, the binding affinity for random genomic DNA fragments extracted from herring sperm was similar to that of the synthetic random oligonucleotide (Table 1).
Figure 1.

Structural characterization of the MITF DNA-binding and assembly region. (A) DNA oligonucleotide sequences used were E-box, M-box, and random sequence. Central E-box and M-box motifs are in yellow, and bases in positions −4 and −1 that are different in the M-box/E-box are highlighted in orange in the M-box motif. (B) Crystal structures of MITF in the absence of DNA (apo conformation) and in the presence of 16-bp oligonucleotides covering the E-box and M-box response motifs. Proteins are shown in cartoon representation, and DNA is illustrated in hybrid cartoon/surface representation. Missing protein loop regions are shown by dotted lines.. The MITF dimer is cyan and green. (Left panel) In the MITF apo structure, residues 260 to the C terminus of the visible sequence from one of the two protomers are blue to indicate the presence of the kink observed in the apo structure at residue 259, and DNA is in gray. Structural segments are indicated. (BR) Basic region. The N and C termini of MITF are labeled. E-box and M-box elements are colored as in A.
Table 1.
Quantitative determination of DNA-binding affinities of MITF variants, measured as KD (nanomolar)
We determined the crystal structures of three versions of MITF (Fig. 1B; Supplemental Table S2): (1) the apo structure at 1.95 Å resolution using a version of MITF that lacks part of the basic region (residues 217–296), with experimental phases from a selenomethionine-substituted version of the protein; (2) the structure of the MITF/E-box complex at 2.95 Å resolution; and (3) the structure of the MITF/M-box complex at 2.60 Å resolution. For the two latter structures, we used the MITF+ construct encompassing the complete DNA-binding region (residues 180–296) and used the apo structure as a template to obtain a molecular replacement solution. In all three structures, MITF forms a leucine zipper-mediated homodimer, demonstrating that MITF self-assembly does not depend on bound DNA. In the two MITF/DNA complexes, the protein E-box- and M-box-binding sites and corresponding oligonucleotides are entirely defined. The overall DNA curvature in MITF/M-box and MITF/E-box is 20.5° and 18.5°, respectively, indicating that the presence of MITF does not lead to major bending of DNA. The MITF region N-terminal to the DNA-binding segment (residues 180–205), which includes the six-residue insert sequence (residues 187–192) that is lacking in the alternatively spliced MITF− variant (Hemesath et al. 1994), and the C-terminal part of the leucine zipper segment (residues 276–296) remained invisible in the final electron density (Supplemental Table S2). For this reason and because of the superior resolution of the respective diffraction data, we used the MITF apo structure for further analysis of its overall architecture. This knowledge of the MITF structure has allowed all known MITF mutations to be mapped onto its three-dimensional topography and the respective structural/functional relationships to be interpreted (Supplemental Fig. S2; Supplemental Table S3).
MITF dimeric assembly by a kinked leucine zipper
The structural organization of the DNA-binding region of MITF and the adjacent HLH motif consisting largely of two α helices is similar to that observed in other bHLHZip transcription factors (Jones 2004). The N-terminal part of the first extended α helix (residues 208–230) constitutes the basic region and provides most of the specific DNA major groove contacts (Fig. 1B). The following HLH domain is composed of the C-terminal part of the first helix and the N-terminal part of the second helix, separated by a long loop (residues 231–243). By forming a four-helical bundle motif comprising two MITF protomers with several side chain-specific hydrogen bond interactions, the HLH domain constitutes a core part of the homodimeric protein/protein interface in MITF, which is virtually identical in all three MITF structures.
In contrast, the leucine zipper of MITF differs from other bHLHZip proteins characterized to date. Rather than extending from the second HLH helix, in one of the two MITF protomers, this helix (α2a) terminates after the first recognizable heptad repeat of the zipper region, referred to as repeat 0 (residues 243–258) (Figs. 2, 3). Within this heptad, we observed a twofold repeated intermolecular hydrogen bond cluster, established by the side chains of Tyr253 and Gln258 and the main chain carbonyl group of residue 230 from the C terminus of the first DNA-binding helix (Fig. 2). A third 10-turn α helix, α2b, covering the remaining heptad repeats I–V (260–294), follows a marked kink at Arg259–Gln261 (Supplemental Table S4). In contrast, the second MITF protomer consists of one long helix, α2′, with almost 15 turns (residues 243–294). Within the region of the kink, the established pattern of regular leucine zipper interactions is missing, inducing a hole with a volume of ∼300 Å3. The hole is filled with total of seven ordered solvent molecules (Fig. 2; Supplemental Fig. S3). In the two MITF/DNA complexes, the limit of the visible part of the leucine zipper is within the kink area observed in the apo MITF structures, thus not allowing further structural interpretation of the mechanism described to compensate for the out-of-register sequence found in MITF. Therefore, based on the available structural data, we cannot rule out that there may be alternative structural mechanisms, unobserved to date.
Figure 2.

Molecular basis of the out-of-register leucine zipper assembly in MITF. The structural data presented here were obtained from the apo structure. (Left) MITF zipper segments, highlighting specific leucine zipper interactions (for further details, see Supplemental Fig. S4). (Right) Zoom into the interrupted zipper region in which the zipper helix of one of the two MITF protomers is kinked (helices α2a and α2b), whereas the helix of the second protomer is uninterrupted (α2′). The hydrogen bond network below the helix zipper break is indicated and is structurally conserved in all three MITF structures. Because of the asymmetric arrangement within the kink region, a hole is generated in the dimeric MITF interface, indicated by an arrow. Color codes are as in Figure 1. For reasons of clarity, we used the one-letter code to label specific residues in this and subsequent figures, whereas throughout the text the three-letter code has been used, except for mutations.
Figure 3.

Multiple sequence alignment of MITF, members of the TFE family (top part), and canonical bHLHZip transcription factors (bottom part). MITF structural segments, secondary structural elements, and residue numbers are indicated above the alignment. Heptad repeats I–IV, separated from the first heptad 0 by the three-residue insertion EQQ (highlighted in orange), are indicated below the alignment. This insert, labeled as “INS,” is missing in the sequences of the canonical bHLHZip transcription factors. Residues that are invariant and conserved among all sequences shown are marked with asterisks and colons, respectively. Conserved residues involved in base-specific DNA interactions are light blue, MITF Ile212 and equivalent position in other sequences are dark gray when conserved as isoleucine and are otherwise gray, heptad positions d that are conserved as leucines are pink, and the remaining d positions are in light red. The level of sequence conservation is indicated in the line “Cons.”: conserved (:) and invariant (*). Mitf mouse phenotype and human disease mutations are boxed (cf. Supplemental Fig. S2). MITF residues experimentally investigated are indicated with hash symbols.
As in other bHLHZip transcription factors, we found several specific hydrogen bonds in the heptads following the kink region that connect the two MITF protomers in the leucine zipper (Fig. 2; Supplemental Fig. S4). One of the most prominent interactions is between the symmetric-related side chains of Asn278 from the two MITF protomers in position a from heptad III. Interestingly, an isosteric mutation of this asparagine into an aspartate has been observed in WS2A patients, pointing to a failure in specific leucine zipper interactions and hence defects in cognate DNA binding as an underlying cause of WS2A (Tassabehji et al. 1995). To verify these assumptions, we created the same MITF mutation N278D. In contrast to the wild-type protein, the mutant could not be expressed as soluble protein (Supplemental Fig. S5A). In addition, MITF (N278D) showed largely impaired binding to DNA (Supplemental Fig. S5B), in agreement with our structural observations.
An unusual out-of-register leucine zipper restricts MITF assembly partners
Sequence alignment of canonical bHLHZip transcription factors comprising an uninterrupted HLH-leucine zipper segment such as MYC, MAX, and MAD reveals that heptad repeats I–IV are out of register by three residues compared with MITF and other TFE family members (Fig. 3). Hence, it is not surprising that specific interactions within heptad repeat 0 are conserved in MITF and other bHLHZip transcription factors, but further specific interactions found in MITF heptad repeats I–IV are only matched in other TFE family members.
To test the role of this insert in MITF assembly, we created two MITF constructs in which we deleted three residues separating heptad 0 from the remaining zipper heptad repeats: MITF (Δ260–262) and MITF (Δ263–265). These MITF mutants are expected to have the leucine zipper in the same register as canonical bHLHZip transcription factors (Fig. 3, bottom panel). We used EMSA to investigate whether these MITF mutants were able to assemble with MAX. Both mutant proteins formed MITF/MAX heterodimers when bound to the E-box, whereas no heterodimeric assembly was detected between wild-type MITF and MAX (Fig. 4A). Furthermore, as no heterodimerization was observed when the three insert residues were mutated to alanine (MITF [E260A, Q261A, and Q262A]), we conclude that the three-residue shift of the leucine zipper in wild-type MITF is crucial for limiting its ability for heterodimerization with bHLHZip transcription factors of the TFE family. We also tested the DNA-binding preferences of MITF (Δ260–262)/MAX and MITF (Δ263–265)/MAX heterodimers, which indicated that both bind only to the E-box but not the M-box motif (Fig. 4A). This finding is in agreement with data showing that MYC/MAX heterodimers and MAX homodimers have reduced binding to DNA cognate sequences with a flanking thymidine in the −4 position, which is a signature of the M-box motif (Bendall and Molloy 1994).
Figure 4.

The three-residue insert sequence in MITF determines the dimerization specificity of MITF. (A) EMSAs showing the binding of MAX, MYC, MITF wild-type (wt), and MITF mutant proteins to the E-box and M-box sequences. Homodimers and heterodimers are indicated. MITF mutants used to test homo/heterodimerization were MITF Δ263–265, removing three residues separating heptad 0 from the HLH domain; and MITF Δ260–262, removing three residues of heptad 1 from the leucine zipper. Supershifts with MITF- and MAX-specific antibodies are indicated, confirming the specificity of the gel shifts. (B) Western blot showing equal loading of the MITF (top panel) and MAX (bottom panel) proteins; in the bottom panel, the low faint bands represent MAX, whereas the top bands are nonspecific.
Distinct DNA interactions allow both E-box and M-box recognition by MITF
Our two MITF structures in complex with E-box and M-box DNA elements reveal how single-base changes in the cognate DNA motif lead to significant changes in specific protein–DNA interactions (Fig. 5). For binding to the palindromic E-box complex, the key base-specific interactions mediated by His209, Glu213, and Arg217 largely resemble those found in other bHLHZip transcription factor/DNA structures (Jones 2004). Arg217 is the only residue that provides base-specific and symmetric interactions with the two central base pairs at positions −1 and +1. Interestingly, His209 from both protomers binds to bases from the same strand in the −4 and +3 positions of the E-box motif. The remaining interactions with the DNA phosphate backbone are less conserved in both MITF protomers.
Figure 5.

MITF/DNA interactions with the M-box (top panel) and E-box (bottom panel) motifs. (Left) Schematic presentation, highlighting base-specific interactions in bold and remaining hydrogen bond interactions in regular characters. Hydrogen bonds are indicated with dashed arrows. (Right) Zoom into specific protein/DNA interactions for each M-box/E-box half-site, corresponding to respective boxes in the schematic presentation in the panels to the left. To indicate the relations, each of the panels are connected by arrows and are labeled I and II. The residues that are involved in specific hydrogen bonds are labeled. T-4 and vis-à-vis Ile212 from the protomer of the MITF/M-box complex are colored in yellow. Only those hydrogen bonds recognized by the Pymol software (Schrödinger) and with distances of <3.5 Å are indicated. For the sake of clarity, protein hydrogen bonds with the phosphate backbone of M-box/E-box motifs are not shown in the panels to the right.
In the MITF/M-box complex, Glu213 interacts virtually in the same way as with the E-box motif. In contrast, Arg217 is not involved in regular NH–O hydrogen bonds with any bases of the E-box motif. Unlike our observations from the MITF/E-box complex, each His209 residue from the two MITF protomers simultaneously interacts with bases from positions −4/+3, as the imidazole ring of this residue symmetrically points into the bottom of the M-box major groove, becoming almost equidistant to both DNA strands. Strikingly, the structural role of Ile212 is distinct in the two MITF/DNA complexes: In the MITF/E-box complex, Ile212 only loosely interacts with the DNA backbone, whereas in the M-box complex, its side chain directly faces the thymidine base from the −4 position in the M-box motif.
MITF residues His209 and Ile212 are key determinants for specific E-box/M-box recognition
To unravel the molecular parameters of the observed MITF E-box/M-box specificity, we selected His209 and Ile212 for further investigation, as both residues are crucially involved in specific E-box/M-box interactions (Fig. 5; Supplemental Fig. S2). Importantly, when these residues are mutated in mice, the phenotype is severely affected, resulting in coat color dilution in heterozygotes and microphthalmia and complete absence of melanocytes in homozygotes (Supplemental Table S3; Steingrimsson et al. 2004). In ITC measurements, the binding affinity of the MITF mutants H209R and I212N for the specific DNA elements was significantly diminished, and this was more pronounced for the M-box motif (∼2.5-fold reduction) than for the E-box motif (1.5-fold decrease for I212N, 2.5-fold decrease for H209R). We also analyzed the MITF− splice variant, which showed slightly decreased binding of wild-type MITF− to both M-boxes and E-boxes but no significant added effect for the MITF− (I212N) mutant (Table 1).
Notably, for both H209R and I212N MITF mutants, we measured considerably increased binding to nonspecific DNA, which was more pronounced for H209R (eightfold increase) than for I212N (threefold increase) when compared with wild-type MITF. As a result, the binding selectivity of MITF to the M-box motif was reduced from >200-fold for wild-type MITF to ∼10-fold for H209R and 24-fold for the I212N mutant (Fig. 6A). The effect was, however, significantly smaller for the E-box motif: 15-fold for H209R and 60-fold for I212N.
Figure 6.

Residue Ile212 is crucial for binding of MITF to the M-box. (A) Ratio of binding dissociation constants of different MITF variants to nonspecific DNA/M-box (orange) and nonspecific DNA/E-box (yellow) based on quantitative ITC experiments (Table 1). Error bars correspond to standard deviations, taking into account error propagation, as described in the Materials and Methods. (B) EMSAs showing altered M-box and E-box DNA binding of mutant MITF homodimer variants, as indicated. Supershifts with a MITF-specific antibody are indicated, confirming the specificity of the gel shifts. Western blots show equal loading of the respective proteins. (C) TA assays in HEK293T cells in which the same MITF mutants as in B were cotransfected together with TYR promoters containing either two M-boxes (orange) or E-boxes (yellow) as reporter. Data are represented as the standard error of the mean (SEM); (*) P < 0.05 based on an unpaired two-sided t-test. Western blots show levels of wild-type (wt) and mutant MITF proteins. (D) HEK293T cells transiently transfected with either MITF or MITF I212N were assayed for TYR, MLANA, and DCT expression (as control) by qPCR using the same error analysis as in C. Western blots show levels of wild-type and mutant MITF proteins. As the expression level of the MITF I212N mutant does not completely reach that of the wild-type protein, we consider the level of estimated amplification of expression for TYR and MLANA as the upper limit.
These changes in the specific DNA-binding profile of M-box versus E-box motifs as well as the substantial increase in nonspecific DNA binding observed were supported by EMSA experiments, which were carried out in the presence of defined levels of potential competitor DNA (Fig. 6B). Binding of the I212N mutant to the M-box was substantially impaired, whereas binding to the E-box remained virtually unchanged. Thus, the structure of MITF and the results of the EMSA and ITC experiments indicate that Ile212 plays a specific role in the binding of MITF to the M-box.
In contrast, as His209 is intimately involved in interactions with both the M-box and the E-box (Fig. 5), it is not surprising that the H209R mutation has a strong effect on both DNA sequence motifs. In EMSAs, the H209R mutant showed reduced binding to both the M-box and the E-box, which is, however, less pronounced for the latter.
In the absence of competitor DNA, as defined by the experimental conditions of the ITC measurements, the decrease in M-box and E-box binding by both mutations, I212N and H209R, was generally less pronounced. Therefore, we argue that some of the effects that we observed in the EMSA experiments are caused by tipping the balance from specific to nonspecific DNA recognition.
Ile212 is crucial for target gene specificity
More distantly related bHLHZip transcription factors—such as MYC, MAX, and MAD—preferably bind to the symmetric E-box sequence and show only residual binding to the asymmetric M-box motif (Bendall and Molloy 1994; Chen et al. 2008). Structures of these transcription factors have consistently shown that the residue that is equivalent to Ile212 of MITF is not involved in DNA recognition (Ferre-D'Amare et al. 1993; Brownlie et al. 1997; Nair and Burley 2003), explaining why amino acid exchanges at this position do not have a significant impact on DNA binding. In contrast, the basic domain sequences of all TFE proteins are virtually identical to that of MITF, and, specifically, the position equivalent to Ile212 in MITF is invariant (Fig. 3), suggesting that the role of Ile212 is conserved in other members of the TFE family.
To test the involvement of this residue in the DNA-binding specificity of MITF to the M-box, we mutated Ile212 of the MITF+ protein into those amino acids present in the equivalent position in distantly related bHLHZip proteins. In EMSA experiments, all mutant MITF+ proteins, including I212L (present in MYC and MAX), I212M (present in MAD), and I212V (present in USF1), showed binding to the E-box similar to the wild-type MITF+ protein (Fig. 6B). However, MITF+ proteins carrying the I212L and I212M mutations showed severely reduced binding to the M-box (Fig. 6B), whereas the MITF protein carrying the I212V mutation resulted in binding to the M-box similar to wild-type MITF. This observation is consistent with previous evidence showing that USF1 binds to the M-box motif as well (Corre et al. 2004). When bound to the M-box, valine in this residue position is expected to form interactions with the M-box flanking T-4 position comparable with wild-type MITF due to the structurally conserved β-branched side chain. In contrast, the side chains of leucine and methionine are expected to lead to steric clashes because of their increased size. The EMSA data are in agreement with quantitative ITC measurements, which showed a significant diminishment in binding affinity for the M-box element for two MITF mutants (I212L, 2.5-fold reduction; I212M, 3.5-fold reduction) compared with wild-type MITF, whereas the MITF (I212V) mutant did not show any significant reduction (Table 1). The measured affinity changes are less pronounced for the E-box element, thus confirming the importance of the M-box-specific interactions by Ile212. As predicted, none of these mutants, in contrast to I212N and H209R, shows increased binding affinity to random DNA, as no polar groups for additional nonspecific hydrogen bond interactions with the DNA phosphate backbone are offered.
Based on our structural data, we predicted that the target gene specificity of Ile212 mutant MITF proteins would depend on the presence of E-box or M-box sequences in the promoter. To test this, we performed a transactivation (TA) assay using a modified tyrosinase promoter containing two M-box or E-box sequences and luciferase as a reporter (Fig. 6C). These constructs were transiently transfected into human embryonic kidney (HEK293T) cells together with constructs expressing wild-type MITF+ or I212N, I212V, I212L, I212M, H209R, and R217del mutant proteins. All mutant proteins except I212V resulted in almost complete loss in activation from the M-box-containing tyrosinase promoter (Fig. 6C). A more subtle decrease was observed with the E-box-containing tyrosinase promoter, from which the I212N, I212V, I212L, and I212M mutant proteins showed significant TA, although all but I212V were reduced in comparison with wild-type protein. Taking the data together, this effect is consistent with the ITC and EMSA results (Fig. 6B; Table 1).
Furthermore, we used HEK293T cells to test whether the expression of target genes under the control of M-box-type promoters was altered with the I212N mutation. Quantitative PCR (qPCR) data from cells transiently transfected with mutant I212N or wild-type MITF+ indeed showed an almost complete loss of expression of TYR and MLANA, two well-established MITF target genes involved in melanocyte differentiation (Cheli et al. 2009), with the mutant protein (Fig. 6D). Neither wild-type MITF nor MITF (I212N) was able to activate DCT expression in these cells, in accordance with previous reports (Jiao et al. 2004). We conclude that Ile212 is crucial for DNA-binding specificity and subsequently for MITF target gene selection of M-box-type promoters.
Discussion
The structure of MITF reveals how its dimeric assembly is mediated through a leucine zipper that contains a marked kink in one of the two protomers. Such an out-of-register sequence is without precedence in leucine zipper-mediated transcription factor assemblies. In other functionally unrelated zipper-mediated proteins with coiled-coil assemblies, such breaks in leucine zippers are rare (Peters et al. 1996; Lupas and Gruber 2005), suggesting that the peculiar zipper arrangement in MITF is driven by specific functional requirements. Our data indeed explain the selective heterodimerization observed between MITF and the TFE transcription factor family members, as they contain the same three-residue insert in the N-terminal part of the leucine zipper (Fig. 3).
Comparison of the two MITF structures in the presence of the M-box and E-box motifs reveals how the presence of an isoleucine in position 212 allows and even favors binding of the M-box motif by a specific interaction with the thymidine base in position −4 (Fig. 5). This finding is in agreement with an analysis of the promoter elements of validated target genes (Supplemental Table S5; Cheli et al. 2009) and is further supported by our analysis of recent chromatin immunoprecipitation (ChIP) combined with deep sequencing (ChIP-seq) data from melanoma cells (Supplemental Table S6; Strub et al. 2011). Both analyses consistently reveal considerable base preferences for M-box positions −4 and +4. The observation that the presence of all other bases at these two positions is permissible is in agreement with our structural data, indicating that thymidine and adenine in the −4/+4 positions lead to gain of binding via additional specific interactions as opposed to potential loss of binding by replacement with other bases; e.g., by steric clashes.
Furthermore, our ITC data, supported by EMSAs, show that both splice versions, MITF+/MITF−, of the I212N mutant protein bind to the E-boxes and M-boxes with high affinity (Supplemental Fig. S6A; Table 1). Thus, our findings are in agreement with a study in mouse mast cells showing that MITF (I212N) is capable of binding to the E-box motif like the wild-type protein (Kim et al. 1999). However, our data are not consistent with the original characterization of the I212N mutant, which suggested that the alternative splice versions MITF+/MITF− and the I212N mutation had a coupled effect on the functional properties of MITF (Hemesath et al. 1994). For further details, see Supplemental Figure S6.
Mice carrying the MitfMi-Wh (I212N) mutation are unique in two respects. First, the mutation shows differential severity in homozygous versus heterozygous conditions. Although MitfMi-Wh homozygous mice are entirely devoid of pigment, they show intermediate microphthalmia as opposed to the severe microphthalmia seen in loss-of-function Mitf mutations (Supplemental Fig. S7; Steingrimsson 2010). However, in heterozygous condition, MitfMi-Wh mice show the most severe phenotype of all known Mitf mutations: dilute coat color and a large belly spot (Supplemental Fig. S7). Second, MitfMi-Wh is the only mutation at Mitf to exhibit interallelic complementation. For example, when crossed with the loss-of-function Mitfmi-vga9 mutation, which exhibits severe microphthalmia in homozygous condition, the resulting compound heterozygotes (Mitfmi-vga9/MitfMi-Wh) have normal eye size (Supplemental Fig. S7). Thus, reducing the MITFMi-Wh (I212N) dose by half improves eye development. A systematic analysis has shown that other mutations at Mitf are also complemented when combined with MitfMi-Wh (Steingrimsson et al. 2003).
The genetic data have been interpreted in terms of the acquisition of a neomorphic function that results in severe effects in heterozygous mice (Steingrimsson 2010). Among several molecular mechanisms proposed for such gain of function of MITF (I212N), our data do not support the idea that this is due to effects on dimerization properties of the protein, as Ile212 is well separated from the leucine zipper dimerization interface, and in our assays, the MITF (I212N) mutant proteins form both homodimers and heterodimers (Supplemental Fig. S6). Similarly, our data do not provide evidence for binding to novel dimerization partners. However, our findings do support a third mechanism suggested, which is erroneous binding to nonspecific, untargeted DNA motifs (Steingrimsson 2010). Our structures of the two MITF/DNA complexes reveal that in the I212N mutant, the functional asparagine amido group could reach potential hydrogen bond distances with at least two phosphate groups at positions −4 and −5 from both the M-box and E-box motifs (Supplemental Fig. S8). This would in turn shift the balance from specific M-box/E-box motifs toward an enhanced nonspecific DNA-binding profile, in agreement with our ITC, EMSA, and TA data. According to this model, the interallelic complementation observed with MitfMi-Wh (I212N) is due to a reduction in the deleterious effects of nonspecific DNA binding when heterozygous with a loss-of-function mutation. Similarly, this model explains the severe phenotype observed in MitfMi-Wh (I212N) heterozygotes.
Replacement of His209 by an arginine would, like the I212N mutation, allow an additional sequence-independent interaction with position +3 (Supplemental Fig. S8). As the side chain of an arginine is too bulky to preserve the bidentate base-specific interactions observed for His209 in the presence of the M-box motif (Fig. 5), the bases of positions +2, +3, and +4 from the first strand and positions −4 and −5 from the second strand would potentially be in reach for additional hydrogen bonds. Taken together, our experimental data and structural predictions are in line with recent findings from various transcriptomics analyses showing that a proper balance of binding of transcription factors to specific cognate response elements and a low level of binding to nonspecific, untargeted DNA motifs is absolutely critical for their proper functional readout (Pan et al. 2010).
A key future challenge will be to expand our mechanistically based insight of the specific DNA-binding profile of MITF into an integrated view of the complete protein and its ligands. Such studies should reveal currently unknown cross-talks and potential functional cooperativity of the different parts of the protein and will ultimately be needed to systematically target MITF for therapeutic interventions.
Material and methods
MITF purification and crystallization
Three fragments from the Mus musculus Mitf cDNA (corresponding to residues 180–296 with and without the six amino acids corresponding to the splicing variant MITF− lacking residues 187–192, and another corresponding to residues 217–296) were cloned in the pET-M11 vector and expressed in the Escherichia coli strain BL21 (DE3) RIL. Cell pellets with overexpressed MITF were lysed under denaturing conditions in 4 M urea, 20 mM Tris-HCl (pH 7.5), 500 mM NaCl, and 15 mM β-mercaptoethanol. The proteins were purified on a Ni-NTA affinity column (Qiagen). The proteins were refolded upon dialysis against a buffer containing 150 mM NaCl, 15 mM Tris (pH 7.5), and 10 mM DTT in the presence or absence of synthetic cognate DNA M-box or E-box elements (Metabion) and tobacco etch virus (TEV) protease in a mass ratio of 1:25 to remove the hexa-histidine tag. The MITF apo protein and the MITF/DNA complexes were further purified by exclusion chromatography on a Superdex 75 column, equilibrated with the same buffer. MITF (217–296) was also expressed as native protein in the absence of urea. A comparative circular dichroism (CD) analysis (Supplemental Fig. S9) showed that folding of this MITF construct is not impaired by the purification method.
The MITF (217–296) protein was also expressed in the presence of selenomethionine in the methionine auxothroph strain B834 (DE3). The protein and complexes with DNA were concentrated to 10 mg/mL using a Vivaspin concentrator with a membrane with a 10-kDa molecular weight cutoff (Sartorius Stedim Biotech). Hanging-drop crystallization trials were carried out at 20°C by mixing equal volumes of reservoir solution and complex solution. Crystals of protein/DNA complexes grew from 0.7 M sodium citrate (pH 4.75), and crystals of the apo protein grew in 1.5 M ammonium sulfate and 150 mM sodium acetate (pH 5.0).
X-ray structure determination
All crystals used for X-ray data collection were soaked in cryo-solutions containing the crystallization mother liquor supplemented with 30% (v/v) ethylene glycol or 25% (v/v) glycerol, mounted onto a cryoloop (Hampton Research), and flash-cooled under the nitrogen beam at 100 K or in liquid nitrogen. X-ray data were collected on the synchrotron radiation beamline BW7A at the DORIS III ring at EMBL/DESY and ID14-4 at ESRF. Diffraction data were processed using MOSFLM (Leslie and Powell 2007) and scaled with SCALA from the CCP4 suite (Collaborative Computational Project Number 4 1994). The MITF apo structure was solved using the single anomalous scattering protocol of the Auto-Rickshaw software platform (Panjikar et al. 2005). Estimates of the heavy-atom structure factors, heavy-atom search, substructure, and initial phases were calculated using the program SHELXC, SHELXD, and SHELXE (Sheldrick 2010). The initial phases were improved using density modification and phase extension to 2.0 Å resolution using the program Resolve (Terwilliger 2000). The structures of the protein/DNA complexes were solved by molecular replacement using the program Phaser (Storoni et al. 2004) and refined with the Phenix suite (Adams et al. 2010) and RefMac5 (Murshudov et al. 1997). The final model was built with COOT (Emsley and Cowtan 2004). The stereochemical quality of the structures was assessed with ProCheck (Laskowski et al. 1993). The DNA curvature was determined with Curves (Lavery et al. 2009). The hole observed within the MITF leucine zipper was characterized with the software Mole 2.0 (Berka et al. 2004), and an OMIT map of the surrounding area was built with SFCheck (Vaguine et al. 1999).The complete X-ray structure determination statistics are listed in Supplemental Table S2.
The atomic coordinates and structure factors of MITF (apo), the MITF/M-box complex, and MITF/E-box complex have been deposited at the Protein Data Bank under the respective identification codes 4ATH, 4ATI, and 4ATK.
Quantitative determination of protein/DNA-binding affinities
ITC experiments were carried out with a VP-ITC system (MicroCal). Experiments were performed at 25°C in 10 mM Tris (pH 7.5), 200 mM NaCl, and 0.01% thioglycerol. Purified MITF (180–296) protein was placed in the reaction cell at a concentration of 5–20 μM with each DNA oligonucleotide duplex (Metabion) and fragmented herring sperm DNA (Sigma) at a concentration of 25–100 μM in the injection syringe. Injections of 10 μL of DNA solution were performed at 4-min intervals. Data were processed with the Origin 7 software (MicroCal). The data were corrected by the heat of injection calculated from the basal heat remaining after saturation. A one-site binding mode was used to fit the data using a nonlinear least squares algorithm. For representative thermograms and resulting data, see Supplemental Figure S1 and Supplemental Table S1. The relevant key data are summarized in Table 1. The values reported are the means of three independent measurements, and the ±error numbers represent the standard deviations (σ). We calculated the ratio (Z) of binding dissociation constants (KD) of MITF to nonspecific DNA (X)/specific DNA (Y). In Figure 6A, error bars correspond to standard deviations (σZ), taking into account standard deviations of both KD for nonspecific (σX) and specific (σY) DNA, and were calculated as follows in order to take error propagation into account:
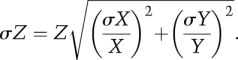 |
CD spectropolarimetry measurements
MITF (216–296) was purified in the absence and presence of urea, as described above. Prior to each measurement, samples were dialyzed against 10 mM potassium phosphate (pH 7.5) and diluted to 0.1 mg × mL−1. Spectra were recorded at 10°C on a Chirascan CD Spectrometer (Applied Photophysics), between 185 and 260 nm in a 0.1-cm cuvette. Machine settings were as follows: 0.5-nm bandwidth, 0.5-sec response, and 0.5-nm data pitch. Spectra were background-subtracted and converted to mean residue ellipticity. Each curve represents the mean of three separate measurements.
Generation of plasmid constructs
Full-length wild-type and mutant MITF expression clones were generated in pcDNA3.1 by subcloning and/or using the QuikChange kit (Stratagene). For expressing truncated MITF+/− (residues 108–309), PCR was used to amplify the corresponding region from cDNAs using primers containing T7 sequences (primers listed below), and the resulting fragments were added to the TNT system (Promega) to produce the respective proteins. pcDNA3-Tfe3 (residues 247–572) was kindly provided by R. Ballotti (INSERM, Nice, France) (Verastegui et al. 2000). This construct was used as a template for a PCR-derived short Tfe3 fragment (primers listed below), which was subcloned into pcDNA3.1 using NotI and XhoI. pVZ-Max was kindly provided by R. Eisenman (Fred Hutchinson Cancer Research Center, Seattle, WA) (Blackwood and Eisenman 1991) and was subcloned into pcDNA3.1 using BamHI and NotI. pcDNA3.1-Flag-MYC was obtained from Fermentas. All vector constructs were sequence-verified.
Oligonucleotides
To express MITF (residues 108–309), we used primers MITF-F1 (Supplemental Table S7) and MITF-R1. For generating a short version of the TFE3 protein (residues 303–475), we used primers TFE3-F1 and TFE3-R1. For EMSAs, the primers M-box-F, M-box-F(2), and E-box-F and their reverse complementary strands were synthesized with a guanine overhang on the 5′ end, annealed, 32P-labeled, and purified.
EMSAs
EMSAs were performed using proteins expressed in the TNT-T7 coupled reticulocyte lysate system (Promega). Proteins were cotranslated when testing for heterodimerization. Probes (sequences listed above) spanning the E-box or M-box were end-labeled with α-[32P]dCTP (PerkinElmer). Two microliters of TNT translated proteins were preincubated in buffer containing 20 ng of poly(dI–dC), 10% fetal calf serum, 2 mM MgCl2, and 2 mM spermidine for 15 min on ice. For supershift assays, 0.5 μg of anti-MITF (C5, MS-771, NeoMarkers) or anti-MAX (C-17, Santa Cruz Biotechnology) antibodies was added and incubated on ice for 30–60 min. Then, 50,000 counts per minute (cpm) of 32P-labeled probe in a binding buffer containing 10 mM Tris (pH 7.5), 100 mM NaCl, 2 mM dithiothreitol, 1 mM EDTA, 4% glycerol, and 80 ng/mL salmon sperm DNA were added to a total reaction volume of 20 μL and incubated for 10 min at room temperature. The resulting DNA–protein complexes were resolved on 4.2% nondenaturing polyacrylamide gels, placed on a storage phosphor screen, and then scanned on a Typhoon PhosphorImager 8610 (Molecular Dynamics). When testing for MAX binding, TNT translated proteins were incubated in buffer containing 20 mM Tris-HCl (pH 8), 100 mM KCl, 1 mM EDTA, 1 mM dithiothreitol, 5% glycerol, 100 ng of poly dI–dC, and 2 μg of BSA for 30 min on ice prior to addition of 32P-labeled probe. All EMSAs were performed in triplicates.
Western blot
Two microliters of in vitro translated proteins (15 μL of proteins isolated from HEK293T cells) were analyzed on 8% SDS–polyacrylamide gels and then electro-transferred to nitrocellulose (Odyssey) membranes. Membranes were incubated with antibodies against MITF (C5, MS-771, NeoMarkers) or MAX (C-17, Santa Cruz Biotechnology) and then with secondary antibodies conjugated to IRDye-680 or 800 (Metabion). The blotted proteins were detected and quantified using the Odyssey infrared imaging system. Equivalent protein quantities were added to gel shift assays.
Transfection
HEK293T cells were grown in DMEM medium (GIBCO-BRL) with 10% fetal bovine serum and 2 mM glutamine (Gibco) at 37°C with 5% CO2. For gene expression analysis, HEK293T cells were grown for 24 h prior to transfection with pcDNA3.1-Mitf, pcDNA3.1-MitfWh, or empty vector using Lipofectamine 2000 in Optimem I (Invitrogen). Untreated cells were used as a control. Transfections were performed in triplicate. The cultures were incubated for 48 h before RNA isolation. Luciferase experiments were prepared by culturing 25,000 HEK293T cells per well in 48-well plates (Nunc) for 24 h prior to transfection (TurboFect, Fermentas) with the following amounts of DNA: 12 ng of MITF, 100 ng of luciferase-coupled promoter, and 0.36 ng of pRL Renilla luciferase control reporter vectors. After 24 h, cells were harvested for luciferase assays using the Dual-Luciferase Reporter Assay System (Promega). Promoter activity was measured in a microplate multimode reader (Modulus II, Turner BioSystems) with a 1-sec reading per well.
RNA extraction and cDNA synthesis
Total RNA and protein were extracted from HEK293T cells using TRIzol reagent (Invitrogen) (Chomczynski and Sacchi 1987). RNA quantity was measured using a NanoDrop Spectrophotometer ND-1000, and RNA integrity was determined using an Agilent 2100 Bioanalyzer. RNA was purified with the RNEasy Minelute kit (Qiagen). Purified RNA (2 μg in a 20-μL reaction) was used for cDNA synthesis with a High-Capacity cDNA reverse transcription kit (Applied Biosystems) and anchored Oligo(dT)20 primer (Invitrogen).
Real-time qPCR
Gene expression was measured by qPCR using human TaqMan gene expression assays (Applied Biosystems) Hs01098278_m1 (dopachrome tautomerase), Hs00165976_m1 (tyrosinase), Hs00194133_m1 (Mlana), and Hs02758991_m1 (Gapdh). Each cDNA sample was measured in triplicate. Two controls were included: one without reverse transcriptase and the other without template.
Acknowledgments
We thank Sven Schrödl for technical assistance, Simon Holton for computational advice, and Colin Goding for comments on the manuscript. We acknowledge the European Synchrotron Radiation Facility for provision of synchrotron radiation facilities and thank local contacts for assistance in using the beamline ID14-4. We thank the SPC facility at EMBL, Hamburg, for technical support. This work was supported by European Commission via SPINE2 (Structural Proteomics in Europe 2), contract number LSHG-CT-2006-031220 (M.W.) and by grants from the Icelandic Research Fund and the Research Fund of the University of Iceland (to E.S.). V.P. and M.H.O. coordinated the experimental work and contributed to writing the manuscript. V.P., V.D., and M.M. performed all protein purification, structural biology, and ITC experiments. M.H.O., K.B., A.S., and B.P. carried out all EMSA, TA, and qPCR experiments. E.S. and M.W. wrote the manuscript and coordinated the project.
Footnotes
Supplemental material is available for this article.
Article is online at http://www.genesdev.org/cgi/doi/10.1101/gad.198192.112.
References
- Adams PD, Afonine PV, Bunkoczi G, Chen VB, Davis IW, Echols N, Headd JJ, Hung LW, Kapral GJ, Grosse-Kunstleve RW, et al. 2010. PHENIX: A comprehensive Python-based system for macromolecular structure solution. Acta Crystallogr D Biol Crystallogr 66: 213–221 [DOI] [PMC free article] [PubMed] [Google Scholar]
- Aksan I, Goding CR 1998. Targeting the microphthalmia basic helix–loop–helix–leucine zipper transcription factor to a subset of E-box elements in vitro and in vivo. Mol Cell Biol 18: 6930–6938 [DOI] [PMC free article] [PubMed] [Google Scholar]
- Bendall AJ, Molloy PL 1994. Base preferences for DNA binding by the bHLH-Zip protein USF: Effects of MgCl2 on specificity and comparison with binding of Myc family members. Nucleic Acids Res 22: 2801–2810 [DOI] [PMC free article] [PubMed] [Google Scholar]
- Berka K, Hanak O, Sehnal D, Banas P, Navratilova V, Jaiswal D, Ionescu CM, Svobodova Varekova R, Koca J, Otyepka M 2004. MOLEonline 2.0: Interactive Web-based analysis of biomacromolecular channels. Nucleic Acids Res 40: W222–W227 doi: 10.1093/nar/gks363 [DOI] [PMC free article] [PubMed] [Google Scholar]
- Bertolotto C, Lesueur F, Giuliano S, Strub T, de Lichy M, Bille K, Dessen P, d'Hayer B, Mohamdi H, Remenieras A, et al. 2011. A SUMOylation-defective MITF germline mutation predisposes to melanoma and renal carcinoma. Nature 480: 94–98 [DOI] [PubMed] [Google Scholar]
- Blackwood EM, Eisenman RN 1991. Max: A helix–loop–helix zipper protein that forms a sequence-specific DNA-binding complex with Myc. Science 251: 1211–1217 [DOI] [PubMed] [Google Scholar]
- Brownlie P, Ceska T, Lamers M, Romier C, Stier G, Teo H, Suck D 1997. The crystal structure of an intact human Max–DNA complex: New insights into mechanisms of transcriptional control. Structure 5: 509–520 [DOI] [PubMed] [Google Scholar]
- Carreira S, Goodall J, Denat L, Rodriguez M, Nuciforo P, Hoek KS, Testori A, Larue L, Goding CR 2006. Mitf regulation of Dia1 controls melanoma proliferation and invasiveness. Genes Dev 20: 3426–3439 [DOI] [PMC free article] [PubMed] [Google Scholar]
- Cheli Y, Ohanna M, Ballotti R, Bertolotto C 2009. Fifteen-year quest for microphthalmia-associated transcription factor target genes. Pigment Cell Melanoma Res 23: 27–40 [DOI] [PubMed] [Google Scholar]
- Chen X, Xu H, Yuan P, Fang F, Huss M, Vega VB, Wong E, Orlov YL, Zhang W, Jiang J, et al. 2008. Integration of external signaling pathways with the core transcriptional network in embryonic stem cells. Cell 133: 1106–1117 [DOI] [PubMed] [Google Scholar]
- Chomczynski P, Sacchi N 1987. Single-step method of RNA isolation by acid guanidinium thiocyanate–phenol–chloroform extraction. Anal Biochem 162: 156–159 [DOI] [PubMed] [Google Scholar]
- Collaborative Computational Project Number 4 1994. The CCP4 suite: Programs for protein crystallography. Acta Crystallogr D Biol Crystallogr 50: 760–763 [DOI] [PubMed] [Google Scholar]
- Corre S, Primot A, Sviderskaya E, Bennett DC, Vaulont S, Goding CR, Galibert MD 2004. UV-induced expression of key component of the tanning process, the POMC and MC1R genes, is dependent on the p-38-activated upstream stimulating factor-1 (USF-1). J Biol Chem 279: 51226–51233 [DOI] [PubMed] [Google Scholar]
- Emsley P, Cowtan K 2004. Coot: Model-building tools for molecular graphics. Acta Crystallogr D Biol Crystallogr 60: 2126–2132 [DOI] [PubMed] [Google Scholar]
- Ferre-D'Amare AR, Prendergast GC, Ziff EB, Burley SK 1993. Recognition by Max of its cognate DNA through a dimeric b/HLH/Z domain. Nature 363: 38–45 [DOI] [PubMed] [Google Scholar]
- Garraway LA, Widlund HR, Rubin MA, Getz G, Berger AJ, Ramaswamy S, Beroukhim R, Milner DA, Granter SR, Du J, et al. 2005. Integrative genomic analyses identify MITF as a lineage survival oncogene amplified in malignant melanoma. Nature 436: 117–122 [DOI] [PubMed] [Google Scholar]
- Hemesath TJ, Steingrimsson E, McGill G, Hansen MJ, Vaught J, Hodgkinson CA, Arnheiter H, Copeland NG, Jenkins NA, Fisher DE 1994. Microphthalmia, a critical factor in melanocyte development, defines a discrete transcription factor family. Genes Dev 8: 2770–2780 [DOI] [PubMed] [Google Scholar]
- Jiao Z, Mollaaghababa R, Pavan WJ, Antonellis A, Green ED, Hornyak TJ 2004. Direct interaction of Sox10 with the promoter of murine Dopachrome Tautomerase (Dct) and synergistic activation of Dct expression with Mitf. Pigment Cell Res 17: 352–362 [DOI] [PubMed] [Google Scholar]
- Jones S 2004. An overview of the basic helix–loop–helix proteins. Genome Biol 5: 226 doi: 10.1186/gb-2004-5-6-226 [DOI] [PMC free article] [PubMed] [Google Scholar]
- Kim DK, Morii E, Ogihara H, Lee YM, Jippo T, Adachi S, Maeyama K, Kim HM, Kitamura Y 1999. Different effect of various mutant MITF encoded by mi, Mior, or Miwh allele on phenotype of murine mast cells. Blood 93: 4179–4186 [PubMed] [Google Scholar]
- Laskowski RA, Moss DS, Thornton JM 1993. Main-chain bond lengths and bond angles in protein structures. J Mol Biol 231: 1049–1067 [DOI] [PubMed] [Google Scholar]
- Lavery R, Moakher M, Maddocks JH, Petkeviciute D, Zakrzewska K 2009. Conformational analysis of nucleic acids revisited: Curves+. Nucleic Acids Res 37: 5917–5929 [DOI] [PMC free article] [PubMed] [Google Scholar]
- Leslie AGW, Powell HR 2007. Processing diffraction data with MOSFLM. In Evolving methods for macromolecular crystallography (ed. R Read and JL Sussman), pp. 41–51. Springer, Dordrecht, The Netherlands. [Google Scholar]
- Lupas AN, Gruber M 2005. The structure of α-helical coiled coils. Adv Protein Chem 70: 37–78 [DOI] [PubMed] [Google Scholar]
- Murshudov GN, Vagin AA, Dodson EJ 1997. Refinement of macromolecular structures by the maximum-likelihood method. Acta Crystallogr D Biol Crystallogr 53: 240–255 [DOI] [PubMed] [Google Scholar]
- Nair SK, Burley SK 2003. X-ray structures of Myc-Max and Mad-Max recognizing DNA. Molecular bases of regulation by proto-oncogenic transcription factors. Cell 112: 193–205 [DOI] [PubMed] [Google Scholar]
- Nishimura EK, Granter SR, Fisher DE 2005. Mechanisms of hair graying: Incomplete melanocyte stem cell maintenance in the niche. Science 307: 720–724 [DOI] [PubMed] [Google Scholar]
- Pan Y, Tsai CJ, Ma B, Nussinov R 2010. Mechanisms of transcription factor selectivity. Trends Genet 26: 75–83 [DOI] [PMC free article] [PubMed] [Google Scholar]
- Panjikar S, Parthasarathy V, Lamzin VS, Weiss MS, Tucker PA 2005. Auto-Rickshaw: An automated crystal structure determination platform as an efficient tool for the validation of an X-ray diffraction experiment. Acta Crystallogr D Biol Crystallogr 61: 449–457 [DOI] [PubMed] [Google Scholar]
- Peters JW, Stowell MH, Rees DC 1996. A leucine-rich repeat variant with a novel repetitive protein structural motif. Nat Struct Biol 3: 991–994 [DOI] [PubMed] [Google Scholar]
- Pingault V, Ente D, Dastot-Le Moal F, Goossens M, Marlin S, Bondurand N 2010. Review and update of mutations causing Waardenburg syndrome. Hum Mutat 31: 391–406 [DOI] [PubMed] [Google Scholar]
- Sheldrick GM 2010. Experimental phasing with SHELXC/D/E: Combining chain tracing with density modification. Acta Crystallogr D Biol Crystallogr 66: 479–485 [DOI] [PMC free article] [PubMed] [Google Scholar]
- Steingrimsson E 2010. Interpretation of complex phenotypes: Lessons from the Mitf gene. Pigment Cell Melanoma Res 23: 736–740 [DOI] [PubMed] [Google Scholar]
- Steingrimsson E, Arnheiter H, Hallsson JH, Lamoreux ML, Copeland NG, Jenkins NA 2003. Interallelic complementation at the mouse Mitf locus. Genetics 163: 267–276 [DOI] [PMC free article] [PubMed] [Google Scholar]
- Steingrimsson E, Copeland NG, Jenkins NA 2004. Melanocytes and the microphthalmia transcription factor network. Annu Rev Genet 38: 365–411 [DOI] [PubMed] [Google Scholar]
- Storoni LC, McCoy AJ, Read RJ 2004. Likelihood-enhanced fast rotation functions. Acta Crystallogr D Biol Crystallogr 60: 432–438 [DOI] [PubMed] [Google Scholar]
- Strub T, Giuliano S, Ye T, Bonet C, Keime C, Kobi D, Le Gras S, Cormont M, Ballotti R, Bertolotto C, et al. 2011. Essential role of microphthalmia transcription factor for DNA replication, mitosis and genomic stability in melanoma. Oncogene 30: 2319–2332 [DOI] [PubMed] [Google Scholar]
- Tassabehji M, Newton VE, Liu XZ, Brady A, Donnai D, Krajewska-Walasek M, Murday V, Norman A, Obersztyn E, Reardon W, et al. 1995. The mutational spectrum in Waardenburg syndrome. Hum Mol Genet 4: 2131–2137 [DOI] [PubMed] [Google Scholar]
- Terwilliger TC 2000. Maximum-likelihood density modification. Acta Crystallogr D Biol Crystallogr 56: 965–972 [DOI] [PMC free article] [PubMed] [Google Scholar]
- Vaguine AA, Richelle J, Wodak SJ 1999. SFCHECK: A unified set of procedures for evaluating the quality of macromolecular structure-factor data and their agreement with the atomic model. Acta Crystallogr D Biol Crystallogr 55: 191–205 [DOI] [PubMed] [Google Scholar]
- Verastegui C, Bertolotto C, Bille K, Abbe P, Ortonne JP, Ballotti R 2000. TFE3, a transcription factor homologous to microphthalmia, is a potential transcriptional activator of tyrosinase and TyrpI genes. Mol Endocrinol 14: 449–456 [DOI] [PubMed] [Google Scholar]
- Wellbrock C, Rana S, Paterson H, Pickersgill H, Brummelkamp T, Marais R 2008. Oncogenic BRAF regulates melanoma proliferation through the lineage specific factor MITF. PLoS ONE 3: e2734 doi: 10.1371/journal.pone.0002734 [DOI] [PMC free article] [PubMed] [Google Scholar]
- Yokoyama S, Woods SL, Boyle GM, Aoude LG, Macgregor S, Zismann V, Gartside M, Cust AE, Haq R, Harland M, et al. 2011. A novel recurrent mutation in MITF predisposes to familial and sporadic melanoma. Nature 480: 99–103 [DOI] [PMC free article] [PubMed] [Google Scholar]