

In three-dimensional matrices, tumor cells can move with either an elongated/mesenchymal or a round/amoeboid morphology. This study identifies FilGAP, a Rac GTPase-activating protein (GAP), as a mediator of Rho/Rho-associated protein kinase–dependent amoeboid movement of carcinoma cells. FilGAP may contribute to tumor invasion and metastasis by controlling the amoeboid mode of movement.
Abstract
Tumor cells exhibit two interconvertible modes of cell motility referred to as mesenchymal and amoeboid migration. Mesenchymal mode is characterized by elongated morphology that requires high GTPase Rac activation, whereas amoeboid mode is dependent on actomyosin contractility induced by Rho/Rho-associated protein kinase (ROCK) signaling. While elongated morphology is driven by Rac-induced protrusion at the leading edge, how Rho/ROCK signaling controls amoeboid movement is not well understood. We identified FilGAP, a Rac GTPase-activating protein (GAP), as a mediator of Rho/ROCK-dependent amoeboid movement of carcinoma cells. We show that depletion of endogenous FilGAP in carcinoma cells induced highly elongated mesenchymal morphology. Conversely, forced expression of FilGAP induced a round/amoeboid morphology that requires Rho/ROCK-dependent phosphorylation of FilGAP. Moreover, depletion of FilGAP impaired breast cancer cell invasion through extracellular matrices and reduced tumor cell extravasation in vivo. Thus phosphorylation of FilGAP by ROCK appears to promote amoeboid morphology of carcinoma cells, and FilGAP contributes to tumor invasion.
INTRODUCTION
Malignant tumor cells acquire abnormal cell motility and invade through tissue extracellular matrix (ECM). Individual tumor cells have two different modes of motility referred to as mesenchymal and amoeboid migration (Sahai, 2005; Prarri and Chiarugi, 2010; Sanz-Moreno and Marshall, 2010; Friedl and Alexander, 2011). The mesenchymal mode is characterized by elongated morphology that requires activation of the small GTPase Rac (Wolf et al., 2003; Friedl and Wolf, 2009; Sanz-Moreno et al., 2008; Yamazaki et al., 2009). In amoeboid motility, cells exhibit a rounded or ellipsoid morphology having weak interaction with surrounding matrices. Elevated Rho induces amoeboid motility by stimulating membrane blebbing through Rho-associated protein kinase (ROCK)-dependent myosin II phosphorylation and consequent actomyosin contractility (Sahai and Marshall, 2003; Wyckoff et al., 2006; Charras and Paluch, 2008; Lämmermann and Sixt, 2009; Poincloux et al., 2011).
Migration modes of cell motility are interconvertible, dependent on environmental conditions; switching between the two migration modes, known as plasticity, is thought to allow invasive tumor cells to adapt to varying microenvironments (Sanz-Moreno and Marshall, 2010; Friedl and Alexander, 2011). This plasticity of tumor cells may limit the effectiveness of therapeutic agents aimed at blocking invasion. For example, blockade of extracellular proteases inhibits mesenchymal motility but does not affect invasion, because cells switch to the amoeboid mode of movement (Sahai and Marshall, 2003; Wolf et al., 2003).
Balance in the elevated levels of activated Rac and Rho determines the mesenchymal or amoeboid mode of cell motility, and mutual antagonism between Rac and Rho contributes to the maintenance of different modes of cell motility (Guilluy et al., 2011). Thus Rac signaling represses amoeboid movement, and Rho/ROCK signaling negatively regulates Rac activity. Through the use of RNA interference (RNAi) screening, it has been shown in melanoma cells that Rac suppresses Rho activity through its effector WAVE2, and Rho inactivates Rac through the activation of ARHGAP22, a GTPase-activating protein (GAP) for Rac. However, the mechanism of ARHGAP22 activation is unclear (Sanz-Moreno et al., 2008). It is also unknown whether ARHGAP22 inactivates Rac in cells other than melanoma cells (e.g., adenocarcinoma cells).
One candidate molecule to manage the suppression of Rac activity in response to Rho/ROCK signaling in tumor cells is FilGAP. FilGAP, closely related to ARHGAP22, is a Rac-specific GAP that suppresses Rac-dependent lamellipodia formation and cell spreading (Ohta et al., 2006; Shifrin et al., 2009; Nieves et al., 2010). FilGAP is phosphorylated by ROCK, and this phosphorylation stimulates its RacGAP activity. Knockdown of endogenous FilGAP by RNAi abrogates ROCK-dependent suppression of lamellae. Forced expression of FilGAP induces membrane blebbing, and ROCK inhibitor suppresses bleb formation. Therefore FilGAP mediates antagonism of Rac by Rho that suppresses cell protrusion and promote cell contraction in a two-dimensional environment (Guilluy et al., 2011).
In this study, we present a new molecular linkage between mesenchymal and amoeboid cell motilities. In MDA-MB-231 breast, A549 lung, PC3 prostate, and SW620 colorectal adenocarcinoma cells, we identified FilGAP, but not ARHGAP22, working downstream of Rho/ROCK to specifically inactivate Rac to induce amoeboid-type cell migration in a three-dimensional environment. FilGAP contributes to the regulation of mesenchymal-to-amoeboid (MAT) transition of tumor cells.
RESULTS
FilGAP is required for MAT in breast cancer cells
To investigate the role of the FilGAP family in tumor cell morphology and movement in a three-dimensional environment, we transfected human MDA-MB-231 breast, A549 lung, PC-3 prostate, or SW620 colorectal adenocarcinoma cells with siRNAs targeting FilGAP and monitored them on thick collagen layers. Knockdown of endogenous FilGAP resulted in a conversion of amoeboid cells into an elongated mesenchymal morphology; this was seen in all adenocarcinoma cells tested (Figure 1 and Supplemental Figure S2). We initially used MDA-MB-231 breast carcinoma cells to investigate the role of FilGAP in the regulation of cancer cell morphology and movement. When MDA-MB-231 cells were plated on top of a thick, deformable layer of type I collagen and cultured for 24 h (Pinner and Sahai, 2008; Sanz-Moreno et al., 2008), the cells displayed a mixed population of mesenchymal and amoeboid morphologies (Control in Figure 1A), consistent with previous studies (Wolf et al., 2003; Deakin and Turner, 2011). Approximately 50% of MDA-MB-231 cells showed a rounded morphology with prominent cortical F-actin and membrane blebs (categorized as round/amoeboid; Figure 1, B and D). On the other hand, elongated cells exhibited long, actin-rich protrusions on collagen gels (categorized as mesenchymal; Figure 1B).
FIGURE 1:

Depletion of FilGAP in breast cancer cells induces highly elongated mesenchymal morphology. (A) MDA-MB-231 cells were transfected with control or FilGAP siRNA and cultured on plastic plates for 48 h. The control or transfected cells were trypsinized and then plated on top of a thick deformable layer of type I collagen and cultured for 24 h. DIC images of cells on collagen gels. Scale bar: 100 μm. (B) Representative images of cells with round/amoeboid or mesenchymal morphology. F-actin was localized by Alexa Fluor 568 phalloidin. Scale bar: 50 μm. (C) Immunoblot showing that FilGAP is depleted after 48 h of siRNA treatment on plastic plates. FilGAP and tubulin were detected by immunoblotting using anti-FilGAP and anti-tubulin antibodies, respectively. Tubulin was used as a loading control. (D) The proportion of cells with round/amoeboid or mesenchymal morphology. The data are the mean ± SD of at least three independent experiments (n > 500 cells counted for each experiment). **, p < 0.01. Statistical significance was determined by Student's t test. (E) Quantification of cell morphology. Ratio calculated as perimeter2/4π ⋅ area (left) and relative values of area (right) are shown as box and whisker plots. Median, quartiles, and highest and lowest values are indicated on box and whisker plots. More than 400 cells (total) were analyzed and categorized as round/amoeboid or mesenchymal morphology. **, p < 0.01. Statistical significance was determined by Mann-Whitney U-test.
Two independent siRNAs targeting FilGAP (KD#1 and KD#2) reduced the expression of endogenous FilGAP (Figure 1C), and depletion of FilGAP by these siRNAs resulted in a significant increase in the proportion of mesenchymal-type elongated cells (Figure 1, A and D). We quantified cell morphology by measuring the perimeter and area of the cells (perimeter2/4π ⋅ area): cells with a higher value exhibited an elongated morphology, whereas lower values (≈1) indicated a rounded morphology. Consistent with the increase in the proportion of elongated cells (Figure 1A), FilGAP-depleted cells exhibited higher perimeter2/4π ⋅ area values than control cells (Figure 1E). In addition, the cell area of mesenchymal cells, but not of round/amoeboid cells, also increased with silenced FilGAP (Figure 1E).
FilGAP has two subfamily members (ARHGAP22 and ARHGAP25). They share a common domain structure (PH-RhoGAP-CC), and the RhoGAP domain of FilGAP shows high homology to that of ARHGAP22 (79% identity) and ARHGAP25 (61% identity; Ohta et al., 2006). FilGAP and ARHGAP22 seem to be expressed in various tissues, whereas ARHGAP25 is expressed predominantly in myeloid cells (Csépányi-Kömi et al., 2012). The FilGAP family proteins seem to act as a GAP for Rac in vivo (Ohta et al., 2006; Sanz-Moreno et al., 2008; Csépányi-Kömi et al., 2012).
It has been reported that depletion of ARHGAP22 leads to the conversion of rounded melanoma cells into elongated mesenchymal morphology (Sanz-Moreno et al., 2008). Therefore we examined the effect of silencing of FilGAP on the morphologies of human M2, A7, and SKMEL2 melanoma cells. A7 is a clonal subline of M2 that has restored filamin expression by transfection (Cunningham et al., 1992), and we have previously shown in two dimensions that FilGAP is required for suppression of lamellae in A7 cells in two dimensions (Ohta et al., 2006). M2 exhibited round cell morphology on collagen gels, whereas A7 displayed predominantly mesenchymal morphology (Figure S3). Depletion of FilGAP had no effect on the morphologies of both M2 and A7 cells in three dimensions (Figure S3). SKMEL2 displayed a mixed population of mesenchymal and amoeboid morphologies on collagen gels (Figure S3), consistent with a previous study (Sanz-Moreno et al., 2008). Depletion of FilGAP and ARHGAP22 (Figure S3; Sanz-Moreno et al., 2008) induced mesenchymal morphology (Figure S3). We could not detect ARHGAP25 expression in both protein and mRNA levels in M2, A7, and SKMEL2 melanoma cells (unpublished data). Thus FilGAP could play a role in certain melanoma cells. On the other hand, depletion of ARHGAP22 or ARHGAP25 had no effect on the morphologies of MDA-MB-231, A549, PC-3, and SW620 adenocarcinoma cells (Figures S1 and S2).
We next quantified the plasticity in morphology of migrating cells during a 24-h culture. Because cells were plated on the gels after trypsinization, cells exhibited a round morphology when the culture was established (Figure 2A). MDA-MB-231 cells can switch between mesenchymal and amoeboid morphology when moving on collagen gels (Supplemental Videos S1 and S2). Seventy-eight percent of control cells converted from a round/amoeboid to a mesenchymal morphology, an event referred as amoeboid-to-mesenchymal transition (AMT; Figure 2A, b and b′). Depletion of FilGAP did not significantly affect AMT (Figure 2B). Fifty-one percent of control cells undergoing AMT converted again to round/amoeboid morphology, MAT, while < 20% of FilGAP-depleted cells in this population showed MAT (Figure 2Ab′ and Videos S3 and S4). Depletion of FilGAP also reduced the frequency of AMT (Figure 2C). Thus, silencing of FilGAP reduced the ability of the cells to exhibit migratory plasticity and induce MAT.
FIGURE 2:
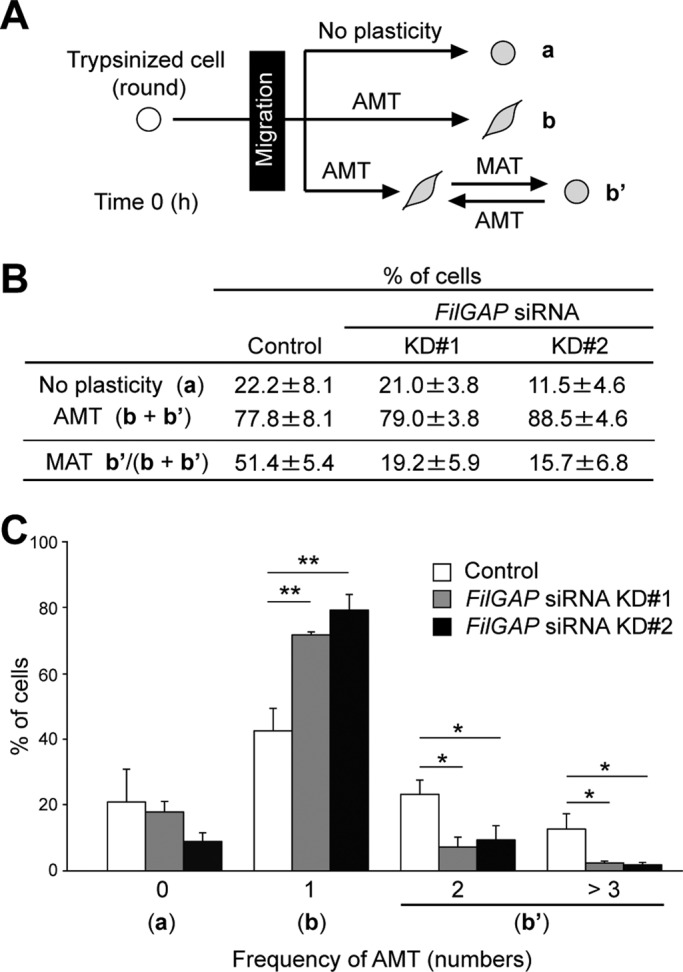
FilGAP is required for MAT. (A) Patterns of morphological change during 24-h culture. Migrating MDA-MB-231 cells were monitored by time-lapse video microscopy for 24 h after seeding on collagen gels (see Material and Methods) and categorized as having no plasticity of migration mode (a) or undergoing AMT (b + b′). (B) The proportion of patterns categorized in (A). The data are the mean ± SD of three independent experiments (n > 50 cells counted for each experiment). Among cells undergoing AMT, the percentage of cells that again converted to the round/amoeboid morphology during 24-h culture was also calculated (MAT: b′ in (A)). (C) Frequency of AMT during 24-h culture in each cell that undergoes AMT. **, p < 0.01; *, p < 0.05. Statistical significance was determined by Student's t test.
FilGAP induces amoeboid morphology
We next studied whether forced expression of FilGAP in MDA-MB-231 cells reduced the proportion of mesenchymal cells, which is in direct contrast with the effect induced by silencing of FilGAP. As expected, forced expression of FilGAP elicited a significant increase in the proportion of round/amoeboid cells (Figure 3, A and C). Consistent with this, overexpression of FilGAP significantly reduced the proportion of the cells undergoing AMT (Figure 3D and Videos S5 and S6). The amoeboid cells induced by FilGAP did not exhibit nuclear breakdown, indicating that they are not apoptotic (unpublished data).
FIGURE 3:

FilGAP induces amoeboid morphology. (A) MDA-MB-231 cells were transfected with a control plasmid (pIRES2-AcGFP), or pIRES2-AcGFP plasmids encoding wild-type FilGAP (WT), FilGAP resistant to siRNA KD#2 sequence (KD#2r), or FilGAP lacking its GAP domain (ΔGAP), and cultured on plastic plates for 24 h. For cotransfection of plasmid DNA and FilGAP siRNA KD#2, the cells were first transfected with siRNA for 24 h and then cotransfected with plasmid DNA; this was followed by an additional 24-h culture on plastic plates. The transfected cells were trypsinized and then plated on collagen gels. After 24 h, cells were fixed and GFP (green) was localized. Merged images of DIC and GFP are shown. Scale bar: 50 μm. (B) Forced expression of FilGAP constructs in cells that were cultured on plastic plates. FilGAP and tubulin (loading control) were detected by immunoblotting. (C) The morphology of GFP-expressing cells was categorized as mesenchymal or round/amoeboid. The data are the mean ± SD of at least three independent experiments (n > 200 cells for each experiment). **, p < 0.01. Statistical significance was determined by Student's t test. (D) Time-lapse video microscopy analysis. MDA-MB-231 cells were transfected with a control plasmid (pIRES2-AcGFP) or pIRES2-AcGFP-FilGAP (WT) and plated on collagen gels. Cells were monitored for 24 h and analyzed. The data are the mean ± SD of three independent experiments (n = 20–30 cells counted for each experiment). *, p < 0.05. Statistical significance was determined by Student's t test.
We introduced silent mutations into targeting sequence of FilGAP siRNA KD#2 (KD#2r) and examined whether mesenchymal morphology induced by FilGAP siRNA KD#2 was prevented. At 48 h posttransfection with FilGAP siRNA KD#2, KD#2r protein, but not wild-type protein, was abundantly expressed in MDA-MB-231 cells (Figure 3B), and cells expressing KD#2r protein showed amoeboid morphology (Figure 3, A and C).
The round/amoeboid phenotype induced by FilGAP requires its RacGAP activity. When wild-type hemagglutinin (HA)-FilGAP was overexpressed in MDA-MB-231 cells, 93% of the cells exhibited round/amoeboid morphology (Figure 4, A and C). In contrast, 43% of the cells expressing HA-FilGAP R175A, whose GAP activity is impaired due to substitution of the critical arginine finger in the GAP domain (Ohta et al., 2006), displayed a mesenchymal morphology (Figure 4, A and C). Similarly, the proportion of mesenchymal cells expressing HA-FilGAP ΔGAP, which lacks its GAP domain, was 47% (Figure 4C). The FilGAP ΔGAP mutant appeared to act as a dominant-negative mutant, because its effect was similar to that of FilGAP depletion (Figure 3, A and C). This was also supported by the observation that the mesenchymal phenotype of cells expressing FilGAP ΔGAP, which is resistant to the siRNA KD#2, because it lacks the targeting sequence for its siRNA (Figure 3B), was not affected by FilGAP siRNA KD#2 transfection (Figures 3, A and C, and 4, A and C). Moreover, cells expressing ARHGAP22 ΔGAP rather than FilGAP ΔGAP did not exhibit a mesenchymal morphology, whereas depletion of FilGAP in these cells resulted in an increase in the proportion of mesenchymal morphology (Figure 4C), indicating that the effect of FilGAP ΔGAP is not simply a result of overexpressing the common domain construct (PH-ΔGAP-CC). These results suggest GAP activity of FilGAP is essential for induction of round/amoeboid morphology.
FIGURE 4:

Round/amoeboid phenotype induced by FilGAP requires its RacGAP activity. (A) MDA-MB-231 cells were transfected with pCMV5-HA plasmids encoding FilGAP (WT), GAP-defective FilGAP mutant (R175A), or FilGAP (ΔGAP), in the absence or presence of FilGAP siRNA KD#2, and cultured on plastic plates for 24 h. The transfected cells were trypsinized and then plated on collagen gels. After 24 h, cells were fixed and stained with phalloidin for F-actin (red) and anti-HA antibody for FilGAP (green). Merged fluorescence images are also shown. Arrowhead indicates a nontransfectant (N.T.). Scale bar: 50 μm. (B) Ectopic expression of HA-FilGAP constructs (left) and HA-ARHGAP22 (ΔGAP; right) in cells that were cultured on plastic plates. HA-tagged proteins, FilGAP, and tubulin (loading control) were detected by immunoblotting using anti-HA, anti-FilGAP, and anti-tubulin antibodies, respectively. Asterisks indicate nonspecific bands. (C) Cells expressing HA-FilGAP constructs or HA-ARHGAP25 (ΔGAP) were counted and categorized as mesenchymal or round/amoeboid. The data are the mean ± SD of three independent experiments (n > 200 cells for each experiment). **, p < 0.01. Statistical significance was determined by Student's t test.
It has been shown that the balance between activated Rac and Rho regulates tumor cell morphology and motility (Sanz-Moreno et al., 2008). Rac drives mesenchymal-type cell motility and suppresses amoeboid movement, while Rho activation leads to the opposite effect. Expression of constitutively active Rac G12V mutant indeed displayed a predominantly mesenchymal morphology in MDA-MB-231 cells, whereas constitutively active Rho G14V mutant exhibited round/amoeboid morphology (Figure S4, A–C). Forced expression of wild-type FilGAP did not change mesenchymal morphology of constitutively active Rac G12V–expressing cells (Figure S4, A–C). We next depleted Rac1 by siRNA (Figure S4E). Rac1-depleted cells showed amoeboid cell morphology, and depletion of FilGAP had no effect on amoeboid morphology (Figure S4, D–F). Similarly, FilGAP-depleted cells showed amoeboid morphology in the presence of Rac1 inhibitor NSC23766 (Figure S4, D–F). Therefore the effect of FilGAP on tumor cell morphology is dependent on Rac activity.
FilGAP is required for Rho/ROCK-dependent amoeboid morphology
Previous studies have demonstrated that Rho/ROCK signaling induced amoeboid cell morphology through activation of actomyosin-dependent contractile machinery and down-regulation of Rac (Sanz-Moreno et al., 2008). Inactivation of Rac is caused by RacGAP activity of ARHGAP22 in melanoma cells (Sanz-Moreno et al., 2008). We have shown that FilGAP is directly phosphorylated by ROCK, and the phosphorylation stimulates its RacGAP activity to inactivate Rac (Ohta et al., 2006). We therefore examined whether FilGAP could be responsible for inactivation of Rac downstream of Rho/ROCK signaling in MDA-MB-231 cells. As shown in a two-dimensional environment, ROCK-specific inhibitor Y27632 abolished FilGAP-induced bleb formation in a three-dimensional environment (Figures 5A and 6C). Y27632 treatment caused disappearance of cortical actin and bleb structures in cells overexpressing FilGAP and resulted in spreading and production of small protrusions (Figures 5A and 6A) (categorized as cells with protrusions in Figure 6C). MDA-MB-231 cells exhibited amoeboid morphology with membrane blebs when ROCK was overexpressed (Figure 5B). Although silencing of FilGAP in cells overexpressing ROCK did not eliminate bleb structures (Figure 5B), these cells spread and produced long protrusions (Figure 5, B–D). Therefore ROCK requires FilGAP to induce amoeboid morphology.
FIGURE 5:

Requirement of FilGAP for Rho/ROCK-dependent amoeboid morphology. (A) MDA-MB-231cells were transfected with HA-FilGAP and cultured on plastic plates for 24 h. The transfected cells were trypsinized and then plated on collagen gels. After 24 h, cells were treated with 10 μM Y27632 for 1 h, fixed, and stained with phalloidin for F-actin (red) and anti-HA antibody for FilGAP (green). Merged fluorescence images are also shown. N.T., nontransfectant. Scale bar: 50 μm. (B) MDA-MB-231 cells were transfected with Myc-ROCK, with or without FilGAP siRNA KD#1, and cultured on plastic plates. The transfected cells were trypsinized and then plated on collagen gels. After 24 h, cells were fixed and stained with phalloidin for F-actin (red) and anti-Myc antibody for ROCK (green). Merged fluorescence images are also shown. Scale bar: 50 μm. (C) Immunoblots of endogenous FilGAP and Myc-ROCK in cells cultured on plastic plates using anti-FilGAP and anti-Myc antibodies, respectively. Tubulin was used as a loading control. (D) Myc-ROCK–expressing cells with long protrusions shown in (B) were counted. The data are the mean ± SD of three independent experiments (n > 100 cells for each experiment). *, p < 0.05. Statistical significance was determined by Student's t test.
FIGURE 6:

Phosphorylation of FilGAP regulates amoeboid morphology. (A) MDA-MB-231cells were transfected with pCMV5-HA plasmids encoding wild-type (WT), nonphosphorylatable (ST/A), or phosphomimic (ST/D) FilGAP mutant and cultured on plastic plates for 24 h. The transfected cells were trypsinized and then plated on collagen gels. After 24 h, cells were left untreated or treated with 10 μM Y27632 or 100 μM blebbistatin for 1 h, fixed, and stained with phalloidin for F-actin (red) and anti-HA antibody for FilGAP (green). Merged fluorescence images are also shown. N.T., nontransfectant. Scale bar: 50 μm. (B) Expression levels of transfected FilGAP in cells that were cultured on plastic plates. HA-FilGAP is detected by immunoblotting. Tubulin was used as a loading control. Asterisk indicates a nonspecific band. (C) HA-FilGAP–expressing cells with protrusions shown in (A) were counted. Nontransfected cells (−) were also counted. The data are the mean ± SD of three independent experiments (n > 200 cells for each experiment). **, p < 0.01; *, p < 0.05. Statistical significance was determined by Student's t test. (D) The morphology of LPA-treated MDA-MB-231 cells. MDA-MB-231 cells were plated on collagen gels, cultured for 8 h, and labeled for 20 h in phosphate- and serum-free medium containing [32P]orthophosphate. The cells were then left untreated (serum-starved) or treated with 10 μM LPA for the indicated times. Scale bar: 100 μm. (E) Cell extracts were prepared from LPA-treated cells in (D), and FilGAP was immunoprecipitated with anti-FilGAP antibody. Phosphoprotein was analyzed by SDS–PAGE, followed by autoradiography (bottom panel). The amounts of phosphorylated FilGAP relative to that in serum-starved cells (black bars, left) and the percentages of round/amoeboid cells (open squares, right) are shown. The data are the mean ± SD of three independent experiments.
We next examined whether phosphorylation of FilGAP by ROCK mediates Rho/ROCK-induced amoeboid cell morphology. A nonphosphorylatable FilGAP mutant with its six potential phosphorylation sites mutated to alanine (FilGAP ST/A) was transfected into MDA-MB-231 cells (Figure 6B). This mutant is unable to manifest ROCK-dependent stimulation of RacGAP activity in vivo (Ohta et al., 2006). We also generated a phosphomimic FilGAP mutant by replacing its phosphorylation sites with aspartate (FilGAP ST/D; Figure 6B). Whereas phosphomimic FilGAP ST/D, as well as wild-type FilGAP, significantly suppressed cell spreading and production of protrusions, transfection of nonphosphorylatable FilGAP ST/A did not induce amoeboid cell morphology and resulted in an increase in the proportion of spreading cells with protrusions (Figure 6, A and C). Moreover, expression of FilGAP ST/D could induce amoeboid cell morphology in the presence of Y27632 when compared with the cells transfected with wild-type FilGAP (Figure 6, A and C). These results suggest that RacGAP activity of FilGAP is stimulated by phosphorylation of FilGAP by ROCK, and activated FilGAP is responsible for inactivation of Rac and suppression of mesenchymal cell morphology.
FilGAP-induced amoeboid morphology is also dependent on myosin. Forced expression of FilGAP failed to induce round/amoeboid morphology in the presence of the myosin II inhibitor blebbistatin, resulting in a significant increase in the proportion of cells with thin and long protrusions (Figure 6, A and C; categorized as cells with protrusions in Figure 6C). These cells, as well as Y27632-treated cells, exhibited disappearance of cortical actin and bleb structures (Figure 6A). Importantly, expression of FilGAP ST/D could induce amoeboid cell morphology, even in the presence of blebbistatin (Figure 6, A and C), suggesting that activation of FilGAP by ROCK could occur in the absence of actomyosin-dependent mechanical contraction.
We finally examined whether phosphorylation level of FilGAP is correlated with morphological changes of MDA-MB-231 cells on collagen gels. MDA-MB-231 cells were cultured on collagen gels and serum-starved. The cells were labeled with [32P]orthophosphate and then stimulated with lyso-phosphatidic acid (LPA), an activator of Rho/ROCK signaling (Amano et al., 1997). The population of rounded cells increased within 30 min of stimulation, and then gradually declined (Figure 6, D and E). We found that phosphorylation of endogenous FilGAP also was increased by LPA, reached maximal level at around 30 min after stimulation, and then declined (Figure 6E). Thus FilGAP may be highly phosphorylated in amoeboid cells.
FilGAP mediates breast cancer cell invasion
To elucidate the role of FilGAP in cell motility, we performed random cell migration analysis on collagen gels, using MDA-MB-231 cells. Depletion of FilGAP did not affect overall velocity of moving cells (0.20 ± 0.12 μm/min in control cells vs. 0.18 ± 0.10 μm/min in FilGAP-depleted cells). Consistent with this result, there was no significant difference between the migration velocity of mesenchymal and amoeboid cells on collagen gels (unpublished data).
We next tested the role of FilGAP in tumor invasion into collagen gels in the presence of hepatocyte growth factor (HGF), a known motility factor for MDA-MB-231cells (Schoumacher et al., 2010). Silencing of FilGAP caused a significant decrease in the proportion of invaded MDA-MB-231 cells with round/amoeboid morphology (Figure 7, A–C). Thus FilGAP has an important role in tumor invasion through extracellular matrices.
FIGURE 7:

FilGAP mediates breast cancer cell invasion and metastasis. (A) Invasion into collagen gels of MDA-MB-231 cells transfected with control or FilGAP siRNA. Cells were fixed after 24 h of type I collagen invasion assay and stained with phalloidin for F-actin. Cells were imaged by confocal microscopy as a stack of x-y sections. Representative x-z (top) and x-y (bottom) projections of cells are shown as a stacked image of sections (0 μm < z < 300 μm). Yellow dotted line (arrow) indicates 25 μm above the bottom of a plate. (B) Cells invading over a distance of 25 μm were counted. Data are presented as percentage of the invasion index of control cells. The invasion index was calculated as number of cells invading > 25 μm divided by the total number of cells (0 μm < z < 300 μm) in 10–20 fields selected randomly for each experiment. (C) The proportion of invaded cells with round/amoeboid or mesenchymal morphology (n > 60 cells). In (B) and (C), three independent experiments were performed (error bars indicate ± SD). p values in comparison with control cells as determined by Student's t test are shown (**, p < 0.01). (D) Lung extravasation assay. MDA-MB-231 cells stably expressing GFP were injected into tail veins of nude mice after FilGAP siRNA treatment for 48 h. Mice were killed at 30 min or 6 h after injection. The merged image of phase contrast and GFP (left), and representative images of each experiment (right) are shown. Scale bars: 100 μm. (E) Quantification of the relative area of extravasated cells to lungs. Data are presented as percentage of the extravasation index of control cells. The extravasation index was calculated as area of GFP-expressing cells divided by the area of lung in 10 fields of sections selected randomly for each experiment (n = 4; error bars indicate ± SD). p values in comparison with control cells as determined by Student's t test are shown.
During tumor metastasis, cell motility is required for extravasation, a process by which tumor cells leave a blood or lymphatic vessel and invade the surrounding tissue parenchyma. For determining whether FilGAP is involved in this invasion process, a short-term extravasation assay was performed as previously described (Pinner and Sahai, 2008; Sanz-Moreno et al., 2008). The MDA-MB-231 cell line stably expressing green fluorescent protein (GFP) was prepared and injected into the tail veins of nude mice after FilGAP siRNA treatment. This stable cell line treated with the FilGAP siRNAs exhibited an elongated morphology on collagen gels similar to the results shown in Figure 1 (Figure S5). Because MDA-MB-231 cells metastasize to the lung (Minn et al., 2005; Deakin and Turner, 2011), the ability of the cells to move into lungs was assessed (Figure 7D). Thirty minutes after injection, similar numbers of control and FilGAP-depleted cells were delivered to the lungs and adhered to the blood vessels of the lungs (Figure 7, D and E). After 6 h, however, depletion of FilGAP reduced the number of cells found in the lungs (Figure 7, D and E). This suggests that depletion of FilGAP reduced the extravasation and/or enhanced detachment from blood vessels.
DISCUSSION
Our findings show that FilGAP is required for ROCK-induced amoeboid morphology in a three-dimensional environment (Figure 8). In MDA-MA-231 cells, forced expression of ROCK induced blebbing, and cells exhibited rounded morphology on collagen gels. On the other hand, depletion of FilGAP in these cells induced long processes, and cells became elongated on collagen gels. We previously demonstrated in a two-dimensional environment that overexpression of ROCK induced contraction of the cells with prominent stress-fiber formation, and depletion of FilGAP induced lamellae formation in the cells (Ohta et al., 2006). Therefore, in both two dimensions and three dimensions, FilGAP seems to mediate ROCK-dependent suppression of lamellae formation.
FIGURE 8:
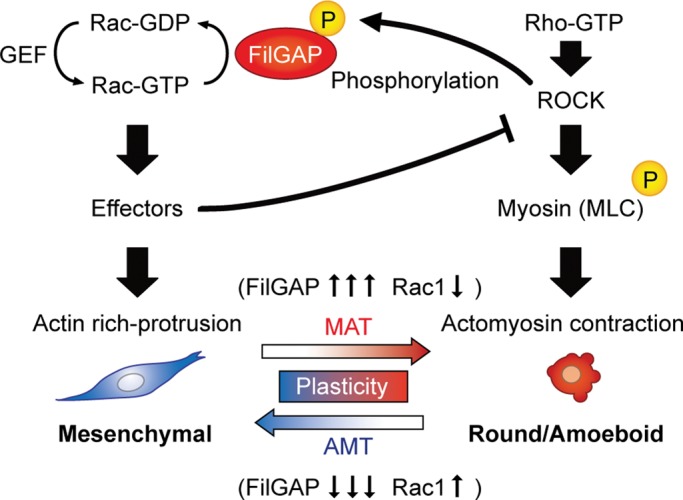
Proposed role of FilGAP in the regulation of plasticity of cancer cell migration. Cell morphologies are determined by the balance of Rac and Rho/ROCK/MLC activities. ROCK phosphorylates and stimulates FilGAP and myosin, inducing MAT through direct inactivation of Rac and actomyosin contraction, respectively. This myosin phosphorylation and consequent actomyosin contraction may also promote the activity of FilGAP indirectly. Conversely, down-regulation of FilGAP elevates Rac activity and promotes mesenchymal morphology with production of an actin-rich protrusion, resulting in AMT. Activated Rac may antagonize Rho/ROCK signaling through its effectors. Inactivation of Rac by FilGAP may reduce the antagonistic effect of Rho/ROCK/myosin by Rac and lead to MAT.
FilGAP and ARHGAP22 are closely related RacGAP, and both seem to mediate Rho/ROCK-dependent suppression of Rac and regulate MAT of tumor cells. FilGAP appears to be predominantly responsible for MAT in carcinoma cells and ARHGAP22 in melanoma cells. On the other hands, FilGAP seems to also be involved in the regulation of MAT in certain melanoma cells, suggesting that FilGAP controls cell morphology in a wide range of tumor cell types. ARHGAP25 does not seem to be responsible for regulation of tumor cell morphology. It is unclear why the contribution of FilGAP family members such as RacGAP is different in tumor cell types and lines. Nonetheless, our study shows that FilGAP and its family members play an essential role in the Rho-dependent antagonism of Rac to induce amoeboid movement.
The mechanism of bleb formation by Rho/ROCK signaling is still unclear, but ROCK appears to stimulate myosin and FilGAP, and they seem to be involved in bleb formation. ROCK stimulates myosin through phosphorylation of myosin light chain (MLC), and membrane blebbing requires myosin activity, because the myosin-specific inhibitor blebbistatin abolished bleb formation (Wilkinson et al., 2005; Fackler and Grosse, 2008). A previous study has demonstrated that ARHGAP22, a RacGAP closely related to FilGAP, is responsible for inactivation of Rac downstream of Rho/ROCK signaling in melanoma cells. However, activation of ARHGAP22 is not caused by direct phosphorylation of ARHGAP22 by ROCK but is dependent on myosin activity (Sanz-Moreno et al., 2008). Our study shows that phosphorylation of FilGAP by ROCK directly activates FilGAP, and activated FilGAP is responsible for induction of bleb formation in carcinoma cells. First, FilGAP is located downstream of ROCK, because the ROCK inhibitor Y27632 abolished FilGAP-dependent bleb formation. Second, phosphomimic mutant FilGAP ST/D induced prominent membrane blebs and rounded cell morphology, whereas nonphosphorylatable mutant FilGAP ST/A did not produce amoeboid cell morphology. Third, phosphomimic mutant FilGAP ST/D could induce membrane blebs and rounded cell morphology, even in the presence of the ROCK inhibitor Y27632. Finally, in vivo phosphorylation level of FilGAP was correlated with Rho/ROCK-induced morphological changes of MDA-MB-231 cells on collagen gels. Therefore phosphorylation of FilGAP by ROCK appears to promote amoeboid morphology of carcinoma cells. Phosphorylation of FilGAP, however, may not be essential for its function, because FilGAP ST/A did not completely abolish the amoeboid phenotype induced by FilGAP.
Of the six sites in FilGAP that are phosphorylated by ROCK in vitro, it is unclear which sites are preferentially phosphorylated and involved in the regulation of FilGAP in vivo. Of the potential phosphorylation sites in FilGAP, one site Ser-402 is conserved in the other subfamily proteins (Ser-395 in ARHGAP22 and Ser-400 in ARHGAP25). This conserved site of FilGAP seems to be important, as the serine–alanine mutant S402A was the least efficient in inducing membrane blebs in two dimensions (Ohta et al., 2006). Moreover, Ser-402 is the only phosphorylation site that satisfies the preferential consensus sequence for ROCK (Ohta et al., 2006). However, the FilGAP ST/A mutant, with all six potential sites mutated to alanine, is less active than FilGAP S402 (Ohta et al., 2006). Therefore other phosphorylation sites seem to be involved in the regulation of FilGAP activity. Further study is necessary to identify the critical phosphorylation sites to activate FilGAP in vivo.
It has been suggested that myosin is involved in both expansion and retraction of membrane blebs through actomyosin-dependent contraction (Charras and Paluch, 2008; Fackler and Grosse, 2008). Mechanical disruption of cortical actin–membrane interaction triggers bleb expansion and requires myosin activity (Paluch et al., 2006). Actomyosin contractility also induces bleb retraction (Cunningham, 1995). Our study showed that inhibition of myosin significantly reduced the efficiency of FilGAP-induced bleb formation. It has been shown that overexpression of ROCK induces activation of myosin (Fackler and Grosse, 2008), but we show in this study that depletion of FilGAP also reduces ROCK-dependent bleb formation. Therefore actomyosin-dependent contraction and FilGAP-dependent Rac inactivation may work cooperatively to induce bleb formation downstream of ROCK (Figure 8). It is, however, possible that FilGAP is indirectly activated by myosin, which is also observed in the activation of ARHGAP22 (Sanz-Moreno et al., 2008). The involvement of myosin in the activation of FilGAP is supported by a recent observation that mechanical tension, such as actomyosin contraction, releases FilGAP from filamin A and translocates FilGAP to the membrane to activate its RacGAP activity (Ehrlicher et al., 2011).
It is highly likely that cell morphologies are determined by the balance of Rac and Rho/ROCK/MLC activities (Sanz-Moreno et al., 2008), and Rac and Rho antagonize each other (Guilluy et al., 2011). Thus high Rac activity caused by depletion of FilGAP prevents Rho-induced bleb formation (Figure 5, B and D), and low Rac activity caused by forced expression of FilGAP prevents cell spreading, even when Rho activity is low (Figure 6, A and C). Rho may antagonize Rac through FilGAP family RacGAP, whereas Rac may antagonize Rho through its effectors (Sanz-Moreno et al., 2008).
Finally, our study demonstrated that silencing of FilGAP in MDA-MB-231 cells significantly reduced invasion in collagen gels in vitro and tumor extravasation in vivo. Recent studies have revealed that Rho/ROCK signaling promotes invasion and metastasis, most probably by favoring round blebbing–associated motility of tumor cells (Itoh et al., 1999; Wyckoff et al., 2000; Gadea et al., 2007; Kitzing et al., 2007; Tournaviti et al., 2007; Sanz-Moreno et al., 2011). Rho/ROCK-dependent activation of FilGAP induces amoeboid movement of carcinoma cells. Thus FilGAP may play a central role in the tumor invasion and metastasis by controlling the amoeboid mode of movement.
MATERIALS AND METHODS
Plasmids
The HA-tagged FilGAP (wild-type, R175A, ΔGAP, and ST/A) constructs in pCMV5 vector were described previously (Ohta et al., 2006). The phosphomimic mutant FilGAP construct (ST/D), in which Ser-391, Ser-402, Ser-413, Ser-415, Ser-437, and Thr-452 were mutated to aspartate, was made by using the QuikChange site-directed mutagenesis kit (Stratagene, La Jolla, CA) according to the manufacturer's instructions. The FilGAP siRNA KD#2-resistant construct (KD#2r) was generated by introducing point mutations at nucleotide positions 771, 777, 780, 786, and 792 of the FilGAP coding sequence using the QuikChange site-directed mutagenesis kit. The final mutant sequence resistant to FilGAP siRNA KD#2 was CC771GTGGTG777AAC780TACAAT786CTCCTG792AA. The pIRES2-AcGFP plasmid (Clontech, Palo Alto, CA) encoding FilGAP constructs (wild-type, ΔGAP, and KD#2r) was generated as follows: the FilGAP coding sequence was PCR-amplified using each pCMV5-HA–based plasmid as a template, and the PCR products were inserted into the pIRES2-AcGFP vector and sequenced. A cDNA encoding full-length ARHGAP22 was amplified by PCR from the MDA-MB-231 cDNA library and cloned into the pCMV5-HA plasmid. An ARHGAP22 cDNA lacking the GAP domain (ΔGAP) in the pCMV5-HA plasmid was generated by PCR. The details of the constructs and sequences of ARHGAP22 cDNA are available on request. For generation of a stable cell line expressing GFP, the pSIREN-RetroQ vector (Clontech) containing IRES-EGFP was used. The Myc-tagged p160 ROCK (full-length) construct in pCAG vector was a gift from S. Narumiya (Kyoto University, Japan).
siRNA
siRNA oligonucleotide duplexes targeting human FilGAP were purchased from Invitrogen (Carlsbad, CA). The targeting sequences were as follows: FilGAP, KD#1 5′-AAGAUAGAGUAUGAGUCCAGGAUAA-3′ (nt 1975–1999) and KD#2 5′-CAGUGGUAAAUUACAACCUCCUCAA-3′ (nt 770–794).
Cell culture and transfection
MDA-MB-231 cells (ATCC, Manassas, VA) were cultured in DMEM (Sigma-Aldrich, St. Louis, MO) supplemented with 10% (vol/vol) fetal bovine serum (FBS) and 50 U/ml penicillin/streptomycin at 37°C/5% CO2. Cells were transfected with plasmid DNA for 24 h or FilGAP siRNA for 48 h using Lipofectamine 2000 (Invitrogen) according to the manufacturer's instructions. For cotransfection of plasmid DNA and FilGAP siRNA, cells were first transfected with siRNA for 24 h and then cotransfected with plasmid DNA; this was followed by an additional 24-h culture. For a stable cell line of MDA-MB-231 cells expressing GFP, cells were transfected with the pSIREN-RetroQ plasmid containing IRES-EGFP and selected at 0.5 μg/ml puroMycin (Sigma-Aldrich). Cell culture on collagen gels was performed as previously described (Hooper et al., 2006; Sanz-Moreno et al., 2008). Briefly, collagen gels were prepared by mixing 5× culture media, 50× HEPES (pH 7.5), and soluble rat tail type I collagen (BD Biosciences, Bedford, MA) to achieve a final concentration of ∼1.7 mg/ml, and the mixtures were placed in six-well plates. Control or transfected cells cultured on plastic plates were trypsinized and then seeded on gels covered with culture medium ([2–4] × 104 cells/well).
Microscopic observations
Cells that were cultured on collagen gels for 24 h were washed twice with phosphate-buffered saline (PBS) and fixed with 3.7% (vol/vol) formaldehyde for 10 min. For visualization of F-actin and nuclei, fixed cells were permeabilized with 0.5% Triton X-100 in PBS for 10 min and stained with Alexa Fluor 568–phalloidin for F-actin and Hoechst 33258 for nuclei in PBS for 2 h. For immunofluorescence, fixed cells were permeabilized, incubated with blocking buffer (10% blocking one [Nakarai Tesque, Kyoto, Japan] in PBS) for 30 min, and immunostained with primary antibodies in blocking buffer for 3 h. Cells were then washed and incubated with Alexa Fluor dye–labeled secondary antibodies (Invitrogen) in blocking buffer for 2 h. After being washed with PBS, cells were observed under an Olympus IX81 fluorescence microscope with a UPlanSApo 10× objective (Olympus, Tokyo, Japan). Images were acquired by a charge-coupled device camera (ORCA-ER; Hamamatsu Photonics, Hamamatsu, Japan) and MetaMorph software (Molecular Devices, Sunnyvale, CA). Apoptotic cells with nuclear pyknosis or fragmented nuclei were detected morphologically by Hoechst staining and excluded from analysis. The perimeter and area of cells were calculated from images of cells stained with phalloidin using MetaMorph software. Time-lapse differential interference contrast (DIC) images were recorded at 15-min intervals for 24 h.
Phosphorylation assay
Phosphorylation of FilGAP was examined as described previously (Ohta et al., 2006), with modifications. Briefly, MDA-MB-231 cells were plated on 1 ml of collagen gel (2 × 10⁵ cells/35-mm dish), cultured for 8 h, and labeled for 20 h in phosphate- and serum-free DMEM medium containing [32P]orthophosphate (7.4 MBq/ml). The 32P-labeled cells were then treated with 10 μM LPA for 0, 15, 30, and 60 min. Cells were washed twice in Tris-buffered saline (TBS) and solubilized in 150 μl of radioimmunoprecipitation assay (RIPA) buffer (50 mM Tris-HCl, pH 7.4, 0.5 M NaCl, 0.5% Triton X-100, 0.5% deoxycholate, 0.1% SDS, 1 mM EDTA, 1 mM sodium orthovanadate, 30 mM sodium pyrophosphate, 50 mM NaF, and 1 mM phenylmethylsulfonyl fluoride). Cell lysates were centrifuged at 20,000 × g for 15 min to remove unsoluble collagen gels. The supernatants were incubated with anti-FilGAP antibody for 60 min; this was followed by incubation with protein A-Sepharose for 60 min. Immune complexes were washed, and bound FilGAP was analyzed by SDS–PAGE and autoradiography. Immunoblot analysis showed that equal amounts of FilGAP were immunoprecipitated for each time point (unpublished data).
Invasion assay
A three-dimensional collagen invasion assay was performed as previously described (Sanz-Moreno et al., 2008). Cells were suspended in serum-free type I collagen solution at 2.0 mg/ml to a final concentration of 2 × 10⁴ cells/500 μl and then dispensed into 12-well plates. Plates were centrifuged at 300 × g for 10 min and incubated at 37°C/5% CO2 for 1 h before media cells that invaded the gels from the bottom of the plates were fixed with formaldehyde and stained with phalloidin and Hoechst 33258. For quantifying the invasion, images were acquired as a stack of x-y sections between 0 μm (bottom of well) and 300 μm using a Zeiss LSM510 confocal laser-scanning microscopy with a 10× objective (Carl Zeiss MicroImaging, Jena, Germany) and analyzed using a Zeiss LSM Image browser. The invasion index was calculated as number of cells invading >25 μm divided by the total number of cells (0 μm < z < 300 μm) in 10–20 fields selected randomly for each experiment.
Lung extravasation assay
MDA-MB-231 cells stably expressing GFP were transfected with control or FilGAP siRNA. Forty-eight hours after transfection, cells were trypsinized, resuspended in PBS, and injected into the tail veins of nude mice (2 × 10⁶ cells per mouse in 400 μl of PBS). Mice were killed at 30 min or 6 h after injection, and lungs were removed and fixed with 4% (vol/vol) paraformaldehyde overnight at 4°C. Fixed tissues were cryoprotected in sucrose, frozen in optical cutting temperature (OCT) compound (Sakura Finetek, Tokyo, Japan), and sectioned at 10 μm on a cryostat. Sections were incubated with blocking/wash buffer (10% blocking one [Nakarai] and 0.05% Tween20 in PBS) for 30 min and stained with anti-GFP antibodies in blocking/wash buffer for 2 h; this was followed by incubation with Alexa Fluor 488 secondary antibodies and Hoechst 33258 in blocking/wash buffer for 1 h. After being mounted with AquaPoly/Mount (Polysciences, Warrington, PA), sections were observed under an Olympus IX81 fluorescence microscope with a UPlanSApo 10× objective (Olympus) controlled by MetaMorph software (Molecular Devices). The extravasation index was calculated as area of anti–GFP-positive cells divided by the area of lung tissues in 10 fields of sections selected randomly for each experiment using MetaMorph software.
Antibodies and regents
Mouse anti-HA (12CA5) and anti–α-tubulin monoclonal antibodies were purchased from Sigma-Aldrich. Rabbit anti-GFP polyclonal antibody was purchased from MBL (Nagoya, Japan). Rabbit anti-FilGAP polyclonal antibody was prepared as described previously (Ohta et al., 2006). Secondary antibodies conjugated to Alexa Fluor 488 or 568 or Alexa Fluor 568–phalloidin (Invitrogen); Hoechst 33258 (Dojido Laboratories, Kumamoto, Japan); Y27632, blebbistatin, or LPA (Sigma-Aldrich) were also purchased from commercial sources.
Statistical analysis
The statistical significant was accessed by two-tailed unpaired Student's t test or Mann-Whitney U-test. Differences were considered to be statistically significant at a p value of <0.05. Error bars (SD) and p values were determined from results of at least three or more experiments.
Supplementary Material
Acknowledgments
We thank J. Inoue and T. Kitamoto (Kitasato University, Japan) for helpful advice and technical assistance with in vivo lung extravasation assay. This work was supported by Grants-in-Aid for Scientific Research from the Japan Society for the Promotion of Science and the Ministry of Education, Culture, Sports, Science, and Technology of Japan, Grant for All Kitasato Project Study, and Kitasato University Research Grant for Young Researchers.
Abbreviations used:
- AMT
amoeboid-to-mesenchymal transition
- DIC
differential interference contrast
- ECM
extracellular matrix
- FBS
fetal bovine serum
- GAP
GTPase-activating protein
- GFP
green fluorescent protein
- HA
hemagglutinin
- HGF
hepatocyte growth factor
- LPA
lyso-phosphatidic acid
- MAT
mesenchymal-to-amoeboid transition
- MLC
myosin light chain
- PBS
phosphate-buffered saline
- RNAi
RNA interference
- ROCK
Rho-associated protein kinase
Footnotes
This article was published online ahead of print in MBoC in Press (http://www.molbiolcell.org/cgi/doi/10.1091/mbc.E12-04-0310) on October 24, 2012.
REFERENCES
- Amano M, Chihara K, Kimura K, Fukata Y, Nakamura N, Matsuura Y, Kaibuchi K. Formation of actin stress fibers and focal adhesions enhanced by Rho-kinase. Science. 1997;275:1308–1311. doi: 10.1126/science.275.5304.1308. [DOI] [PubMed] [Google Scholar]
- Charras G, Paluch E. Blebs lead the way: how to migrate without lamellipodia. Nat Rev Mol Cell Biol. 2008;9:730–736. doi: 10.1038/nrm2453. [DOI] [PubMed] [Google Scholar]
- Csépányi-Kömi R, Sirokmány G, Geiszt M, Ligeti E. ARHGAP25, a novel Rac GTPase-activating protein, regulates phagocytosis in human neutrophilic granulocytes. Blood. 2012;119:573–582. doi: 10.1182/blood-2010-12-324053. [DOI] [PubMed] [Google Scholar]
- Cunningham CC. Actin polymerization and intracellular solvent flow in cell surface blebbing. J Cell Biol. 1995;129:1589–1599. doi: 10.1083/jcb.129.6.1589. [DOI] [PMC free article] [PubMed] [Google Scholar]
- Cunningham CC, Gorlin JB, Kwiatkowski DJ, Hartwig JH, Janmey PA, Byers HR, Stossel TP. Actin-binding protein requirement for cortical stability and efficient locomotion. Science. 1992;255:325–327. doi: 10.1126/science.1549777. [DOI] [PubMed] [Google Scholar]
- Deakin NO, Turner CE. Distinct roles for paxillin and Hic-5 in regulating breast cancer cell morphology, invasion, and metastasis. Mol Biol Cell. 2011;22:327–341. doi: 10.1091/mbc.e10-09-0790. [DOI] [PMC free article] [PubMed] [Google Scholar]
- Ehrlicher AJ, Nakamura F, Hartwig JH, Weitz DA, Stossel TP. Mechanical strain in actin networks regulates FilGAP and integrin binding to filamin A. Nature. 2011;478:260–263. doi: 10.1038/nature10430. [DOI] [PMC free article] [PubMed] [Google Scholar]
- Fackler OT, Grosse R. Cell motility through plasma membrane blebbing. J Cell Biol. 2008;181:879–884. doi: 10.1083/jcb.200802081. [DOI] [PMC free article] [PubMed] [Google Scholar]
- Friedl P, Alexander S. Cancer invasion and the microenvironment: plasticity and reciprocity. Cell. 2011;147:992–1009. doi: 10.1016/j.cell.2011.11.016. [DOI] [PubMed] [Google Scholar]
- Friedl P, Wolf K. Proteolytic interstitial cell migration: a five-step process. Cancer Metastasis Rev. 2009;28:129–135. doi: 10.1007/s10555-008-9174-3. [DOI] [PubMed] [Google Scholar]
- Gadea G, de Toledo M, Anguille C, Roux P. Loss of p53 promotes RhoA-ROCK-dependent cell migration and invasion in 3D matrices. J Cell Biol. 2007;178:23–30. doi: 10.1083/jcb.200701120. [DOI] [PMC free article] [PubMed] [Google Scholar]
- Guilluy C, Garcia-Mata R, Burridge K. Rho protein crosstalk: another social network? Trends Cell Biol. 2011;21:718–726. doi: 10.1016/j.tcb.2011.08.002. [DOI] [PMC free article] [PubMed] [Google Scholar]
- Hooper S, Marshall JF, Sahai E. Tumor cell migration in three dimensions. Methods Enzymol. 2006;406:625–643. doi: 10.1016/S0076-6879(06)06049-6. [DOI] [PubMed] [Google Scholar]
- Itoh K, Yoshioka K, Akedo H, Uehata M, Ishizaki T, Narumiya S. An essential part for Rho-associated kinase in the transcellular invasion of tumor cells. Nat Med. 1999;5:221–225. doi: 10.1038/5587. [DOI] [PubMed] [Google Scholar]
- Kitzing TM, Sahadevan AS, Brandt DT, Knieling H, Hannemann S, Fackler OT, Grosshans J, Grosse R. Positive feedback between Dia1, LARG, and RhoA regulates cell morphology and invasion. Genes Dev. 2007;21:1478–1483. doi: 10.1101/gad.424807. [DOI] [PMC free article] [PubMed] [Google Scholar]
- Lämmermann T, Sixt M. Mechanical modes of “amoeboid” cell movement. Curr Opin Cell Biol. 2009;21:636–644. doi: 10.1016/j.ceb.2009.05.003. [DOI] [PubMed] [Google Scholar]
- Minn AJ, et al. Genes that mediate breast cancer metastasis to lung. Nature. 2005;436:518–524. doi: 10.1038/nature03799. [DOI] [PMC free article] [PubMed] [Google Scholar]
- Nieves B, Jones CW, Ward R, Ohta Y, Reverte CG, LaFlamme SE. The NPIY motif in the integrin β1 tail dictates the requirement for talin-1 in outside-in signaling. J Cell Sci. 2010;123:1216–1226. doi: 10.1242/jcs.056549. [DOI] [PMC free article] [PubMed] [Google Scholar]
- Ohta Y, Hartwig JH, Stossel TP. FilGAP, a Rho- and ROCK-regulated GAP for Rac binds filamin A to control actin remodelling. Nat Cell Biol. 2006;8:803–814. doi: 10.1038/ncb1437. [DOI] [PubMed] [Google Scholar]
- Paluch E, Sykes C, Prost J, Bornens M. Dynamic modes of the cortical actomyosin gel during cell locomotion and division. Trends Cell Biol. 2006;15:5–10. doi: 10.1016/j.tcb.2005.11.003. [DOI] [PubMed] [Google Scholar]
- Pinner S, Sahai E. PDK1 regulates cancer cell motility by antagonising inhibition of ROCK1 by RhoE. Nat Cell Biol. 2008;10:127–137. doi: 10.1038/ncb1675. [DOI] [PubMed] [Google Scholar]
- Poincloux R, Collin O, Lizárraga F, Romano M, Debray M, Piel M, Chavrier P. Contractility of the cell rear drives invasion of breast tumor cells in 3D Matrigel. Proc Natl Acad Sci USA. 2011;108:1943–1948. doi: 10.1073/pnas.1010396108. [DOI] [PMC free article] [PubMed] [Google Scholar]
- Prarri M, Chiarugi P. Rac and Rho GTPases in cancer cell motility control. Cell Commun Signal. 2010;8:23. doi: 10.1186/1478-811X-8-23. [DOI] [PMC free article] [PubMed] [Google Scholar]
- Sahai E. Mechanisms of cancer cell invasion. Curr Opin Cell Biol. 2005;15:87–96. doi: 10.1016/j.gde.2004.12.002. [DOI] [PubMed] [Google Scholar]
- Sahai E, Marshall CJ. Differing modes of tumor cell invasion have distinct requirements for Rho/ROCK signalling and extracellular proteolysis. Nat Cell Biol. 2003;5:711–719. doi: 10.1038/ncb1019. [DOI] [PubMed] [Google Scholar]
- Sanz-Moreno V, et al. ROCK and JAK1 signaling cooperate to control actomyosin contractility in tumor cells and stroma. Cancer Cell. 2011;20:229–245. doi: 10.1016/j.ccr.2011.06.018. [DOI] [PubMed] [Google Scholar]
- Sanz-Moreno V, Gadea G, Ahn J, Paterson H, Marra P, Pinner S, Sahai E, Marshall CJ. Rac activation and inactivation control plasticity of tumor cell movement. Cell. 2008;135:510–523. doi: 10.1016/j.cell.2008.09.043. [DOI] [PubMed] [Google Scholar]
- Sanz-Moreno V, Marshall CJ. The plasticity of cytoskeletal dynamics underlying neoplastic cell migration. Curr Opin Cell Biol. 2010;22:690–696. doi: 10.1016/j.ceb.2010.08.020. [DOI] [PubMed] [Google Scholar]
- Schoumacher M, Golman RD, Louvard D, Vignjevic DM. Actin, microtubules, and vimentin intermediate filaments cooperate for elongation of invadopodia. J Cell Biol. 2010;189:541–556. doi: 10.1083/jcb.200909113. [DOI] [PMC free article] [PubMed] [Google Scholar]
- Shifrin Y, Arora PD, Ohta Y, Calderwood DA, McCulloch CA. The role of FilGAP-filamin A interactions in mechanoprotection. Mol Biol Cell. 2009;20:1269–1279. doi: 10.1091/mbc.E08-08-0872. [DOI] [PMC free article] [PubMed] [Google Scholar]
- Tournaviti S, Hannemann S, Terjung S, Kitzing TM, Stegmayer C, Ritzerfeld J, Walther P, Grosse R, Nickel W, Fackler OT. SH4-domain-induced plasma membrane dynamization promotes bleb-associated cell motility. J Cell Sci. 2007;120:3820–3829. doi: 10.1242/jcs.011130. [DOI] [PubMed] [Google Scholar]
- Wilkinson S, Paterson HF, Marshall CJ. Cdc42-MRCK and Rho-ROCK signalling cooperate in myosin phosphorylation and cell invasion. Nat Cell Biol. 2005;7:255–261. doi: 10.1038/ncb1230. [DOI] [PubMed] [Google Scholar]
- Wolf K, Mazo I, Leung H, Engelke K, von Andrian U, Deryugina E, Strongin A, Brocker E, Friedl P. Compensation mechanism in tumor cell migration: mesenchymal-amoeboid transition after blocking of pericellular proteolysis. J Cell Biol. 2003;160:267–277. doi: 10.1083/jcb.200209006. [DOI] [PMC free article] [PubMed] [Google Scholar]
- Wyckoff J, Jones J, Condeelis J, Segall J. A critical step in metastasis: in vivo analysis of intravasation at the primary tumor. Cancer Res. 2000;60:2504–2511. [PubMed] [Google Scholar]
- Wyckoff J, Pinner S, Gschmeissner S, Condeelis J, Sahai E. ROCK- and myosin-dependent matrix deformation enables protease-independent tumor-cell invasion. Curr Biol. 2006;16:1515–1523. doi: 10.1016/j.cub.2006.05.065. [DOI] [PubMed] [Google Scholar]
- Yamazaki D, Kurisu S, Takenawa T. Involvement of Rac and Rho signaling in cancer cell motility in 3D substrates. Oncogene. 2009;28:1570–1583. doi: 10.1038/onc.2009.2. [DOI] [PubMed] [Google Scholar]
Associated Data
This section collects any data citations, data availability statements, or supplementary materials included in this article.