

Abstract
Water and sodium retention precedes the development of high blood pressure (BP) and explains a compensatory rise in B-type natriuretic peptide (BNP) concentrations. It is unclear if BNP concentrations antedate the BP progression. We hypothesized higher BNP concentrations in our African American cohort will be associated with longitudinal increases in BP, progression of BP stage and incident hypertension.
Our study sample consisted of 888 normotensive [based on BP at Examination 1(2000-04)] participants of the Jackson Heart Study (mean age 47±12 years, 61% women). We examined the relation of BNP concentrations at the baseline examination to change in systolic and diastolic BP, BP progression (an increase by one BP stage as defined by JNC VI) and incident hypertension by Examination 2 (2005-08) adjusting for baseline BP stages, systolic and diastolic BP, traditional risk factors and echocardiographic LV mass.
Over a median follow-up period of 5.0± 0.8 years, 36.9% progressed to a higher BP stage and 19.3% developed hypertension. In multivariable regression models, higher log-BNP concentrations at Examination 1 were significantly and positively associated with changes in systolic and diastolic BP (p <0.05 for both). Baseline log-BNP was significantly associated with BP progression (p = 0.046). Every SD increase in baseline log BNP was associated with a 12% increased risk of BP progression. Log-BNP was not significantly associated with incident hypertension (p=0.12).
In our community-based sample of African Americans, higher BNP concentrations predict longitudinal increase in systolic and diastolic BP and progression of BP stage.
Keywords: Blood Pressure, B-type Natriuretic Peptide, African Americans
INTRODUCTION
B-type natriuretic peptide (BNP) is a peptide hormone released by the cardiac myocytes in response to myocardial stretch during pressure and volume overload states.1, 2 The peptide has known systemic effects, including vasodilatation, increase in urinary output and sodium excretion as well as inhibition of the sympathetic nervous system and the renin–angiotensin–aldosterone system.3 BNP maintains hemodynamic and neurohormonal equilibrium by counter balancing the vasoconstriction and retentive effects of sustained neurohormonal secretion.2 Though it acts as a compensating mechanism in order to reduce preload and afterload, the increase in endogenous BNP is not sufficient to compensate for pressure and volume overload in disease states such as hypertension and heart failure.1
Animal studies suggests that BNP expression antedate the development of hypertension.4 Although circulating plasma BNP concentrations have been associated with blood pressure (BP) in cross-sectional human studies, there is limited information on the relations of BNP to longitudinal changes in BP and incident hypertension specifically in African Americans.5-11 The Jackson Heart Study (JHS) provides a unique opportunity to pursue this research question. We hypothesized that higher BNP concentrations will be associated positively with longitudinal changes in systolic and diastolic BP and with a greater progression of BP stage and a higher incidence of hypertension in a community-based sample of African Americans.
METHODS
The Jackson Heart Study is a longitudinal, observational cohort established in 2000 in part to prospectively investigate the role of environmental and genetic factors in the development of cardiovascular risk factors in an African American population. The base population was derived from a tri-county area that encompasses Jackson, Mississippi (Hinds County, Madison County and Rankin County).12, 13 5301 participants were recruited for the baseline examination (2000-2004), and 4,203 participants attended the second examination (2005-2008). For the present investigation, participants were excluded if they had hypertension at baseline, prevalent congestive heart failure or myocardial infarction, missing or extreme values (>100 pg/mL) of plasma BNP concentrations, missing BP measures, or a serum creatinine >2.0 mg/dL. Informed consent was obtained and the research protocol was approved by the institutional review board of the University of Mississippi Medical Center, Jackson State University, and Tougaloo College
BP measurements
Both the baseline and second examinations included a complete medical history, physical examination, and blood/urine collections. At each JHS examination, systolic and diastolic BP was measured in the right arm of participants twice using the random-zero BP sphygmomanometer (Hawksley and Sons Limited, Marlborough Road, Lancing, Sussex, BN15 8TN, England). The first BP was obtained after allowing the participant to rest for five minutes in a seated position and a second BP was obtained after waiting one additional minute. The average of the two measurements comprised the examination BP. The same standardized protocol and devices were utilized for the two examinations.
In this study, we assessed three BP outcomes: 1) longitudinal change in systolic and diastolic BP, 2) longitudinal progression (increase) of BP by at least one JNC VI BP categories, and 3) incident hypertension. BP categories considered in the analysis assessing longitudinal BP progression include those from both JNC VI [optimal BP (<120/80 mmHg), normal BP (120-129/80-84 mmHg), high normal BP (130-139/85-89 mmHg) and hypertension (≥140/90 mmHg)] and JNC VII [optimal BP (<120/80 mmHg), prehypertension (120-139/80-89 mmHg), Stage I (140-159/90-99 mmHg) hypertension].
Plasma BNP measurements
Plasma BNP concentrations was measured in the baseline examination of the Jackson Heart Study. Plasma BNP was measured on a Siemens Advia Centaur instrument using a chemiluminescent immunoassay. The lowest detectable plasma BNP concentration was 1.9 pg/mL. The coefficient of variation for the assay measured at three concentrations [(Concentration 1 (mean=48.47 pg/mL), Concentration 2 (mean=472.94 pg/mL) and Concentration 3 (mean=1810.03 pg/mL)] were 4.2%, 3.1% and 3.4% respectively.
Covariates
For this investigation, hypertension was defined as a systolic BP ≥ 140mmHg, a diastolic BP of ≥ 90mmHg, and/or the use of antihypertensive medication. Diabetes was defined as a fasting glucose concentration ≥126 mg/dL or a random glucose concentration ≥200 mg/dL, or a physician diagnosis of diabetes, or the use of oral hypoglycemic medications or insulin. Body mass index (BMI) was defined as the weight in kilograms divided by the height squared (in meters). Current smoking status was defined as yes in participants who had smoked over 400 cigarettes in their lifetime and were actively smoking at the time of the baseline Examination.
Echocardiographic left ventricular (LV) mass was calculated using the American Society of Echocardiography corrected formula described by Devereux et al.:14
In this formula, LVIDD, IVST and PWT are the LV internal diameter measured at end-diastole, the interventricuar septal wall thickness at end-diastole and the posterior wall thickness at end-diastole respectively. To adjust for body size LV mass was index by height2.7.15
Statistical analyses
We performed sex pooled analyses after finding no evidence of a sex × BNP statistical interaction. We also compared the means of all clinical characteristics between samples with and without BP progression and incident hypertension. Because BNP concentration is not normally distributed, we used Wilcoxon Signed-Rank test. Three sets of analyses were performed to determine the association of plasma BNP with longitudinal changes in BP over time. In the first analysis, we investigated the relations of circulating natural logarithmically-transformed BNP to changes in systolic and diastolic BP using generalized additive models implemented in SAS version 9.2 (SAS® Inc., NC). Penalized regression splines were used to demonstrate the overall shape of the relation between log-transformed BNP and continuous BP changes.
In the second analyses, we investigated the relation of circulating log-transformed BNP (continuous) or categorical (quartiles) to BP progression defined as an increase by at least one JNC VI category. In the third analyses, we investigated the relation of circulating log-transformed BNP to incident hypertension. For participants taking BP medications, BP values were imputed by adding 10 mmHg to the systolic BP and 5 mmHg to the diastolic BP.16 We performed Poisson regression with robust error variance for both the second and third analyses.
In all three analyses, we adjusted for covariates known to influence circulating serum BNP as well as BP and BP changes over time including age, sex, BP categories, systolic and diastolic BP, BMI, diabetes mellitus, smoking, heart rate, estimated glomerular filtration rate (eGFR) and LV mass (fully adjusted model). LV mass was placed in the model because plasma BNP is associated positively with LV mass,17 and increased LV mass has been associated with elevated BP.18 Specific for BP progression and incident hypertension analyses we used multiple models with progressive degrees of adjustment (Model 1: age-sex adjusted, Model 2: fully adjusted without SBP or DBP, Model 3: fully adjustment without SBP but with DBP, Model 4: fully adjusted).
Because prior investigators have reported low plasma BNP concentrations in obese hypertensive subjects,19 we examined statistical models incorporating interaction terms (BNP×BMI) to assess effect modification by BMI. In a secondary analysis, we used JNC VII categories (as opposed to JNC VI categories used in the primary analysis) to further investigate the relation of BNP to incident hypertension in those with prehypertension at the baseline examination.
RESULTS
The study sample consisted of 888 participants (mean age 47±12 years, 61% women). The median follow-up period was 5.0±0.8 years. The main characteristics (clinical, biochemical features, blood pressure categories, eGFR and echocardiographic) are summarized in Table 1.
Table 1.
Characteristics of the Study Population by Sex
| Variable | Men (n = 350) |
Women (n = 538) |
Pooled Sample (n =888) |
|---|---|---|---|
| Clinical characteristics | |||
| Age, years | 47±12 | 47±11 | 47±12 |
| Systolic blood pressure, mmHg | 117±10 | 114±11 | 115±11 |
| Delta systolic blood pressure | 6.1±13.5 | 6.8±14.3 | 6.5±14.01 |
| Diastolic blood pressure, mmHg | 77±8 | 74±8 | 76±8 |
| Delta diastolic blood pressure | 2.2±9.6 | 2.6±9.9 | 2.5±9.8 |
| Body Mass Index, kg/m2 | 28.5±4.7 | 30.4±5.7 | 29.7±5.4 |
| Heart Rate, seconds | 32.4±4.5 | 34.4±4.5 | 33.6±4.6 |
| Fasting LDL, mg/dL | 129±37 | 122±34 | 125±35 |
| Fasting HDL, mg/dL | 46±13 | 55±13 | 51 ±13 |
| Total Cholesterol, mg/dL | 195±39 | 194±37 | 194±37 |
| Fasting Triglycerides, mg/dL | 102±61 | 83±48 | 91 ±56 |
| Diabetes, % | 6 | 5 | 5 |
| Current Smokers, % | 16 | 9 | 12 |
| Blood Pressure Categories*, % | |||
| Optimal | 38 | 56 | 50 |
| Normal | 49 | 32 | 38 |
| High Normal | 13 | 12 | 12 |
| Biochemical features | |||
| B-type natriuretic peptide, pg/mL (median ± 75th percentile) |
7.0±8.2 | 9.6±10.5 | 8.6±9.8 |
| eGFR (based on MDRD) | 93.0±13.5 | 91.5±15.9 | 92.1±15.0 |
| Echocardiographic characteristics | |||
| Left ventricular mass, g/m2.7 | 153±32 | 125±27 | 136±32 |
Values are mean ± SD unless otherwise indicated;
Blood Pressure categories, Optimal (Systolic <120 mmHg and diastolic <80 mmHg), Normal (systolic 120-129 mmHg, diastolic 80-84); and High Normal (130 – 139mm Hg and diastolic 8589 mm Hg).
Figures 1 and 2 show plots relating change in systolic BP and change in diastolic BP to baseline log–BNP concentrations after multivariable adjustment, respectively. Test of deviation from linearity showed that plasma BNP was linearly related to both systolic (p = 0.01) and diastolic (p=0.032) BP changes. The spline term (3 degrees of freedom) revealed lack of a non-linear relation between log plasma BNP with systolic (p= 0.20) and diastolic (p= 0.59) BP changes. Overall, log BNP was linearly related to changes in systolic and diastolic BP, thus Poisson regression models were deemed appropriate to estimate the relative risk (RR) of BP progression and incident hypertension described by plasma BNP concentrations.
Figure 1.
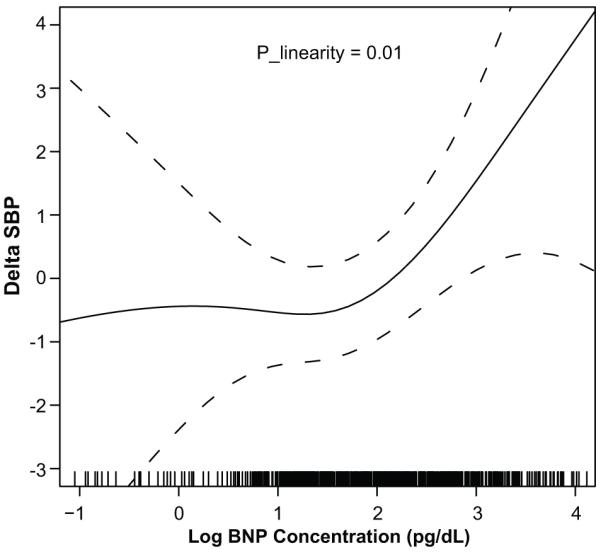
Change in Systolic Blood Pressure by Baseline log B-type Natriuretic Peptide Concentrations after Multivariable Adjustment
Delta SBP is defined as the change in systolic BP between baseline and Exam 2; BNP, B-type natriuretic peptide Plinearity represents the p-value from the test of linearity in the relation between log B-type natriuretic peptide concentration and change in systolic blood pressure after adjusting for age, sex, baseline systolic and diastolic BP, BMI, diabetes status, current smoking, heart rate, eGFR and left ventricular mass. Results suggest a significant linear relation between log B-type natriuretic peptide concentration and change systolic blood pressure.
Figure 2.
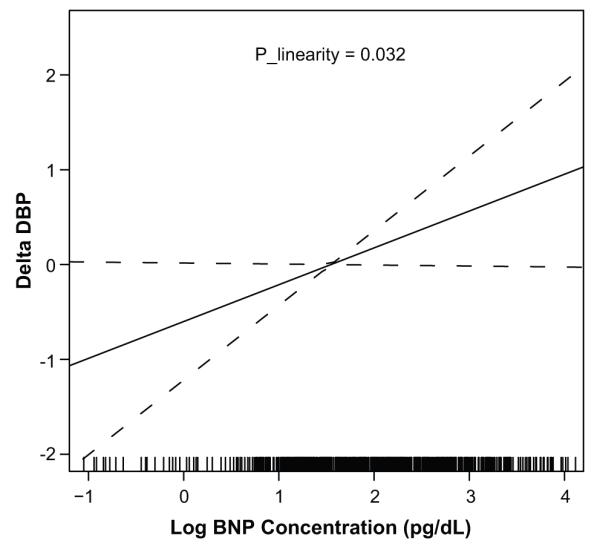
Change in Diastolic Blood Pressure by Baseline log B-type Natriuretic Peptide Concentrations after Multivariable Adjustment
Delta DBP is defined as the change in diastolic BP between baseline and Exam 2; BNP, B-type natriuretic peptide Plinearity represents the p-value from the test of linearity in the relation between log B-type natriuretic peptide concentration and change in diastolic blood pressure. Results suggest a significant linear relation between log B-type natriuretic peptide concentration and change in diastolic blood pressure after adjusting for age, sex, baseline systolic and diastolic BP, BMI, diabetes status, current smoking, heart rate, eGFR and left ventricular mass.
Overall, 36.9% of the participants (36.2% men; 38.0% women) progressed to a higher BP stage and 19.3% (18.2% men; 21.1% in women) developed incident hypertension. The clinical characteristics of those who had BP progression compared to those who did not have BP progression are presented in Table 2. There were no differences in the mean of baseline clinical characteristics or in eGFR; however, there was a significant difference in the median of BNP concentration. The median of BNP was significantly higher in those with BP progression (p=0.0042) than those without BP progression. In Table 3, the relation of log-BNP to change in BP outcomes over the 5-year follow-up period are shown for all four models with increasing levels of adjustment. In the fully adjusted model, baseline log-BNP (p = 0.046) was significantly associated with BP progression. Every SD increase in baseline log BNP was associated with a 12% increased relative risk of BP progression). Baseline log BNP, as a continuous variable, however was not significant associated with incident hypertension (p=0.12; Table 3). Level of adjustment did not affect the significance of the relation between BP progression and log-BNP or between incident hypertension and log-BNP.
Table 2.
Characteristics of the Study Population by Evidence of Blood Pressure Progression between the Baseline and Second Examination
| Clinical Characteristics | Those without Blood Pressure Progression (N= 560) |
Those with Blood Pressure Progression (N=328) |
P-Value |
|---|---|---|---|
| Age | 46.5±12.0 | 47.8±11.0 | 0.0931 |
| Sex, % female | 61.3 | 59.5 | 0.6533 |
| Current Smokers, % | 11.8 | 12.5 | 0.6807 |
| Blood pressure category, % | 0.0158 | ||
| Optimal | 47.7 | 52.4 | |
| Normal | 37.9 | 39.3 | |
| High Normal | 14.4 | 8.3 | |
| Diabetes, % | 5.4 | 5.5 | 0.9934 |
| Baseline systolic blood pressure, mmHg | 114.8±11.7 | 116.3±9.6 | 0.0636 |
| Baseline diastolic blood pressure, mmHg | 75.4±7.9 | 75.7±7.3 | 0.6121 |
| Body mass index, kg/m2 | 29.8±5.3 | 29.5±5.4 | 0.3592 |
| Left ventricular mass, grams | 135.6±32.5 | 136.5±30.2 | 0.7095 |
| eGFR, mg/dL | 92.7±15.5 | 92.0±13.0 | 0.7117 |
| B-type natriuretic peptide, pg/mL (median ± 75th percentile) |
7.9±9.0 | 9.8±10.8 | 0.0042 |
eGFR, estimated glomerular filtration rate; Values are mean ± SD unless otherwise indicated;
Table 3.
Relation of Log B-type Natriuretic Peptide to Blood Pressure Progression and Incident Hypertension Using Multivariable Regression
| Model | Blood Pressure Progression |
Incident Hypertension |
||
|---|---|---|---|---|
| Relative risks (95% CI) | P | Relative risks (95% CI) | P | |
| Age-Sex Adjusted | 1.13 (1.01, 1.26) | 0.039 | 1.09 (0.93, 1.29) | 0.26 |
| Full Model without SBP and DBP | 1.12 (1.00, 1.26) | 0.050 | 1.13 (0.97, 1.32) | 0.12 |
| Full Model with DBP | 1.13 (1.01, 1.28) | 0.041 | 1.14 (0.97, 1.35) | 0.11 |
| Full Model with SBP and DBP | 1.12 (1.00 ,1.26) | 0.046 | 1.13 (0.97, 1.32) | 0.12 |
SBP, systolic blood pressure; DBP, diastolic blood pressure Relative risk for blood pressure progression represents the risks of progressing upward by at least one category of blood pressure based on JNC VI guidelines; Relative risk for incident hypertension represent the risk of developing hypertension based on blood pressure and/or interview in Exam 2 after being normotensive at baseline; The full multivariable model includes the following covariates: age, sex, baseline systolic and diastolic blood pressure, body mass index, diabetes status, current smoking, heart rate, estimate glomerular filtration rate and left ventricular mass.
Table 4 shows the association of BP outcomes with BNP where BNP concentrations are in quartile ranges. In the fully adjusted model, elevated plasma BNP concentrations (highest quartile) were significantly (P=0.008) associated with increased RR of BP progression (RR, 1.39, 95%CI 1.09-1.77) but not incident hypertension (RR 1.18, 95% CI 0.83-1.67, p=0.34). For every quartile increase in plasma BNP concentration, RR of BP progression increased by 12% (p for trend 0.005). Level of adjustment did not affect the significance of the relation of BP progression or incident hypertension to BNP quartiles.
Table 4.
Poisson Regression Analysis Examining the Relation of Brain Natriuretic Peptide Quartiles to Blood Pressure Progression and Incident Hypertension.
| Models | Cases/People at Risk |
Age-Sex Adjusted RR (95%CI) |
P value | Model Without SBP and DBP RR (95%CI) |
P value | Model With DBP, No SBP RR (95%CI) |
P value | Multivariable Adjusted RR (95%CI) |
P value |
|---|---|---|---|---|---|---|---|---|---|
| Blood Pressure Progression |
|||||||||
| Q1 (N=229; 1.9±1.9) | 72/229 | Reference | … | Reference | … | Reference | … | Reference | … |
| Q2 (N=233; 3.6±4.5) | 79/233 | 1.08 (0. 83, 1.40) | 0.56 | 1.03 (0.93, 1.34) | 0.81 | 1.03 (0.79, 1.33) | 0.85 | 1.03 (0.80, 1.34) | 0.80 |
| Q3 (N=221; 8.4±9.8) | 85/221 | 1.21 (0.94, 1.56) | 0.15 | 1.18 (0.91, 1.52) | 0.21 | 1.86 (0.92, 1.53) | 0.19 | 1.17 (0.91, 1.51) | 0.23 |
| Q4 (N=205; 8.0±26.2) | 92/205 | 1.42 (1.11, 1.81) | 0.0058 | 1.40 (1.09, 1.81) | 0.0085 | 1.42 (1.11, 1.83) | 0.0057 | 1.39, (1.09, 1.77) | 0.008 |
| Trend* | … | 1.12 (1.04, 1.22) | 0.0041 | 1.12 (1.04, 1.22) | 0.0054 | 1.13 (1.04, 1.23) | 0.0033 | 1.12 (1.03, 1.21) | 0.005 |
| Incident Hypertension | |||||||||
| Q1 (N=229; 1.9±1.9) | 49/229 | Reference | … | Reference | … | Reference | … | Reference | |
| Q2 (N=233; 3.6±4.5) | 34/233 | 0.68 (0.46, 1.01) | 0.06 | 0.79 (0.53, 1.17) | 0.24 | 0.79 (0.53, 1.16) | 0.23 | 0.81 (0.55, 1.19) | 0.27 |
| Q3 (N=221; 8.4±9.8) | 41/221 | 0.83 (0.57, 1.20) | 0.31 | 0.89 (0.61, 1.30) | 0.55 | 0.90 (0.62, 1.31) | 0.60 | 0.87 (0.60, 1.27) | 0.48 |
| Q4 (N=205; 8.0±26.2) | 48/205 | 1.07 (0.75 , 1.52) | 0.72 | 1.19 (0.83 , 1.70) | 0.33 | 1.22 (0.85, 1.74) | 0.27 | 1.18 (0.83, 1.67) | 0.34 |
| Trend* | … | 1.03 (0.91, 1.17) | 0.61 | 1.06 (0.94, 1.21) | 0.35 | 1.07 (0.94, 1.22) | 0.28 | 1.06 (0.93, 1.20) | 0.38 |
RR represent relative risk; Q1,Q2, Q3 and Q4 represent the first, second, third and fourth quartile of BNP concentrations at baseline; Sample size, N and median ± SD noted in parenthesis for each quartile of BNP concentration; Cases represent those who had progression of BP by at least one category of BP; RR estimates for blood pressure progression represent the risk of progressing upward by at least one category of blood pressure based on JNC VI guidelines; Results from a full model with Systolic BP but without diastolic BP was different; Relative risk estimates for incident hypertension represent the risk of developing hypertension based on blood pressure and/or interview in Exam 2 after being normotensive at baseline; The multivariable model included the following covariates: age, sex, baseline systolic and diastolic BP, body mass index, diabetes status, current smoking, heart rate, estimated glomerular filtration rate and left ventricular mass.
Trend represents increase in risk per BNP quartile.
In a secondary analysis, we used JNC VII categories to evaluate the relation of BNP to incident hypertension with a specific interest to look at those with prehypertension at baseline. Similar to our finding with JNC VI, there was no significant relation between BNP concentrations and incident hypertension in either the group with optimal BP or the group with prehypertension at the baseline exam.
DISCUSSION
Principal Findings
Our results indicate a compelling and graded positive association between BNP concentrations and both longitudinal change in systolic and diastolic BP and BP progression. In a comparison of clinical risk factors and BNP concentrations in individuals with and without BP progression over the five-year follow-up, BNP was significantly associated with BP changes seen. Our findings suggest that plasma BNP may be a precursor of or a response to the development of vascular changes that lead to higher BP and hypertension. BNP has been established as a regulator of cardiovascular hemodynamics since it was first identified in 1981 by de Bold and his colleagues.20 Long-standing hypertension is associated with left ventricular (LV) hypertrophy, fibrosis, and subsequent onset of LV systolic and diastolic dysfunction.21 Since the main stimulus for BNP production is myocyte stretch, it is not surprising that elevated BNP concentrations are typically seen in hypertensive patients.22, 23 Our investigation extends the literature on this biomarker to include its potential value as a predictor of future progression of BP.
B-type Natriuretic Peptide Relation to Longitudinal Blood Pressure
We observed a significant association of BNP concentration with increase in both systolic and diastolic BP and with progression of BP category over an approximate five-year follow-up. There is conflicting evidence for whether higher BNP concentrations are related to high BP.6, 24 There have been some studies that have reported no association and others that have reported lower BNP concentrations in individuals who were hypertensive but also obese.19, 25 Framingham investigators recently identified a relation of BNP concentrations to longitudinal blood pressure tracking in men in their cohort, supporting findings in this investigation.26 They did not find such an association in women. To our knowledge, this is the first study to investigate the relation of BNP to longitudinal changes in BP and to BP progression in a large community based group of African Americans.
One theory that explains the relation of BNP to BP progression is that increased vascular resistance and cardiac stress may lead to an increase in the circulating plasma BNP concentrations antedating the development of the disease state itself.2 Early in the development of hypertension, there is an increase in vascular stiffness. Arterial stiffness is associated with increased LV afterload which may lead to BP progression and eventual development of hypertension.27, 28 BNP is known to lower vascular resistance by a variety of actions including 1) vasodilatation, 2) decrease of the sympathetic tone, and 3) reduction in cardiac preload by shifting the intravascular volume into extra vascular compartment.2 NP reduce the sympathetic tone in the peripheral vasculature by inhibiting the release of catecholamines from autonomic nerve endings and suppression of sympathetic outflow from the central nervous system thereby suppressing the reflex tachycardia and vasoconstriction that accompany the reduction in preload and promoting the lowering of arterialBP.3, 29, 30 Through suppression of renin-angiotensin-aldosterone system and alteration of salt appetite and water intake, natriuretic peptides are also involved in reducing the extracellular fluid volume.4 Some experts suggest that through these multiple hemodynamic mechanisms (in response to increased vascular resistance and pressure overload), there is potential for a rise in circulating plasma BNP concentrations that precedes an increase in BP and the development of hypertension.
Our finding that BNP concentrations are related to longitudinal change in BP (in particular progression of systolic and diastolic BP and BP class) has clinical importance. Individuals in a higher BP class are at a higher risk of developing hypertension.31 In the Framingham Heart Study, investigators found that compared to those with optimal BP (<120/80), those with systolic BP 120-129 mmHg and diastolic BP 80-84 mmHg had a greater incidence of hypertension (5% vs. 17% respectively). Accordingly, those with systolic BP 130-139 mmHg and diastolic 85-90 mmHg had yet a higher risk (37%) compared to those with optimal BP.31 Studies have shown that those with prehypertension have as high as a 2.0 fold higher risk of adverse cardiovascular disease outcomes compared to those with optimal BP).32 Relevant to our study involving African Americans, in the REGARDS study, this population had higher rates of prehypertension and prehypertension was significantly related to microalbuminuria and chronic kidney disease in addition to cardiovascular disease.33 For the study sample in the current study, the rates of cardiovascular outcomes were too low over the five-year follow-up to determine the RR of outcome in those with BP progression compared to those without BP progression (N= 7, N=5, N=5 for CHD, stroke and congestive heart failure respectively).
In this investigation, there was no significant relation between BNP and incident hypertension. Current literature supports the notion that NP concentration varies in occult hypertension.6, 26 In one study that evaluated concentrations of circulating molecular forms of BNP (BNP32 and NT-proBNP) in individuals with mild, moderate and severe hypertension,34 investigators found that compared to those with normal BP, concentrations of molecular forms of BNP were either not elevated or lower than that of age- and sex-matched controls with mild hypertension. However in those with moderate and severe hypertension, BNP concentrations were higher. One explanation for potential lower concentrations with mild hypertension could be impairment of the NP system in the early phase of hypertension and a need for a particular threshold to be met early on in hypertension before activation of the NP system occurs in the early phase of the disease.
Limitations and Strengths
One limitation of the current investigation is that change in BP was assessed by comparing BP at two single visits (at the baseline examination and time of the second examination). It is unclear how serial BP assessments between the examinations may affect our results. Another limitation is that BNP was measured only at baseline; BNP concentration at follow up was unknown. Thus investigators could not account for the change in BNP in assessing the relation of BNP to change in BP. We excluded those with hypertension at baseline therefore at baseline none of the participants in the study sample were on BP medication; however, at follow-up a portion of those with hypertension were on BP medication and imputation was used to adjust for the effect of BP medication. Tobin et al. tested multiple analytical models to adjust for the use of BP medication. Investigators showed that imputing the systolic BP and diastolic BP by a sensible constant was the among the better models to offset the influence of medication with the technique performing well both in simulated and real data sets
In this investigation, the study sample was composed completely of African Americans thus allowing the assessment of a large underrepresented population known to have higher rates of hypertension and hypertensive heart disease compared to other ethnic groups. Though the cohort used represents a strength of this study, the results may not be generalizable to other ethnic populations. A unique strength of this study is that data was prospectively collected using standardized methods for BNP measurement at baseline and assessment of BP and covariates data at baseline and follow-up examination.
PERSPECTIVES
The prevalence of hypertension in African Americans is among the highest in the world, and is reported to be increasing. Between 1988–1994 and 1999–2002, the prevalence of hypertension in adults increased from 35.8% to 41.4% in African Americans. The prevalence among whites has also increased; however, the rates have been substantially lower (24.3% to 28.1%).35, 36 Cardiovascular sequelae from long-standing hypertension (as well as prehypertension) are much more profound in African Americans.37, 38 Identifying novel markers for early detection of those at risk for BP progression may potentially lead to improved prevention, risk stratification and lower cardiovascular events in this high risk population. This study suggests that BNP concentrations may become elevated early in the development of hypertensive disease in a community of African Americans. Further investigation is warranted to better understand the biological mechanism(s) explaining this relation and the potential use of this biomarker in the clinical setting as it relates to BP progression.
CONCLUSION
In this study of a community-based cohort of middle-aged African Americans, baseline circulating plasma BNP concentration predicted an increase in systolic BP, diastolic BP and in the progression of BP category over a five-year follow-up period. There was no significant relation of plasma BNP concentration to incident hypertension over the follow up period.
Novelty and Significance: 1) What Is New, 2) What Is Relevant?
What Is New?
Brain natriuretic peptide concentration is related to an increase in systolic and diastolic blood pressure in African Americans over a five year period.
Brain natriuretic peptide concentration is related to progression of blood pressure categories in African Americans over a five year period.
What Is Relevant?
Over a median follow-up period of 5 years, 36.9% of African Americans progressed to a higher BP stage and 19.3% developed hypertension.
Though brain natriuretic peptide concentration is related to increase in systolic and diastolic blood pressure and in blood progression, they are not related to incident hypertension in African Americans.
Acknowledgments
SOURCES OF FUNDING
The Jackson Heart Study is supported by NIH contracts N01-HC-95170, N01-HC-95171, and N01-HC-95172, HL076784 provided by the National Heart, Lung, and Blood Institute and the National Center for Minority Health and Health Disparities and AG028321 provided by the National Institute of Aging. This study was partially supported by PHS Award UL1 RR025008 from the Clinical and Translational Science Award program, National Institutes of Health, National Center for Research Resources (NCRR) to one of the authors (A.B.)
Abbreviations
- BMI
- BNP
- BP
- CV
Footnotes
DISCLOSURES
None
This is a PDF file of an unedited manuscript that has been accepted for publication. As a service to our customers we are providing this early version of the manuscript. The manuscript will undergo copyediting, typesetting, and review of the resulting proof before it is published in its final citable form. Please note that during the production process errors may be discovered which could affect the content, and all legal disclaimers that apply to the journal pertain.
References
- (1).Houben AJ, van der ZK, de Leeuw PW. Vascular and renal actions of brain natriuretic peptide in man: physiology and pharmacology. Fundam Clin Pharmacol. 2005;19:411–419. doi: 10.1111/j.1472-8206.2005.00336.x. [DOI] [PubMed] [Google Scholar]
- (2).Levin ER, Gardner DG, Samson WK. Natriuretic peptides. N Engl J Med. 1998;339:321–328. doi: 10.1056/NEJM199807303390507. [DOI] [PubMed] [Google Scholar]
- (3).Richards AM. Natriuretic peptides: update on Peptide release, bioactivity, and clinical use. Hypertension. 2007;50:25–30. doi: 10.1161/HYPERTENSIONAHA.106.069153. [DOI] [PubMed] [Google Scholar]
- (4).Kuroski de Bold ML. Atrial natriuretic factor and brain natriuretic peptide gene expression in the spontaneous hypertensive rat during postnatal development. Am J Hypertens. 1998;11:1006–1018. doi: 10.1016/s0895-7061(98)00116-2. [DOI] [PubMed] [Google Scholar]
- (5).Sagnella GA. Measurement and significance of circulating natriuretic peptides in cardiovascular disease. Clin Sci (Lond) 1998;95:519–529. doi: 10.1042/cs0950519. [DOI] [PubMed] [Google Scholar]
- (6).Buckley MG, Markandu ND, Miller MA, Sagnella GA, MacGregor GA. Plasma concentrations and comparisons of brain and atrial natriuretic peptide in normal subjects and in patients with essential hypertension. J Hum Hypertens. 1993;7:245–250. [PubMed] [Google Scholar]
- (7).Kohno M, Horio T, Yokokawa K, Murakawa K, Yasunari K, Akioka K, Tahara A, Toda I, Takeuchi K, Kurihara N. Brain natriuretic peptide as a cardiac hormone in essential hypertension. Am J Med. 1992;92:29–34. doi: 10.1016/0002-9343(92)90011-y. [DOI] [PubMed] [Google Scholar]
- (8).Nakamura T, Ichikawa S, Sakamaki T, Fujie M, Yagi A, Kurashina T, Murata K. Plasma levels of atrial natriuretic peptide in patients with borderline and essential hypertension. Tohoku J Exp Med. 1988;154:205–213. doi: 10.1620/tjem.154.205. [DOI] [PubMed] [Google Scholar]
- (9).Wambach G, Gotz S, Suckau G, Bonner G, Kaufmann W. Plasma levels of atrial natriuretic peptide are raised in essential hypertension during low and high sodium intake. Klin Wochenschr. 1987;65:232–237. doi: 10.1007/BF01715853. [DOI] [PubMed] [Google Scholar]
- (10).Montorsi P, Tonolo G, Polonia J, Hepburn D, Richards AM. Correlates of plasma atrial natriuretic factor in health and hypertension. Hypertension. 1987;10:570–576. doi: 10.1161/01.hyp.10.6.570. [DOI] [PubMed] [Google Scholar]
- (11).Nishikimi T, Yoshihara F, Morimoto A, Ishikawa K, Ishimitsu T, Saito Y, Kangawa K, Matsuo H, Omae T, Matsuoka H. Relationship between left ventricular geometry and natriuretic peptide levels in essential hypertension. Hypertension. 1996;28:22–30. doi: 10.1161/01.hyp.28.1.22. [DOI] [PubMed] [Google Scholar]
- (12).Taylor HA., Jr Establishing a foundation for cardiovascular disease research in an African-American community--the Jackson Heart Study. Ethn Dis. 2003;13:411–413. [PubMed] [Google Scholar]
- (13).Fuqua SR, Wyatt SB, Andrew ME, Sarpong DF, Henderson FR, Cunningham MF, Taylor HA., Jr Recruiting African-American research participation in the Jackson Heart Study: methods, response rates, and sample description. Ethn Dis. 2005;15:S6–29. [PubMed] [Google Scholar]
- (14).Devereux RB, Alonso DR, Lutas EM, Gottlieb GJ, Campo E, Sachs I, Reichek N. Echocardiographic assessment of left ventricular hypertrophy: comparison to necropsy findings. Am J Cardiol. 1986;57:450–458. doi: 10.1016/0002-9149(86)90771-x. [DOI] [PubMed] [Google Scholar]
- (15).de SG, Daniels SR, Devereux RB, Meyer RA, Roman MJ, de DO, Alderman MH. Left ventricular mass and body size in normotensive children and adults: assessment of allometric relations and impact of overweight. J Am Coll Cardiol. 1992;20:1251–1260. doi: 10.1016/0735-1097(92)90385-z. [DOI] [PubMed] [Google Scholar]
- (16).Tobin MD, Sheehan NA, Scurrah KJ, Burton PR. Adjusting for treatment effects in studies of quantitative traits: antihypertensive therapy and systolic blood pressure. Stat Med. 2005;24:2911–2935. doi: 10.1002/sim.2165. [DOI] [PubMed] [Google Scholar]
- (17).Park SJ, Cho KI, Jung SJ, Choi SW, Choi JW, Lee DW, Lee HG, Kim TI. N-terminal pro-B-type natriuretic Peptide in overweight and obese patients with and without diabetes: an analysis based on body mass index and left ventricular geometry. Korean Circ J. 2009;39:538–544. doi: 10.4070/kcj.2009.39.12.538. [DOI] [PMC free article] [PubMed] [Google Scholar]
- (18).Post WS, Larson MG, Levy D. Hemodynamic predictors of incident hypertension. The Framingham Heart Study. Hypertension. 1994;24:585–590. doi: 10.1161/01.hyp.24.5.585. [DOI] [PubMed] [Google Scholar]
- (19).Wang TJ, Larson MG, Levy D, Benjamin EJ, Leip EP, Wilson PW, Vasan RS. Impact of obesity on plasma natriuretic peptide levels. Circulation. 2004;109:594–600. doi: 10.1161/01.CIR.0000112582.16683.EA. [DOI] [PubMed] [Google Scholar]
- (20).de Bold AJ, Borenstein HB, Veress AT, Sonnenberg H. A rapid and potent natriuretic response to intravenous injection of atrial myocardial extract in rats. Life Sci. 1981;28:89–94. doi: 10.1016/0024-3205(81)90370-2. [DOI] [PubMed] [Google Scholar]
- (21).Latini R, Masson S, de AN, Anand I. Role of brain natriuretic peptide in the diagnosis and management of heart failure: current concepts. J Card Fail. 2002;8:288–299. doi: 10.1054/jcaf.2002.0805288. [DOI] [PubMed] [Google Scholar]
- (22).Hirata Y, Matsumoto A, Aoyagi T, Yamaoki K, Komuro I, Suzuki T, Ashida T, Sugiyama T, Hada Y, Kuwajima I, Nishinaga M, Akioka H, Nakajima O, Nagai R, Yazaki Y. Measurement of plasma brain natriuretic peptide level as a guide for cardiac overload. Cardiovasc Res. 2001;51:585–591. doi: 10.1016/s0008-6363(01)00320-0. [DOI] [PubMed] [Google Scholar]
- (23).Ogawa T, Linz W, Stevenson M, Bruneau BG, Kuroski de Bold ML, Chen JH, Eid H, Scholkens BA, de Bold AJ. Evidence for load-dependent and load-independent determinants of cardiac natriuretic peptide production. Circulation. 1996;93:2059–2067. doi: 10.1161/01.cir.93.11.2059. [DOI] [PubMed] [Google Scholar]
- (24).Flickinger AL, Burnett JC, Jr., Turner ST. Atrial natriuretic peptide and blood pressure in a population-based sample. Mayo Clin Proc. 1995;70:932–938. doi: 10.4065/70.10.932. [DOI] [PubMed] [Google Scholar]
- (25).ssi-Fulgheri P, Sarzani R, Rappelli A. The natriuretic peptide system in obesity-related hypertension: new pathophysiological aspects. J Nephrol. 1998;11:296–299. [PubMed] [Google Scholar]
- (26).Freitag MH, Larson MG, Levy D, Benjamin EJ, Wang TJ, Leip EP, Wilson PW, Vasan RS. Plasma brain natriuretic peptide levels and blood pressure tracking in the Framingham Heart Study. Hypertension. 2003;41:978–983. doi: 10.1161/01.HYP.0000061116.20490.8D. [DOI] [PubMed] [Google Scholar]
- (27).Nichols WW, Denardo SJ, Wilkinson IB, McEniery CM, Cockcroft J, O’Rourke MF. Effects of arterial stiffness, pulse wave velocity, and wave reflections on the central aortic pressure waveform. J Clin Hypertens (Greenwich) 2008;10:295–303. doi: 10.1111/j.1751-7176.2008.04746.x. [DOI] [PMC free article] [PubMed] [Google Scholar]
- (28).Mitchell GF. Effects of central arterial aging on the structure and function of the peripheral vasculature: implications for end-organ damage. J Appl Physiol. 2008;105:1652–1660. doi: 10.1152/japplphysiol.90549.2008. [DOI] [PMC free article] [PubMed] [Google Scholar]
- (29).Jakubik P, Janota T, Widimsky J, Jr., Zelinka T, Strauch B, Petrak O, Benakova H, Bezdickova D, Wichterle D, Zima T, Hradec J. Impact of essential hypertension and primary aldosteronism on plasma brain natriuretic peptide concentration. Blood Press. 2006;15:302–307. doi: 10.1080/08037050601037760. [DOI] [PubMed] [Google Scholar]
- (30).Kato J, Etoh T, Kitamura K, Eto T. Atrial and brain natriuretic peptides as markers of cardiac load and volume retention in primary aldosteronism. Am J Hypertens. 2005;18:354–357. doi: 10.1016/j.amjhyper.2004.09.016. [DOI] [PubMed] [Google Scholar]
- (31).Vasan RS, Larson MG, Leip EP, Kannel WB, Levy D. Assessment of frequency of progression to hypertension in non-hypertensive participants in the Framingham Heart Study: a cohort study. Lancet. 2001;358:1682–1686. doi: 10.1016/S0140-6736(01)06710-1. [DOI] [PubMed] [Google Scholar]
- (32).Lloyd-Jones DM, Evans JC, Levy D. Hypertension in adults across the age spectrum: current outcomes and control in the community. JAMA. 2005;294:466–472. doi: 10.1001/jama.294.4.466. [DOI] [PubMed] [Google Scholar]
- (33).Glasser SP, Judd S, Basile J, Lackland D, Halanych J, Cushman M, Prineas R, Howard V, Howard G. Prehypertension, racial prevalence and its association with risk factors: Analysis of the REasons for Geographic And Racial Differences in Stroke (REGARDS) study. Am J Hypertens. 2011;24:194–199. doi: 10.1038/ajh.2010.204. [DOI] [PMC free article] [PubMed] [Google Scholar]
- (34).Belluardo P, Cataliotti A, Bonaiuto L, Giuffre E, Maugeri E, Noto P, Orlando G, Raspa G, Piazza B, Babuin L, Chen HH, Martin FL, McKie PM, Heublein DM, Burnett JC, Jr., Malatino LS. Lack of activation of molecular forms of the BNP system in human grade 1 hypertension and relationship to cardiac hypertrophy. Am J Physiol Heart Circ Physiol. 2006;291:H1529–H1535. doi: 10.1152/ajpheart.00107.2006. [DOI] [PubMed] [Google Scholar]
- (35).Friedewald VE, Nesbitt SD, Ram CV, Roberts WC. The editor’s roundtable: Hypertension in African Americans and other non-Caucasian ethnic groups. Am J Cardiol. 2010;106:1466–1472. doi: 10.1016/j.amjcard.2010.06.007. [DOI] [PubMed] [Google Scholar]
- (36).Fiscella K, Holt K. Racial disparity in hypertension control: tallying the death toll. Ann Fam Med. 2008;6:497–502. doi: 10.1370/afm.873. [DOI] [PMC free article] [PubMed] [Google Scholar]
- (37).Wei P, Milbauer LC, Enenstein J, Nguyen J, Pan W, Hebbel RP. Differential endothelial cell gene expression by African Americans versus Caucasian Americans: a possible contribution to health disparity in vascular disease and cancer. BMC Med. 2011;9:2. doi: 10.1186/1741-7015-9-2. [DOI] [PMC free article] [PubMed] [Google Scholar]
- (38).Howard G, Prineas R, Moy C, Cushman M, Kellum M, Temple E, Graham A, Howard V. Racial and geographic differences in awareness, treatment, and control of hypertension: the REasons for Geographic And Racial Differences in Stroke study. Stroke. 2006;37:1171–1178. doi: 10.1161/01.STR.0000217222.09978.ce. [DOI] [PubMed] [Google Scholar]