Abstract
Recent developments in high field MRI have provided opportunities to detect iron in human brain with much improved sensitivity. The combination of increased magnetic field strength with multi-channel detectors has made it possible to routinely obtain images at about 300 micron resolution. These images can be sensitized to tissue iron by exploiting the improved magnetic susceptibility contrast at high field. Together, these techniques have the potential to map the fine scale distribution of iron in human brain at the level of fiber bundles and cortical laminae, and may aid in the understanding of the role and transport of iron in normal brain and in disease. In this chapter, we will look at these techniques in detail and present some examples of high field MRI data of human brain.
Keywords: iron, ferritin, MRI, brain, magnetic susceptibility
Introduction
Cellular iron has important roles in brain development and function, and abnormal concentrations may lead to pathological conditions (1–3). Since the beginning of MRI, attempts have been made to map in-vivo brain iron distributions under normal and pathological conditions (4–6). MRI is a versatile technique that is able to generate a variety of contrasts, a number of which reflect tissue iron content. For example, iron can affect MRI signal through several of its major contrast parameters, including T1, T2, and T2* (6). All of these have been used to study brain iron, and each has its advantages and disadvantages.
The recent proliferation of high field scanners of 7 Tesla and above has reinvigorated the study of brain iron with MRI. Major factors in this have been the increased sensitivity (signal-to-noise ratio, or SNR) available with the new scanners, in particular when employing magnetic susceptibility contrast. This increased sensitivity is due to the paramagnetic properties of iron in most of its forms that are present in brain. Magnetic susceptibility contrast is reflected in T2* and resonance frequency, both of which may contribute information about tissue iron content (6–8).
In the following we will discuss some of the methodological aspects of high field iron MRI, including the equipment and acquisition techniques involved, as well as the analysis and interpretation of the data.
2. Materials
2.1 MRI hardware
Magnets
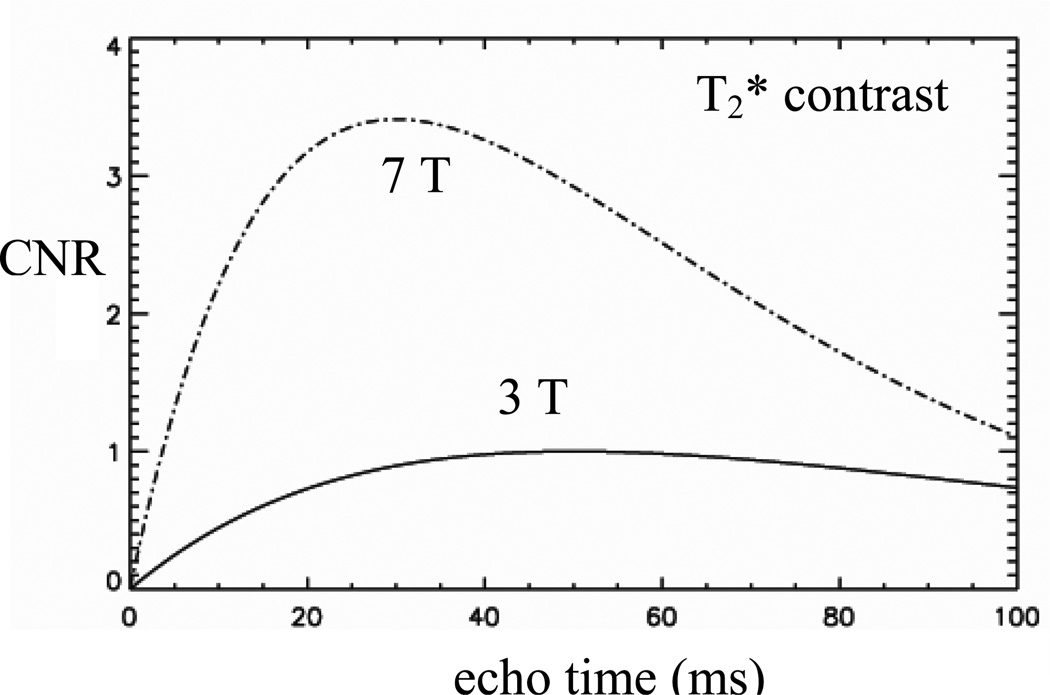
Advances in magnet technology have led to the availability of stronger magnets and higher sensitivity for human MRI. While early clinical MRI systems employed magnets of 1 T field strength or below, today’s scanners are at 1.5 T and 3.0 T, and even 7.0 T. Field strengths continue to increase, and currently experimental 9.4T and 11.7T systems are in use or being developed. The increased sensitivity of these systems can be exploited to improve spatial resolution. In addition, magnetic susceptibility contrast is increased, providing particular advantages for the detection of iron. These increases are dependent on the echo time (see Methods) and, for typical conditions are around 3-fold for both T2* resonance frequency contrast (Figure 1).
Figure 1.
Simulated contrast-to-noise ratio (CNR) for susceptibility-weighted MRI at 3 T and 7 T. The CNR gain at high field is dependent of echo time and ranges from 2–4 for echo time in the commonly used range of 10–60 ms. The simulation ignored T1 effects and assumed identical acquisition bandwidth, a linear sensitivity increase with field strength, and tissue R2* values of 20−1 and 30 s−1 at 3 T and 7 T respectively.
RF detectors
An additional increase in sensitivity has come from the development of multi-channel detectors that has played out over the last decade. Multi-channel detectors allow the individual detector elements to be placed closer to the object under study and at the same time limit the noise received from the sample. Together, these advantages result in sensitivity improvements that can average around 2–3 fold over the brain for 32 channel detectors that are currently widely available. A second advantage of multi-channel detectors is the fact that they enable image acceleration through parallel imaging techniques (9, 10). This is a particularly useful feature to achieve high resolution at high field, which requires more data to be acquired and therefore longer scan times.
Respiratory Compensation
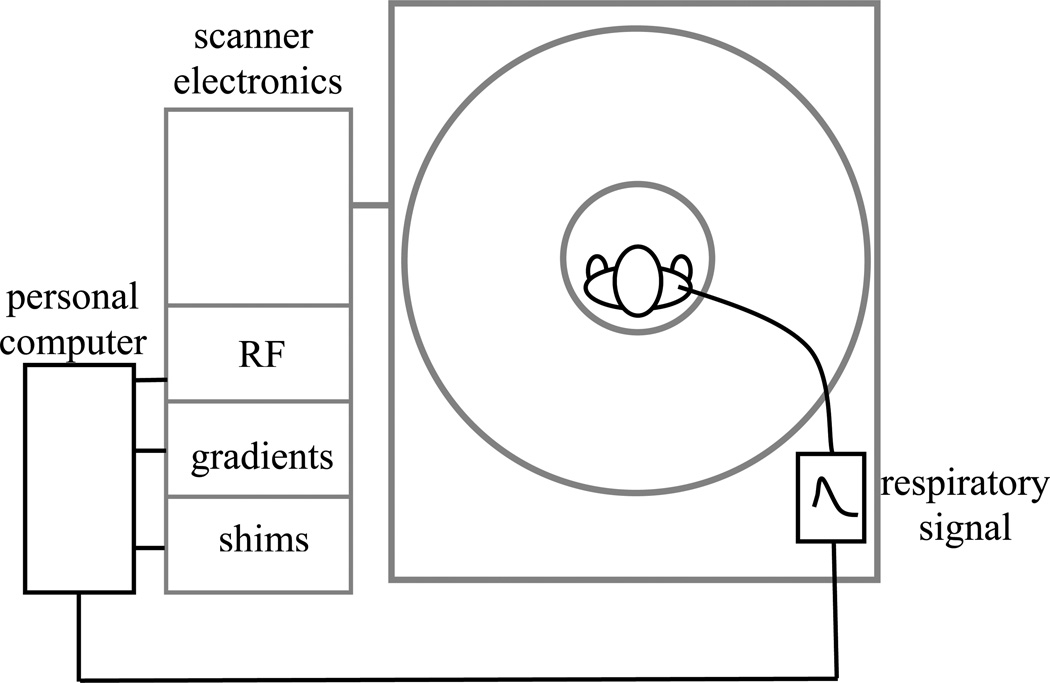
These sensitivity increases at high field come with an increased sensitivity to physiological variations and motion that can compromise image quality. In order to fully exploit the potential benefits of high field MRI, these unwanted confounds need to be dealt with. For example, the respiratory cycle can induce subtle magnetic field fluctuations in the brain that lead to ghosting artifacts (11). This is particularly noticeable at high field as the amplitude of these fluctuations increases linearly with field strength. Currently, prototype hardware exists to compensate for these field fluctuations and improve image quality (Fig. 2). Major component are a pressure belt to register chest motion, a computer to calculate field (shim) corrections, and shim coils driven with fast current sources to allow rapid field adjustments.
Figure 2.
Compensation of respiration-induced magnetic field fluctuations. The patients chest position, registered with a stretch sensor placed around the chest, is used to estimate adjustments to RF frequency, magnetic field gradients, and magnet field shims. This is done with a personal computer, which sends the adjustment values to the MRI system electronics.
Head motion correction
Sudden or even slow head motion during MRI scanning can compromise image quality in particular when scanning at high resolution. A number of techniques have been proposed to compensate for this motion (12–15). Recent implementations employ video cameras to track head motion and feed this information back to the scanner to make adjustments to the image acquisition process (14, 15). An alternative approach measures the local, position dependent magnetic field induced by the MRI gradient system through the use of small coils placed around the head (16). Although these techniques are quite effective, they have not been fully developed yet for widespread use.
3. Methods
3.1 Acquisition Methods
Magnetic susceptibility inclusions in brain tissues, for example local areas of increased iron content, lead to magnetic field shifts that are generally inhomogeneous over the scale of an image voxel. This results in incoherent phase accumulation and therefore to T2* reduction and signal loss in gradient echo imaging (GRE). In addition, these inclusions may lead to a net frequency shift of the voxel-averaged signal, which manifest itself as a voxel phase shift. This effect has been recently exploited at 7T to improve visualization of subtle anatomical variations in grey and white matter of human brain (8).
Resolution
The choice of image resolution is important as it directly affects scan times and image quality. Too low a resolution may lead to partial volume effects and affect the conspicuity of small anatomical variations. Too high a resolution may increase the sensitivity to patient motion and lead to low signal-to-noise ratio (SNR). This SNR can only partially be recovered with spatial averaging during image reconstruction. Using 32 channel detectors at 7T, image resolutions of 0.2×0.2 ×1 or 0.3×0.3×0.3 mm are feasible within scan times of about 10 minutes.
Echo Time and Bandwidth
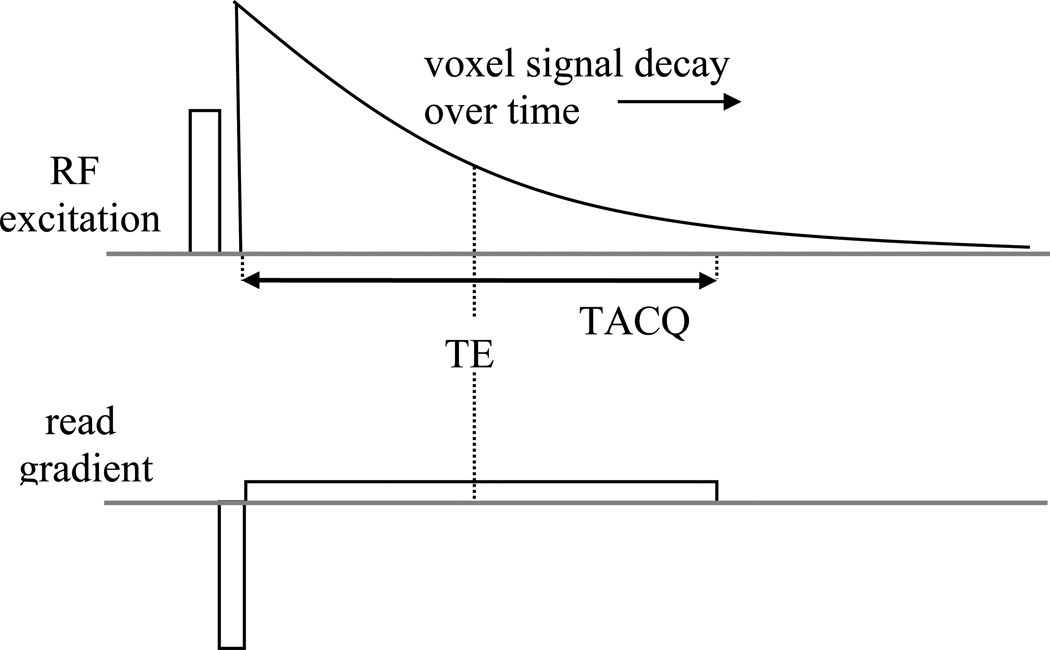
In choosing optimal echo time (TE) and bandwidth, one needs to take into account the contrast-to-noise ratio (CNR). While increasing echo time (TE) leads to increased percentage signal loss and absolute frequency shift, it also reduces image SNR. It turns out that one can optimize the CNR of both signal amplitude and phase by choosing TE equal to the average T2* values of the brain structures involved (8). At 7T, this means TE needs to be chosen in the range of 10–30 ms, which covers much of the range of T2* values found in (normal) human brain. Further, CNR optimization requires minimization of the acquisition bandwidth, i.e. capture as much of the signal decay curve by maximizing the duration of the data acquisition window (TACQ) (Fig. 3). One caveat with this is that increasing TACQ increases image blurring and off-resonance related pixel shifts, some of which can be corrected in post-processing. Typical TACQ values at 7T range from 10–30 ms.
Figure 3.
Optimization of sensitivity (SNR). Maximum SNR is obtained when the acquisition duration (TACQ) is maximized. As TACQ is generally centered around the gradient echo time (TE), TACQ < 2*TE.
Multi-Slice 2D versus 3D Techniques
GRE MRI can be performed either in a multi-slice or true 3D fashion. The latter may have a significant SNR advantage if a large area of interest (or the entire brain) needs to be imaged. 3D techniques excite the entire slab of interest with each RF pulse rather than sub-sections in a sequential fashion. The SNR advantage comes about when the time to run through all the sub-sections in a multi-slice scan exceeds the longitudinal relaxation time of the tissue. Under this condition, multi-slice techniques become rather inefficient (in term of SNR per square root of total scan time) compared to true 3D techniques. A caveat with 3D techniques is that the generated MRI signal may have a larger dynamic range and therefore put increased demands on the MRI acquisition hardware.
Image Acceleration with Parallel Imaging
Higher resolution MRI requires the acquisition of large data matrices, leading to long scan times. A typical 20-slice high resolution 2D acquisition with image matrix of 1024×768 requires 15360 repeated RF excitations. With T2* of up to 30 ms, most of the signal decay curve can be sampled in about 50 ms. Assuming each repeated excitation to last 50 ms, the scan time for the entire acquisition would be close to 13 minutes. Increasing volume coverage beyond the 20 slice- example given above may lead to prohibitively long scan times, necessitating the use of image acceleration approaches such as Parallel Imaging (PI). Methods such as SENSE (10) and SMASH (17) allow some of the acquisition matrix element to be estimated from the spatial information contained in the sensitivity profiles of the detector elements. The saving in acquisition time resulting from this is ultimately limited by the number of detector elements. With 32-channel detectors and acceleration in one dimension, acceleration rates of 3–4 (i.e. scan time reduction of 75–80%) are feasible without significant degradation of image quality.
Multi-Echo Techniques
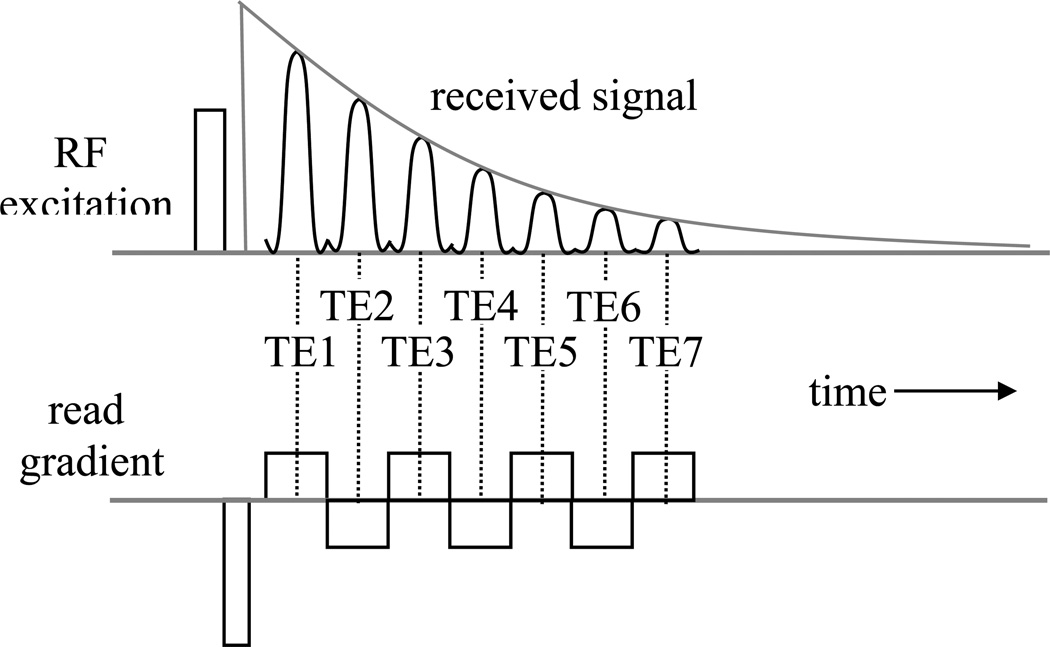
The image intensity in GRE MRI data is not only dependent on tissue T2* values but also on other MR parameters such as spin density and T1, and sequence parameters such as TR and flip angle. This complicates derivation of quantitative and reproducible measures. To overcome this, one can acquire multiple sequential echoes, each of which can be reconstructed in a separate image. The varying T2* weighting of each image can be used to extract quantitative T2* values. The generation of multiple echoes can be effectuated by repeated reversal of the read gradient (Fig. 4).
Figure 4.
Multi-echo acquisition. Multiple reversals of the read gradient are used to generate a number of echo signals with increasing T2*-weighting.
The added benefit of the multi-echo approach is that each echo is acquired in a shorter time (higher bandwidth) and therefore is less affected by off-resonance artifacts and T2* blurring (18). Furthermore, there is no significant SNR penalty in doing this as the multiple echo data can be recombined in a single image with a similar SNR as the low bandwidth T2* weighted image of the conventional single echo approach.
Drawbacks are the increased stress on the gradient system, the increased acoustic noise, and the increased sensitivity to motion. The latter originates from the fact that it becomes more difficult (and less efficient) to employ motion compensation strategies that rely on gradient moment nulling (19).
3.2 Reconstruction methods
A number of processing steps are required to convert the raw data into interpretable images that can provide a measure of iron content. These include combining of the coil signals with or without parallel imaging reconstruction, and calculation of frequency (or phase) maps. Addition steps can include the calculation of magnetic susceptibility and T2* maps. We will discuss each of these briefly.
Coil Combining
Combination of coil signals can be performed with the standard SENSE reconstruction as described previously (20). This is appropriate for both standard non-accelerated acquisitions (R=1), and accelerated acquisitions (R>1). It may be beneficial to use subject specific coil sensitivity data, which can be used to generate the required coil sensitivity reference maps (20). For this purpose, a fast, low resolution scan can be performed using the same slice locations as the high resolution data. Preferably, a scan with minimal T2* contrast is used. This can be achieved by using short TE.
Calculation of Frequency Maps
The complex image data generated with the SENSE reconstruction can be converted into both magnitude (i.e. signal amplitude) and phase maps, both of which are sensitive to tissue iron content. The phase maps are then further processed to remove unwanted spatial variations associated with large-scale bulk susceptibility effects at e.g. air-tissue interfaces. This can be effectively achieved with spatial high pass filtering through homodyne methods or polynomial fitting (8, 21, 22). These methods also allow convenient removal of any phase jumps (at boundaries of the [–π, π] phase range) that may be present in the raw data.
The remaining signal phase can be attributed to off-resonance effects that reflect the underlying tissue properties, including the local iron content. The amplitude of this effect (in Hertz) can be calculated by dividing the local phase shift (in cycles) by the echo time (in seconds).
Susceptibility maps
Although phase/frequency images have used to directly estimate local iron content (7), one caveat is that the two are only indirectly related. One important confound is that local resonance frequency is dependent in a complicated manner on geometry and orientation of both local and surrounding distribution of iron inclusions (6, 23, 24). A number of research groups are addressing this problem and are attempting to reconstruct susceptibility maps from 3D phase distributions (25–28). The former would not be dependent on orientation and geometry and more directly represent the local tissue geometry.
Preliminary experience in brain suggest that susceptibility calculation is indeed possible (28); however, there are still unresolved issues that impact the quality of the susceptibility maps. These issues include the presence of streaking artifacts due to focal areas of ill defined phase (e.g. in vessels or near air-tissue interfaces) and noise amplification for structures that are at the magic angle relative to the main magnetic field (28). It is anticipated that these issues will be resolved, at least partly, in coming years.
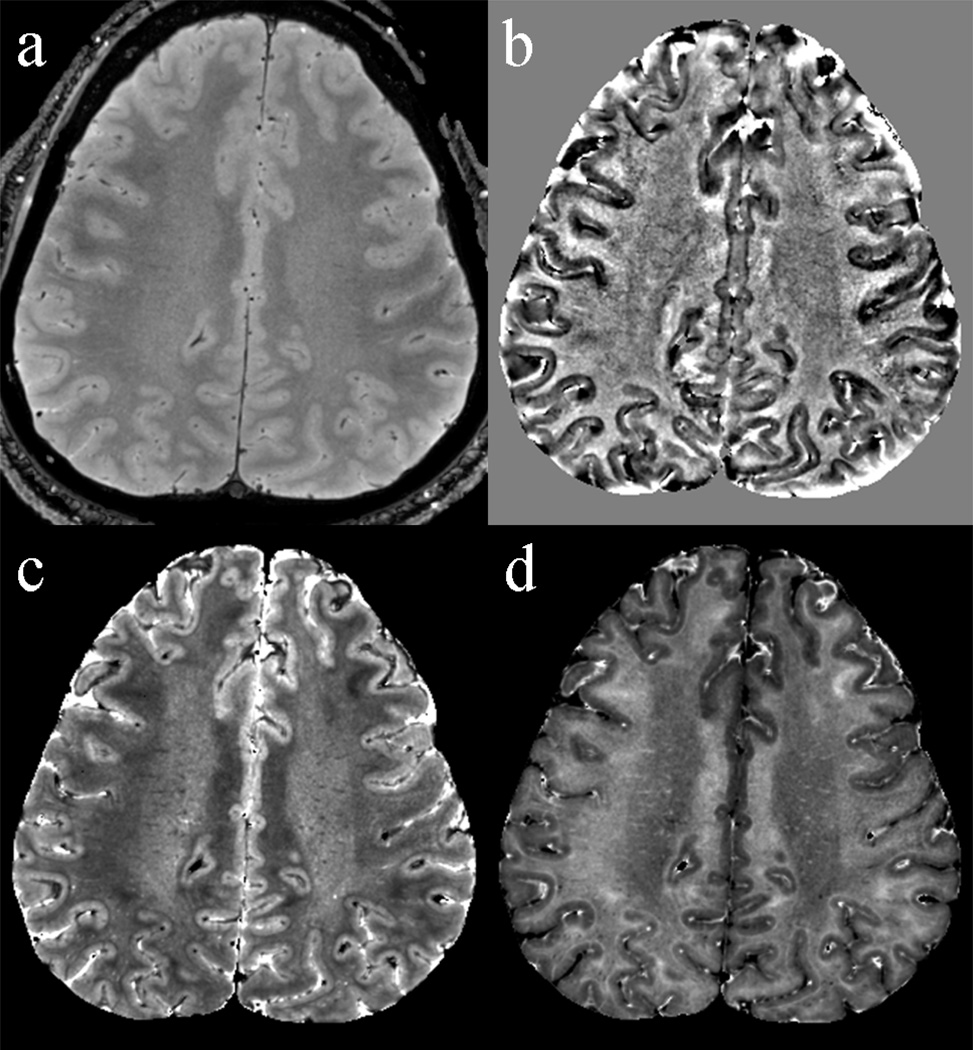
The data available with multi-echo techniques allows calculation of quantitative T2* values (or R2* values; R2* = 1/T2*), which may supplement susceptibility information for the study of brain iron content. T2* values can be derived for multi-echo data by simple T2* fitting of the signal decay with increasing echo time. When both positive and negative echoes in a GRE echo train are used, correction of off-resonance related distortions may be required prior to fitting. This can be done based on Bo maps that can be derived from the phase data. Sample R2* and T2* maps are shown in Fig. 5.
Figure 5.
Example of various contrast that can be derived from a multi-echo data acquisition. Shown are magnitude signal of the first echo (primarily proton-density weighted) (a), frequency (b), T2* (c), and R2* (d).
3.3 Data Interpretation
Although it has been over two decades since the first MRI study of brain iron distribution, the development of a quantitative method to estimate brain iron content from MRI-derived measures is still a work in progress. The primary reason for this is that MRI contrast mechanisms are generally complex, and this is certainly the case for the phase shifts and T2* values derived from GRE data at high field.
For example, the T2* relaxation caused by intra-voxel phase dispersion may originate from a number of sources in addition to iron, including exchange effects with amide protons (29), and inhomogeneous fields generated by susceptibility inclusions such as proteins, myelin, and deoxyhemoglobin (8, 30, 31). These effects may have a geometry and an orientation dependence. This is also the case for MRI frequency maps, which are affected by many of the same contributors.
Nevertheless, in regions were iron dominates the contrast, T2* and susceptibility values may have a relatively well defined dependence on iron content. In these regions, these measures may provide reasonable estimates of tissue iron content (7, 22). However, it is expected that the relative contribution of the sources contributing to contrast in susceptibility-weighted MRI will vary across brain regions. For example, in white matter, some of the paramagnetic susceptibility of iron may be canceled out by diamagnetic contributions of myelin. This could explain the absence of a paramagnetic phase shift in WM (relative to cerebro-spinal fluid) (8), and a remaining diamagnetic shift after iron extraction (32). Also, because of the generally highly ordered microscopic structure of WM, the orientation of this structure may affect the MRI susceptibility measures (30, 33).
Accurate analysis of brain iron content with MRI will likely require a comprehensive understanding of the mechanisms and relative importance of contributing compounds to the various MRI contrast parameters. It is likely that combined analysis of the various MRI contrasts will contribute to this understanding. For example, combined analysis of T2* and phase data may be helpful in quantification of myelin and iron content, as these compounds differentially contribute to the two contrasts.
Acknowledgements
My colleagues in the laboratory of Advanced MRI are acknowledged for their contributions to this work.
References
- 1.Morris CM, et al. Brain iron homeostasis. (Translated from eng) J Inorg Biochem. 1992;47(3–4):257–265. doi: 10.1016/0162-0134(92)84071-t. (in eng). [DOI] [PubMed] [Google Scholar]
- 2.Burdo JR, Connor JR. Brain iron uptake and homeostatic mechanisms: an overview. (Translated from eng) Biometals. 2003;16(1):63–75. doi: 10.1023/a:1020718718550. (in eng) [DOI] [PubMed] [Google Scholar]
- 3.Zecca L, Youdim MB, Riederer P, Connor JR, Crichton RR. Iron, brain ageing and neurodegenerative disorders. (Translated from eng) Nat Rev Neurosci. 2004;5(11):863–873. doi: 10.1038/nrn1537. (in eng). [DOI] [PubMed] [Google Scholar]
- 4.Drayer B, et al. MRI of brain iron. Am J Roentgenol. 1986;147(1):103–110. doi: 10.2214/ajr.147.1.103. [DOI] [PubMed] [Google Scholar]
- 5.Schenck JF. Magnetic resonance imaging of brain iron. J Neurol Sci. 2003;207(1–2):99–102. doi: 10.1016/s0022-510x(02)00431-8. [DOI] [PubMed] [Google Scholar]
- 6.Haacke EM, et al. Imaging iron stores in the brain using magnetic resonance imaging. Magn Reson Imaging. 2005;23(1):1–25. doi: 10.1016/j.mri.2004.10.001. [DOI] [PubMed] [Google Scholar]
- 7.Ogg RJ, Langston JW, Haacke EM, Steen RG, Taylor JS. The correlation between phase shifts in gradient-echo MR images and regional brain iron concentration. Magn Reson Imaging. 1999;17(8):1141–1148. doi: 10.1016/s0730-725x(99)00017-x. [DOI] [PubMed] [Google Scholar]
- 8.Duyn JH, et al. High-field MRI of brain cortical substructure based on signal phase. Proc Natl Acad Sci U S A. 2007;104(28):11796–11801. doi: 10.1073/pnas.0610821104. [DOI] [PMC free article] [PubMed] [Google Scholar]
- 9.Sodickson DK, Manning WJ. Simultaneous acquisition of spatial harmonics (SMASH): fast imaging with radiofrequency coil arrays. Magn Reson Med. 1997;38(4):591–603. doi: 10.1002/mrm.1910380414. [DOI] [PubMed] [Google Scholar]
- 10.Pruessmann KP, Weiger M, Scheidegger MB, Boesiger P. SENSE: sensitivity encoding for fast MRI. Magn Reson Med. 1999;42(5):952–962. [PubMed] [Google Scholar]
- 11.van Gelderen P, de Zwart JA, Starewicz P, Hinks RS, Duyn JH. Realtime shimming to compensate for respiration-induced B0 fluctuations. Magn Reson Med. 2007;57(2):362–368. doi: 10.1002/mrm.21136. [DOI] [PubMed] [Google Scholar]
- 12.Derbyshire JA, Wright GA, Henkelman RM, Hinks RS. Dynamic scanplane tracking using MR position monitoring. (Translated from eng) J Magn Reson Imaging. 1998;8(4):924–932. doi: 10.1002/jmri.1880080423. (in eng). [DOI] [PubMed] [Google Scholar]
- 13.Tremblay M, Tam F, Graham SJ. Retrospective coregistration of functional magnetic resonance imaging data using external monitoring. Magn Reson Med. 2005;53(1):141–149. doi: 10.1002/mrm.20319. [DOI] [PubMed] [Google Scholar]
- 14.Zaitsev M, Dold C, Sakas G, Hennig J, Speck O. Magnetic resonance imaging of freely moving objects: prospective real-time motion correction using an external optical motion tracking system. (Translated from eng) Neuroimage. 2006;31(3):1038–1050. doi: 10.1016/j.neuroimage.2006.01.039. (in eng). [DOI] [PubMed] [Google Scholar]
- 15.Qin L, et al. Prospective head-movement correction for high-resolution MRI using an in-bore optical tracking system. (Translated from Eng) Magn Reson Med. 2009 doi: 10.1002/mrm.22076. (in Eng). [DOI] [PMC free article] [PubMed] [Google Scholar]
- 16.Ooi MB, Krueger S, Thomas WJ, Swaminathan SV, Brown TR. Prospective real-time correction for arbitrary head motion using active markers. (Translated from eng) Magn Reson Med. 2009;62(4):943–954. doi: 10.1002/mrm.22082. (in eng). [DOI] [PMC free article] [PubMed] [Google Scholar]
- 17.Sodickson DK, Griswold MA, Jakob PM. SMASH imaging. Magn Reson Imaging Clin N Am. 1999;7(2):237–254. vii–viii. [PubMed] [Google Scholar]
- 18.Fischl B, et al. Sequence-independent segmentation of magnetic resonance images. (Translated from eng) Neuroimage. 2004;23(Suppl 1):69–84. doi: 10.1016/j.neuroimage.2004.07.016. (in eng). [DOI] [PubMed] [Google Scholar]
- 19.Haacke EM, Lenz GW. Improving MR image quality in the presence of motion by using rephasing gradients. (Translated from eng) AJR Am J Roentgenol. 1987;148(6):1251–1258. doi: 10.2214/ajr.148.6.1251. (in eng). [DOI] [PubMed] [Google Scholar]
- 20.de Zwart JA, Ledden PJ, Kellman P, van Gelderen P, Duyn JH. Design of a SENSE-optimized high-sensitivity MRI receive coil for brain imaging. Magn Reson Med. 2002;47(6):1218–1227. doi: 10.1002/mrm.10169. [DOI] [PubMed] [Google Scholar]
- 21.Abduljalil AM, Schmalbrock P, Novak V, Chakeres DW. Enhanced gray and white matter contrast of phase susceptibility-weighted images in ultra-highfield magnetic resonance imaging. J Magn Reson Imaging. 2003;18(3):284–290. doi: 10.1002/jmri.10362. [DOI] [PubMed] [Google Scholar]
- 22.Yao B, et al. Susceptibility contrast in high field MRI of human brain as a function of tissue iron content. (Translated from eng) Neuroimage. 2009;44(4):1259–1266. doi: 10.1016/j.neuroimage.2008.10.029. (in eng). [DOI] [PMC free article] [PubMed] [Google Scholar]
- 23.Salomir R, de Senneville BD, Moonen CTW. A fast calculation method for magnetic field inhomogeneity due to an arbitrary distribution of bulk susceptibility. Concepts in Magnetic Resonance B. 2003;19B(1):26–34. [Google Scholar]
- 24.Marques JP, Bowtell RW. Using forward calculations of the magnetic field perturbation due to a realistic vascular model to explore the BOLD effect. NMR Biomed. 2007 doi: 10.1002/nbm.1224. [DOI] [PubMed] [Google Scholar]
- 25.de Rochefort L, Brown R, Prince MR, Wang Y. Quantitative MR susceptibility mapping using piece-wise constant regularized inversion of the magnetic field. (Translated from eng) Magn Reson Med. 2008;60(4):1003–1009. doi: 10.1002/mrm.21710. (in eng). [DOI] [PubMed] [Google Scholar]
- 26.Kressler B, et al. Nonlinear Regularization for Per Voxel Estimation of Magnetic Susceptibility Distributions From MRI Field Maps. (Translated from Eng) IEEE Trans Med Imaging. 2009 doi: 10.1109/TMI.2009.2023787. (in Eng). [DOI] [PMC free article] [PubMed] [Google Scholar]
- 27.Liu T, Spincemaille P, de Rochefort L, Kressler B, Wang Y. Calculation of susceptibility through multiple orientation sampling (COSMOS): a method for conditioning the inverse problem from measured magnetic field map to susceptibility source image in MRI. (Translated from eng) Magn Reson Med. 2009;61(1):196–204. doi: 10.1002/mrm.21828. (in eng). [DOI] [PubMed] [Google Scholar]
- 28.Shmueli K, Li J, Duyn JH. Magnetic Susceptibility Mapping of Brain Tissue in-vivo using MRI phase data. . (Translated from eng) In Press, Magn Reson Med. 2009 doi: 10.1002/mrm.22135. (in eng). [DOI] [PMC free article] [PubMed] [Google Scholar]
- 29.Zhong K, Leupold J, von Elverfeldt D, Speck O. The molecular basis for gray and white matter contrast in phase imaging. Neuroimage. 2008;40(4):1561–1566. doi: 10.1016/j.neuroimage.2008.01.061. [DOI] [PubMed] [Google Scholar]
- 30.He X, Yablonskiy DA. Biophysical mechanisms of phase contrast in gradient echo MRI. (Translated from eng) Proc Natl Acad Sci U S A. 2009;106(32):13558–13563. doi: 10.1073/pnas.0904899106. (in eng). [DOI] [PMC free article] [PubMed] [Google Scholar]
- 31.Lee D, Hirano Y, Fukunaga M, Silva AC, Duyn JH. Investigating the sources of phase contrast: iron oxide nanoparticle study to exclude deoxyhemoglobin as a major source of grey/white matter contrast. Internat. Soc. for Magnetic Resonance in Medicine. 2009:1576. [Google Scholar]
- 32.Fukunaga M, et al. Brain Function and Cortical Iron Distribution. (Translated from eng) Proc Natl Acad Sci U S A. 2009 (in eng). [Google Scholar]
- 33.Lee J, et al. Sensitivity of MRI Resonance Frequency to the Orientation of Brain Tissue Microstructure. (Translated from eng) submitted to Proc Natl Acad Sci U S A. 2009 doi: 10.1073/pnas.0910222107. (in eng). [DOI] [PMC free article] [PubMed] [Google Scholar]


