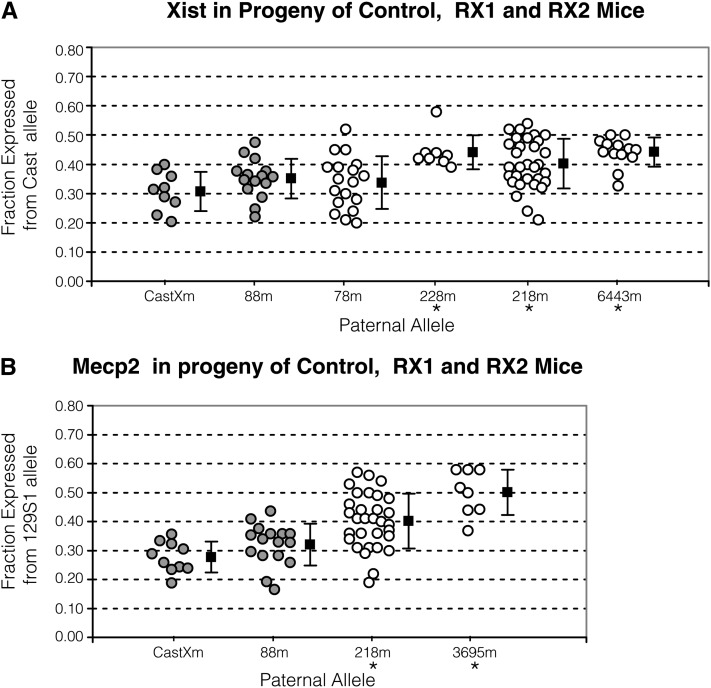
Figure 4.
The X inactivation ratio as measured by allelic Xist and Mecp2 expression. The x-axis lists progeny tested mice with the designated allele described in Figure 2. Mice were mated with 129S1 mice for progeny testing. See Figure 3 legend for detail. (A) Xist in progeny of control, RX1 and RX2 progeny. The y-axis provides the ratio, measured as the fraction of total RNA that is expressed from the Cast allele. The mean X inactivation ratio in CastXm and 78m progeny did not differ (P = 0.35). The ratio in CastXm progeny significantly differed from the ratio in 228m (P < 10−3), 218m (P = 0.003), and 6443m (P < 10−3) progeny. (B) Mecp2 in progeny of control, RX1 and RX2 progeny. The y-axis provides the ratio, measured as the fraction of total RNA that is expressed from the 129S1 allele. The ratio in CastXm progeny differed from the ratio in 218m (P < 10−4) and 3695m (P < 10−4) progeny.

