Abstract
A dimorphic pattern of macrocephalic (wide, short) and stenocephalic (narrow, long) body shapes is observed in snail-feeding carabid beetles globally. The former exhibits high performance in crushing snail shells with powerful jaws, whereas the latter specializes in eating snails' soft body directly by inserting the head into the shell. In the snail-feeding species Damaster blaptoides, the subspecies D. b. capito has a wide, short forebody, and D. b. fortunei has a narrow, long forebody. They exhibit distinct morphologies despite their geographic and phylogenetic proximity. To examine the genetic basis of the morphological differences between these two subspecies, we conducted quantitative genetic analyses by crossing these subspecies and producing F1 and backcross hybrids. The hybrids had body shapes intermediate between the parental subspecies. The variation between wide, short and narrow, long forebodies was based on negative genetic correlations between width and length of the head and thorax. Between one and eight genetic factors were involved in the morphological differences between subspecies. We suggest that the morphological integration of forebody parts in a small number of loci has facilitated the marked morphological diversification between subspecies of D. blaptoides.
Keywords: adaptive radiation, Castle–Wright estimator, joint-scaling test, morphological integration, trade-off
Introduction
Divergent natural selection associated with the specific consumption of a food resource causes intra- and interspecific variations in animal trophic morphology, and results in particular patterns of adaptive radiation (Grant and Grant, 2009; Schluter, 2009). Differences in the genetic background of an animal have an important role in molding the pattern of morphological diversification in different lineages. For example, variations in trophic morphologies, such as the beak size of finches or the cichlid mouth shape, each resulted from the simple genetic basis of a single dominant genetic factor (Hori, 1993; Smith, 1993). Meanwhile, recent quantitative genetic studies have revealed that diversification of trophic morphologies is based on multiple loci that are closely linked with one another (Albertson et al., 2003a). Theoretically, populations can rapidly adapt to a novel resource when ecological traits are controlled by a small number of loci, and therefore, a simple genetic basis may often be involved in adaptive radiation (Gavrilets and Vose, 2005; Gavrilets and Losos, 2009). Genetic correlations among multiple traits that constitute the trophic morphologies are also important components for understanding the direction and speed of adaptive changes along the ‘genetic lines of least resistance' (Lande, 1979; Schluter, 1996). Quantitative genetic analyses of diversified trophic morphologies provide useful information for understanding how a particular genetic basis contributes to the adaptive divergence between related species (Albertson et al., 2003a; Cooper et al., 2011).
Here, we focus on the dimorphism in adaptive trophic morphology observed in malacophagous (snail-feeding) carabid beetles, known as macrocephalism and stenocephalism, within the subtribe Carabina of Carabidae (Sturani, 1962; Sota and Ishikawa, 2004). Macrocephalism is the tendency for beetle heads to widen compared with other body parts, whereas stenocephalism is the tendency for beetle forebodies (heads and thoraces) to be narrowly elongated. Functional correlation between the diverged body shape and feeding behavior has been demonstrated using macrocephalic and stenocephalic subspecies of the Japanese species Damaster blaptoides (Konuma and Chiba, 2007), in which a subspecies on Sado Island (D. b. capito) possesses the most wide, short heads and thoraces, whereas other subspecies possesses narrow, long ones. Beetles with wide, short heads and thoraces (D. b. capito) can eat small land snails by crushing shells with their powerful mandibles, but they cannot easily eat large snails by inserting their heads into snail shells. In contrast, beetles with narrow, long heads and thoraces (for example, D. b. oxuroides) can eat the snail body directly by inserting their forebodies into the shells of large snails, although they cannot easily crush the shells of small snails (Konuma and Chiba, 2007). Thus, these feeding behaviors, shell crushing and shell entry, represent alternative feeding tactics closely associated with both the predator's body shape and prey size.
Although the species D. blaptoides occurs across the ∼2000-km range of Japanese islands and exhibits large variations in body shape and size, populations with intermediate body shapes between the most macrocephalic subspecies (D. b. capito) and other subspecies are not known (Konuma et al., 2011). The size of available land snails can be a major selection factor promoting divergence in D. blaptoides body shape, as beetles with wide, short forebodies occur in areas with smaller land snails, and beetles with narrow, long forebodies occur in areas with larger land snails (Konuma et al., 2011). Thus, the morphological divergence of snail-feeding carabids may have been influenced by the divergent natural selection exerted by prey snail fauna via the functional trade-off between the alternative feeding tactics, themselves closely associated with body shape. In addition, Sado Island, inhabited by D. b. capito, is highly isolated from the main island, allowing evolution of the distinct morphology in the absence of gene flow (Konuma et al., 2011).
The genetic basis enabling the morphological divergence of D. blaptoides is unexplored. In our experiments, we crossed the subspecies D. b. capito on Sado Island, which has a wide and short head and thorax, with the subspecies D. b. fortunei on Awashima Island, which has a narrow and long head. Although these two subspecies are found in close proximity to each other (∼60 km) and are phylogenetically close in terms of their mitochondrial gene sequence (Su et al., 1998), their body shapes are distinctly different. We crossed D. b. capito and D. b. fortunei to produce F1 progeny and backcrossed the hybrids. We conducted a quantitative genetic analysis to examine the genetic correlations among traits that constitute the beetle morphologies and the number of genetic factors contributing to the different traits. We found that a few genetic factors were involved in the subspecific differences in body shape and that the genetic factors influencing the different body parts are strongly correlated with one another, thus facilitating rapid divergence toward the different subspecific forms. To examine whether allometric effects exist in the genetic background of D. blaptoides morphology, we also conducted allometric analyses in these beetles.
Materials and methods
Study organisms
The hind-wingless carabid ground beetle D. blaptoides feeds on land snails in all of their life stages. They are endemic to the Japanese archipelago and consist of seven subspecies. Six subspecies occur on the main island Honshu and its adjacent small islands, and these possess narrow, long heads and thoraces (Konuma et al., 2011). In contrast, D. b. capito, the subspecies on Sado Island, possesses much wider and shorter forebodies, which are unique among the subspecies. Thus, a morphological discontinuity, like a missing link, exists between D. b. capito and the other subspecies. In this study, we used D. b. capito and a subspecies with narrow, long heads and thoraces, and D. b. fortunei on Awashima Island, which is among the closest to D. b. capito both geographically and phylogenetically (Su et al., 1998).
Experimental crosses
Using wild individuals collected in 2006, we produced laboratory-bred individuals of D. b. capito (hereafter, P1) and D. b. fortunei (P2). Then we produced an F1 hybrid population by crossing P1 and P2, and subsequently a backcross population to D. b. capito (B1) and a backcross population to D. b. fortunei (B2). The numbers of families and individuals are given in Table 1. Each larva was reared separately in a small plastic box (14.0 × 9.0 × 4.5 cm3) at 21±1 °C and 14L:10D, which were similar to summer conditions in the field. After molting to the second (last) instar, larvae were transferred to deeper plastic boxes (12.0 × 12.0 × 9.0 cm3) filled with wet sphagnum on wet soil. After eclosion, emerged adults were transferred to small plastic boxes and fed sufficient snails until skeletal hardening. We produced 508 individuals in total.
Table 1. Cross types, number of families and number of individuals produced by crosses.
| Populationa | Cross typea (female × male) | No. of families | No. of individuals |
|---|---|---|---|
| P1 | 15 | 196 | |
| P2 | 19 | 75 | |
| F1 | P1 × P2 | 3 | 90 |
| P2 × P1 | 2 | 16 | |
| Total | 5 | 106 | |
| B1 | F1(P1 × P2) × P1 | 7 | 53 |
| F1(P2 × P1) × P1 | 1 | 1 | |
| Total | 8 | 54 | |
| B2 | F1(P1 × P2) × P2 | 8 | 72 |
| F1(P2 × P1) × P2 | 1 | 5 | |
| Total | 9 | 77 |
P1, D. b. capito; P2, D. b. fortunei; F1, F1 hybrids; B1, backcross to D. b. capito; B2, backcross to D. b. fortunei. For example, F1(P1 × P2) × P2 represents the backcross between an F1 female (from D. b. capito female × D. b. fortunei male) and a D. b. fortunei male.
We fed five snails to each of the first-instar larvae and 15 to each second-instar larva all at once. We used Bradybaena similaris snails as food because this species occurs widely in Japan and does not show large variation in size, and thus we could equalize the total amount of food for each larva. Konuma and Chiba (2007) demonstrated that this snail could be easily consumed by both the wide, short and narrow, long type of D. blaptoides, because their shells are relatively thin and easily crushed by the beetles and their shell apertures are large and easily penetrated by the head of the beetle. Whether the morphology of beetles exhibits phenotypic plasticity depending on dietary conditions is unknown; however, our experimental design likely had minimal effect on beetle phenotypic variation as a by-product of particular dietary conditions. We were unable to obtain sufficient land snails for populations of F1(P2 × P1) × P1 and F1(P2 × P1) × P2, which were reared during the winter when land snails were scarce. Therefore, there were fewer families and offspring in these groups (two families and six individuals) than in other groups.
Analysis of beetle morphology
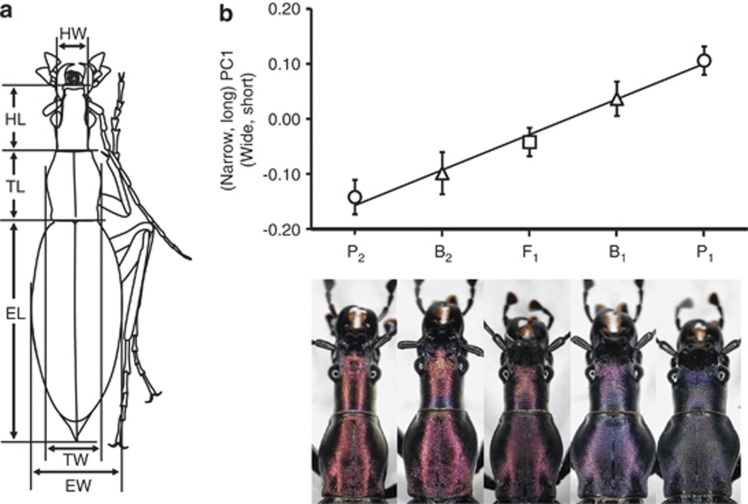
We took pictures of the dorsal views of whole beetle bodies with a 2-mm mesh sheet using a digital camera equipped with a macro lens (PowerShot A40; Canon, Tokyo, Japan). Each image was viewed on a computer screen with the 2 mm mesh measure to determine the lengths of different body parts (Figure 1a). The head width was measured at the narrowest part of the neck between the eyes and thorax, and the head length was the distance between the front edge of the labrum and the thorax. The thorax width and length were the maximum distances in the vertical and horizontal directions, respectively, of the thorax. The elytron width was the maximum horizontal distance of the elytron, and the elytron length was the distance between the thorax and the elytron edge. Image analysis was conducted using a program written by Visual Basic in Microsoft Excel 2010. We log-transformed these measurement values and used them in the following morphological and quantitative genetic analyses.
Figure 1.
Morphological analysis of D. b. capito, D. b. fortunei, F1 and backcrossed hybrids. (a) Body measurements used in principal components analysis. HW, head width; HL, head length; TW, thorax width; TL, thorax length; EW, elytron width; EL, elytron length. (b) Means and standard deviations of body-shape scores (PC1 scores) for each of the five populations. The solid line represents the linear regression of mean values.
In our morphological analyses, we defined size and shape as follows. The geometric mean (GM) of the morphological variables was used as a size metric:
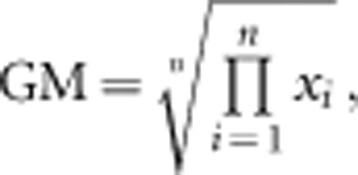 |
where xi is the measurement for variable i. GM is frequently used as a size metric in morphometric analysis of distance data (Jungers et al., 1995). We used log(GM) in our analyses, which is the arithmetic mean of the logged variables. Shape can be defined as all remaining variation after removing size. To eliminate the effect of size, we conducted Burnaby's procedure (Burnaby, 1966; Klingenberg, 1996; Blankers et al., 2012) as follows:
 |
where X is an m × n data matrix (m is the number of individuals and n is the number of morphological variables), I is a n × n identity matrix and μ is an isometric vector with n values of 1/sqrt(n). This procedure returns morphological variables from which the effect of GM is removed (Mosimann, 1970).
To find a representative shape axis that corresponded to the divergence between wide, short and narrow, long beetle forebodies, we conducted a principal component analysis based on the covariance matrix. The sample size of D. b. capito was much larger than those of the other populations in our breeding families (Table 1), which could affect the values of eigenvectors of the covariance matrix such that the hyperellipsoids through which principal axes were calculated were greatly biased toward the measurement values of D. b. capito, and thereby, rare samples with measurement values much different from values of D. b. capito would have extreme scores on the PC axes. To remove bias caused by differences in sample size between parent, F1 and backcross populations and to determine PC axes meaningful for quantitative genetic analysis, we first randomly chose 48 individuals from each population (that is, 240 individuals in total) and determined eigenvectors, and later we used these to calculate the PC scores of all individuals.
Correlation analysis
To examine how body parts are genetically correlated, we examined the phenotypic correlations (rP) between body traits in the segregated populations B1 and B2. Significance of the correlations was tested using a t-test with n−2 degrees of freedom (d.f.). Because a phenotypic correlation of the segregated populations includes both genetic and environmental effects, it cannot be regarded as the actual genetic correlation value. However, phenotypic and genetic correlations tend to have the same sign and magnitude (Cheverud, 1988; Lynch and Walsh, 1998), and therefore phenotypic correlations can be regarded as surrogate estimates of genetic correlations (Lynch and Walsh, 1998). To examine genetic correlations by an alternate method, we estimated rG as follows:
 |
where Cov(eA, eB) is the environmental covariance and Var(eA) and Var(eB) are environmental variances. Phenotypic covariance and variance in non-segregated populations can be regarded as environmental covariance and variance because genetic effects that appear in segregated populations do not appear in the non-segregated populations (Sezer and Butlin, 1998). To estimate rG with the above equation, we used phenotypic covariance and variance of the F1 population as the environmental covariance and variance. Because rG is not a product–moment correlation, it can exceed the ±1 boundary.
Estimation of composite effects
To examine composite genetic effects, such as additive and dominant effects, we used a weighted least-squares regression to compare observed and expected population means of parental, F1 and backcross populations. This approach is generally known as a joint-scaling test, the details of which were described by Lynch and Walsh (1998). Here we explain the outline of this method in our case.
First, we tested the null hypothesis that all gene action is additive within and between loci by using the following model:
 |
where  and ɛi are the trait means and sampling error in the ith population, respectively. θS is the source index (Lynch and Walsh, 1998), the relative value of the expected number of P1 alleles at a locus in a particular population; 1, 1/2, 0, −1/2 and −1 are the source indices of P1, B1, F1, B2 and P2, respectively; and μ and α are parameters controlling the mean value of all populations and additive genetic effects, estimated with the weighted least squares. A χ2 statistic for goodness of fit can be used to compare the predicted values with the observed means. When the test statistic is not significant, it suggests that the model adequately explains the data. In cases where the test statistic was significant, we next tested the model by adding the variable for dominant effects:
 |
where δ is the parameter controlling dominant effects, which is estimated with the weighted least squares. θH is the hybridity index (Lynch and Walsh, 1998), and the values of P1, B1, F1, B2 and P2 are −1, 0, 1, 0 and −1, respectively. Similarly, a χ2 statistic was used for evaluating model fitness. We concluded that the genetic composite effects were additive and dominant effects when the test statistic was not significant. Models with epistatic effects should be tested if the above two models cannot sufficiently explain the data. For this purpose, however, we needed population data other than P1, B1, F1, B2 and P2. Therefore, the effect of epistasis was not considered in the model here and was included in the error term ɛi in the above models.
Castle–Wright estimator
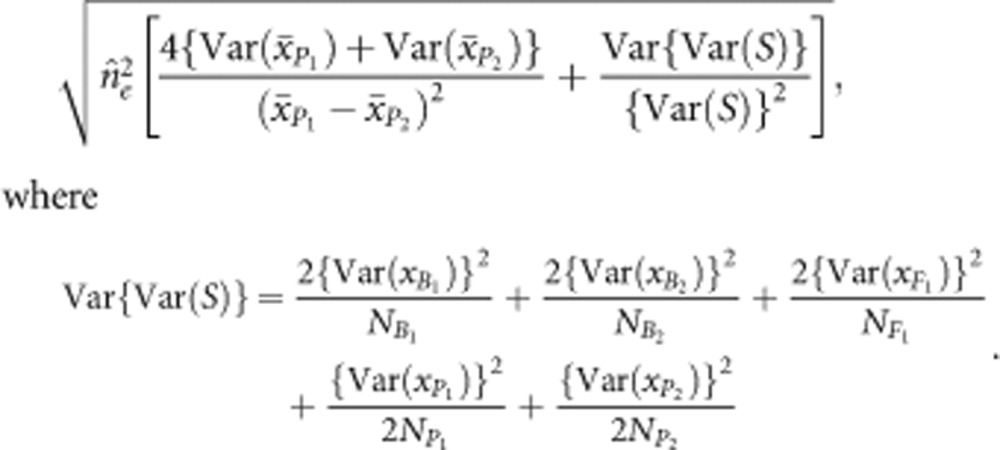
To estimate the effective number of loci involved in interspecific differences in body shape, we applied Lande's modification of the Castle–Wright estimator (Lande, 1981; Saldamando et al., 2005). This method estimates the minimum number of normally segregating loci that would be needed to explain the observed phenotypic means and variances of parental, F1 and backcross populations. The accuracy of the estimation depends on several assumptions: that alleles have equal, additive effects within and among loci; that loci are unlinked; and that all alleles that increase the volume of the trait must be fixed in one parental population, whereas all alleles that decrease the volume of that trait must be fixed in the other parental population. Violations of one or more of these assumptions tend to result in underestimations of the actual number of loci.
The effective number of loci was estimated as follows:
 |
where  and
and  are the observed means of parental populations and
 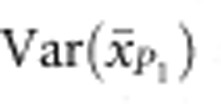 and
and 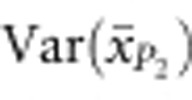 are the sampling variances of the means for the parental populations (Cockerham, 1986). Var(S) is the segregation variance, estimated using the following equation:
 |
where  and
and  are the observed phenotypic variances of backcross populations, and
 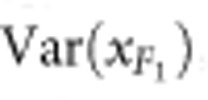 ,
,  and
and 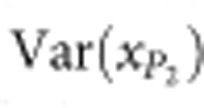 are the phenotypic variances of the F1 and two parental populations, respectively. The standard error of
  is calculated as follows:
 |
Allometric analysis
Although the definitions of size and shape are logically separate, they are not necessarily independent of each other in the comparison among individuals. Shape variation can be dependent on size variation because of allometric effects (Klingenberg, 1996). To examine whether allometric effects exist in the genetic background of D. blaptoides morphology, we conducted regression analyses of the shape variables on log(GM) in the backcrossed individuals. The predicted values can be regarded as shape variables accounting for the allometric component, and therefore the residuals correspond to the shape variables accounting for the non-allometric component. We also estimated the regression coefficients of log(GM), referred to as the allometric coefficients (Klingenberg, 1996).
Results
Morphological analysis of beetle bodies
Table 2 shows the principal component analysis results for the six morphological variables. The first principal component (PC1) explained most of the variation (65%) among D. b. capito, D. b. fortunei and their hybrids. The PC1 loadings of head and thorax widths were positive, whereas those of head and thorax lengths were negative. Thus, PC1 can be interpreted as the shape axis on which high scores indicate wide and short forebodies (heads and thoraces), and low scores indicate narrow and long forebodies. The PC1 loadings of elytron width and length were negative, indicating that beetles with wide, short forebodies possess small elytra, and beetles with narrow, long forebodies possess large elytra. Although PC5 can also be interpreted as a shape axis representing the transition between wide, short and narrow, long forebodies, head and thorax loadings were close to zero. As elytron loadings were relatively large in PC5, PC5 represents elytron shape rather than forebody shape. The other PCs did not represent the transition between wide, short and narrow, long forebodies, and therefore PC1 was the most representative shape axis corresponding to the diversification between wide, short and narrow, long forebodies.
Table 2. Loadings of body measurements from D. b. capito, D. b. fortunei and their hybrids on the first five principal components axes.
| PC1 | PC2 | PC3 | PC4 | PC5 | |
|---|---|---|---|---|---|
| Eigenvalue | 0.0093 | 0.0025 | 0.0013 | 0.0008 | 0.0004 |
| Contribution rate (%) | 65 | 17 | 9 | 6 | 3 |
| HW | 0.982 | −0.074 | −0.073 | −0.159 | −0.018 |
| HL | −0.555 | 0.541 | −0.639 | 0.060 | 0.031 |
| TW | 0.734 | 0.284 | 0.318 | 0.538 | −0.022 |
| TL | −0.658 | 0.516 | 0.456 | −0.315 | 0.065 |
| EW | −0.507 | −0.786 | −0.013 | 0.062 | 0.337 |
| EL | −0.790 | −0.488 | 0.017 | −0.011 | −0.356 |
Abbreviations: EL, elytron length; EW, elytron width; HL, head length; HW, head width; PC1, first principal component; TL, thorax length; TW, thorax width.
Body measurements correspond with those in Figure 1a.
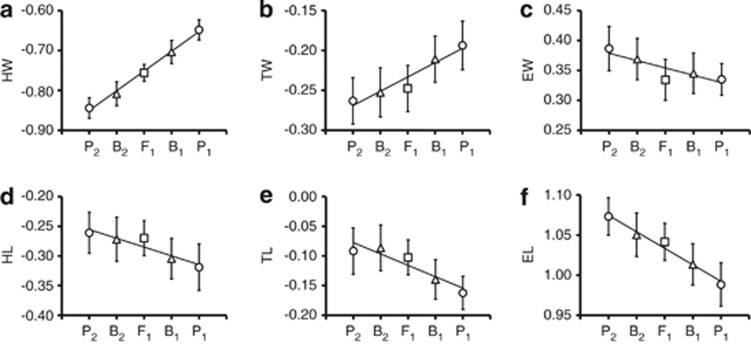
Clear differences existed in PC1 among the five populations (Figure 1b). For PC1 scores, F1 hybrids were intermediate between the two parental populations, and the two backcrosses were intermediate between F1 and either of the parental populations (P1 or P2). This tendency was also observed in the comparisons of population means of head width, thorax width and elytron length (Figure 2). Thus, F1 and backcross hybrids had intermediate phenotypic values between their parental populations in these body measurements. Body size also differed among the populations; P1 and B1 were larger than P2 (analysis of variance, d.f.=507, F=4.19, P=0.002).
Figure 2.
Means and standard deviations of the measured traits of each of the five populations. Solid lines represent linear regressions of mean values. HW, head width (a); HL, head length (d); TW, thorax width (b); TL, thorax length (e); EW, elytron width (c); EL, elytron length (f). The symbols of circles, squares, and triangles indicate the mean values of parental, F1, and backcross populations, respectively.
Quantitative genetic analysis
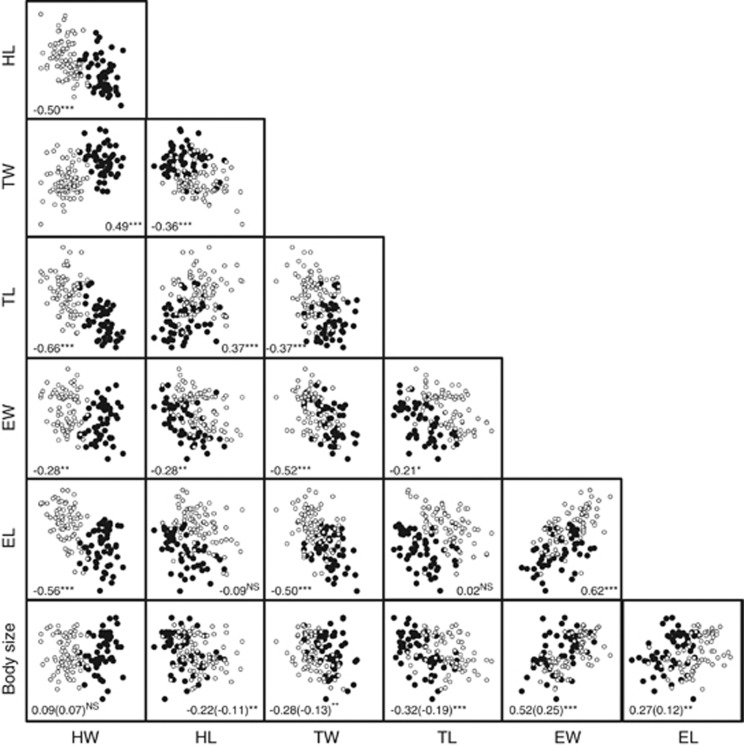
Phenotypic correlations (rP) were significant for most trait pairs of the backcrossed individuals (B1 and B2 combined; Figure 3). Four trait pairs with head and thorax measurements (HW–HL, TW–TL, HW–TL and TW–HL) had negative correlations. These four trait pairs showed negative correlations for rP and rG in B2 (Table 3b). In B1, the same four trait pairs showed negative correlations except for rP of TW–TL and rG of TW–HL (Table 3a).
Figure 3.
Correlation plots of six body traits and body size of B1 (filled circles) and B2 (open circles). Correlation coefficients and statistical significance are given in the panels (NS, P>0.05; *, P<0.05; **, P<0.01; ***, P<0.001). Allometric coefficients are given within parentheses in the body size panels. HW, head width; HL, head length; TW, thorax width; TL, thorax length; EW, elytron width; EL, elytron length.
Table 3. Correlation between body measurements in (a) B1 and (b) B2.
| Traits | HW | HL | TW | TL | EW | EL |
|---|---|---|---|---|---|---|
| (a) B1 | ||||||
| HW | −0.12 | −3.05 | −1.37 | NA | 0.22 | |
| HL | −0.32* | 0.51 | 1.22 | NA | −1.39 | |
| TW | −0.23 | −0.07 | −5.56 | NA | 6.47 | |
| TL | −0.59*** | 0.28* | 0.17 | NA | −0.24 | |
| EW | 0.20 | −0.54*** | −0.51*** | −0.55*** | NA | |
| EL | 0.08 | −0.55 *** | −0.32* | −0.47*** | 0.46*** | |
| Body size | 0.32* | −0.27 | −0.28* | −0.49*** | 0.48*** | 0.30* |
| (b) B2 | ||||||
| HW | −0.17 | 0.79 | −0.24 | −1.59 | −0.89 | |
| HL | −0.32** | −0.74 | 0.33 | −2.79 | −0.49 | |
| TW | 0.14 | −0.24* | −2.19 | 5.10 | 1.39 | |
| TL | −0.24* | 0.13 | −0.18 | 0.29 | −0.37 | |
| EW | −0.12 | −0.44 *** | −0.37 *** | −0.52 *** | 2.25 | |
| EL | −0.33** | −0.36** | −0.23* | −0.47*** | 0.61*** | |
| Body size | −0.07 | −0.18 | −0.44*** | −0.29* | 0.64*** | 0.42*** |
Abbreviations: EL, elytron length; EW, elytron width; HL, head length; HW, head width; NA, not available; TL, thorax length; TW, thorax width.
The below diagonals are phenotypic correlations (rP) and the above diagonals are genetic correlations (rG).
rG of EW in B1 is NA, because the denominators of rG are imaginary numbers.
*P<0.05; **P<0.01; ***P<0.001.
In the joint-scaling test (Table 4), a linear model with only the additive genetic parameter (additive model) did not fit the variations in the morphological traits (P<0.001). However, a model with additive and dominant genetic parameters (additive-dominance model) fit the variations in PC1, head width, head length, thorax length and elytron length (P>0.05); this model also slightly fit those of thorax length, elytron width and body size (0.05>P>0.01).
Table 4. Genetic parameters estimated in joint-scaling test.
| Trait |
Additive model |
Additive-dominance model |
|||||||
|---|---|---|---|---|---|---|---|---|---|
| μ (±s.e.) | α (±s.e.) | χ2(d.f.) | P-value | μ (±s.e.) | α (±s.e.) | δ (±s.e.) | χ2(d.f.) | P-value | |
| PC1 | −0.029 | 0.130 | 68.525 | <0.001 | −0.031 | 0.125 | −0.013 | 3.551 | 0.169 |
| ±0.001 | ±0.002 | (1) | ±0.001 | ±0.002 | ±0.002 | (2) | |||
| HW | −0.752 | 0.101 | 18.714 | <0.001 | −0.752 | 0.099 | −0.005 | 4.953 | 0.084 |
| ±0.001 | ±0.002 | (1) | ±0.001 | ±0.002 | ±0.001 | (2) | |||
| HL | −0.283 | −0.031 | 32.025 | <0.001 | −0.282 | −0.029 | 0.010 | 5.274 | 0.072 |
| ±0.002 | ±0.002 | (1) | ±0.002 | ±0.002 | ±0.002 | (2) | |||
| TW | −0.234 | 0.038 | 32.489 | <0.001 | −0.236 | 0.035 | −0.009 | 5.354 | 0.069 |
| ±0.001 | ±0.002 | (1) | ±0.001 | ±0.002 | ±0.002 | (2) | |||
| TL | −0.115 | −0.044 | 45.540 | <0.001 | −0.114 | −0.038 | 0.012 | 7.100 | 0.029 |
| ±0.002 | ±0.002 | (1) | ±0.002 | ±0.002 | ±0.002 | (2) | |||
| EW | 0.354 | −0.021 | 44.841 | <0.001 | 0.350 | −0.027 | −0.012 | 6.826 | 0.033 |
| ±0.002 | ±0.002 | (1) | ±0.002 | ±0.002 | ±0.002 | (2) | |||
| EL | 1.034 | −0.043 | 17.865 | <0.001 | 1.035 | −0.042 | 0.005 | 3.825 | 0.148 |
| ±0.001 | ±0.002 | (1) | ±0.001 | ±0.002 | ±0.001 | (2) | |||
| Body size | 2.095 | 0.010 | 11.502 | 0.009 | 2.094 | 0.008 | −0.007 | 9.050 | 0.011 |
| ±0.003 | ±0.005 | (1) | ±0.004 | ±0.005 | ±0.004 | (2) | |||
Abbreviations: EL, elytron length; EW, elytron width; HL, head length; HW, head width; PC1, first principal component; TL, thorax length; TW, thorax width;. μ, the mean value of all populations; α, additive effects; δ, dominant effects.
The Castle–Wright method estimated the numbers of genetic factors involved in the morphological differences between the two subspecies (Table 5). The estimator of PC1 was around 8, whereas those of other traits differed depending on the body part. The estimators of head length and thorax length were approximately 1, while those of head width and thorax width were around 7 and 9, respectively. The estimators of elytron width and length were approximately 3. As the estimator of body size was 0.1±0.5, we regarded that the number of the genetic factor of body size is 1 at most.
Table 5. Castle–Wright estimator for the number of genetic factors involved in the difference in each trait between subspecies.
| Trait | Estimator (s.e.) |
|---|---|
| PC1 | 8.1±2.8 |
| HW | 7.4±2.7 |
| HL | 1.2±1.4 |
| TW | 9.2±37.5 |
| TL | 1.1±0.7 |
| EW | 2.5±6.5 |
| EL | 3.8±3.3 |
| Body size | 0.1±0.5 |
Abbreviations: EL, elytron length; EW, elytron width; HL, head length; HW, head width; PC1, first principal component; TL, thorax length; TW, thorax width.
Allometric analysis
To examine allometric variation, we also calculated phenotypic correlations (rP) between morphological traits and body size in backcrossed individuals. Body size was significantly correlated with head length and thorax length (Figure 3, bottom). The allometric components of the head length and thorax length were 4.6% and 10.5%, respectively (95.4% and 89.5%, respectively, for the non-allometric components; Supplementary Table S1). The allometric coefficients of these traits were negative, indicating that enantiometry exists in the two forebody lengths (Klingenberg, 1996). This implies that large individuals tend to have short heads and thoraces, whereas small individuals have long heads and thoraces. For comparison, we also conducted correlation analyses with morphological variables without removing size effects and found that all the morphological trait pairs were positively correlated with each other (Supplementary Figure S1). This is because morphological traits that were not corrected for size showed strong, positive correlations with size (Supplementary Figure S1, bottom). Supplementary Table S1 shows that Burnaby's procedure effectively removed most of the variation explained by size.
Discussion
Genetic basis of body shape
Although populations with a body shape intermediate between D. b. capito and D. b. fortunei do not exist in the wild (Konuma et al., 2011), the hybrids produced in the laboratory exhibited intermediate shapes (Figure 1b). Correlation analysis showed that some traits of beetle body parts were strongly correlated with each other in the segregated populations (Figure 3 and Table 3). These strong correlations would be caused by pleiotropy of a gene or tight linkage of genes affecting multiple phenotypes (Lynch and Walsh, 1998).
Negative phenotypic correlations in the four trait pairs HW–HL, TW–TL, HW–TL and TW–HL (Figure 3) suggest that phenotype sets ‘wide, short head and thorax' and ‘narrow, long head and thorax' result from a particular genetic basis. Beetle heads and thoraces may be regarded as a genetic and functional module (Wagner et al., 2007; Klingenberg, 2008; Parsons et al., 2011). A module is a complex of phenotypic traits that is tightly integrated by pleiotropic effects, is relatively independent of the rest of the phenotype and that can be classified as developmental, genetic, functional or evolutionary (Klingenberg, 2008). The strong genetic correlations among multiple head and thoracic dimensions imply that the head and thorax are genetically integrated. Given that the shape of these two body parts determines the snail-feeding performance (Konuma and Chiba, 2007), they are also tightly integrated with the snail-feeding function. Thus, our data imply that functionally related traits tend to be inherited together.
The Castle–Wright method estimated that the number of genetic factors underlying the differences in body shape (PC1) between D. b. capito and D. b. fortunei is approximately 8 (Table 5). This likely is an underestimate because a simple additive genetic model was not confirmed for PC1 in the joint-scaling test (Table 4). However, the estimators of each body trait were less than that of PC1, except for that of thorax width. Because these traits were strongly correlated with each other (Table 3), some of the responsible genetic factors may have been estimated redundantly. Although dominant effects need to be considered, from 1 to 8 genetic factors seem to be involved in the body-shape differences between the two subspecies.
Assuming the estimated numbers of genetic factors producing the body-shape differences between D. b. capito and D. b. fortunei are even close to being correct, many fewer loci are involved in the adaptive character than predicted in the quantitative genetic models of character divergence (Abrams, 2001). A character shift from one fitness peak to another occurs more rapidly and readily if the phenotypic differences between the peaks are controlled by fewer loci with larger effects, as a large genetic variance shortens the time of transition between peaks (Gavrilets, 2003). Such a genetic background should also facilitate the transition between wide, short and narrow, long carabid beetles.
We also found that allometric effects existed in beetle morphology at the genetic level. Larger backcrossed individuals had shorter forebodies, whereas smaller backcrossed individuals had longer forebodies (Figure 3, bottom). Therefore, a pleiotropic gene that affects both body size and shape may exist. In fact, the number of genetic factor of body size was estimated to be around 1, and those of head length and thorax length were also approximately 1 (Table 5). As D. blaptoides diversifies in size as well as shape (Konuma et al., 2011), the allometric effects at the genetic level could have an important role in the morphological divergence of the two subspecies.
Genetic basis and adaptive divergence
Our previous analysis of geographic variation in body shape suggested that the average size of land snails has exerted selection towards the wide, short or narrow, long forebody of D. blaptoides (Konuma et al., 2011). The wide, short forebody is favored in areas with smaller snails, whereas the narrow, long forebody is favored in areas with lager snails. This trend is consistent with the functional difference between body shapes and patterns of feeding on different sizes of snails (Konuma and Chiba, 2007). The integrated nature of genetic body shape with a small number of genetic factors would enable a rapid response to natural selection for feeding success under different food conditions, particularly local snail size.
Albertson et al. (2003a, 2003b, 2005) and Cooper et al. (2011) showed that divergence of oral jaw morphologies in two related species of East African cichlids was based on clustered genetic factors that integrated jaw morphology toward different shapes, and selection in different directions has driven the rapid diversification of these cichlid species. Their cichlid studies bolster the idea ‘that adaptive evolution is facilitated by divergent natural selection acting on genomic regions that control multiple functionally related phenotypes (for example, Cheverud et al., 1997; Bradshaw et al., 1998; Hawthorne and Via, 2001; Peichel et al., 2001)'. Our results support this idea and suggest that morphological integration may have had an important role in the pattern of morphological dimorphism in snail-feeding carabid beetles.
However, the genetic correlation data in this study and the Castle–Wright estimations are not sufficient to reveal the genetic basis of the beetle body shape, and alternative approaches such as quantitative trait loci mapping analysis are needed. In addition, the geometric morphometric approach can be an effective method for verifying modularity and integration in the beetle body (Klingenberg, 2008, 2010). This analysis allows us to determine whether the beetle head and thorax are formed as a single module or as separate modules using statistical analysis based on landmark data. Analyzing developmental components in the modularity and integration is also necessary (Monteiro and Nogueira, 2009; Drake and Klingenberg, 2010) because, for example, direct interactions such as inductive signaling from the head to the thorax during morphogenesis can cause negative correlations between the head and thoracic dimensions (Klingenberg, 2008).
Our data suggest that the divergence of functional morphologies in the snail-feeding carabid D. blaptoides has a relatively simple genetic basis, which integrates the beetle forebody parts toward the opposite shapes. This genetic basis should be related more or less to divergence between macrocephalic and stenocephalic types in snail-feeding species of the subtribe Carabina, which account for over 42% of the 814 species in the Northern Hemisphere (Sota and Ishikawa, 2004). We suggest that morphological integration may have an important role in evolutionary patterns of diversification in snail-feeding carabid beetles. To reveal the background of the divergence in snail-feeding carabids, more detailed studies of the genetic architecture and comparative analyses of the integration pattern at the developmental, genetic and evolutionary levels are needed.
Data archiving
Data have been deposited at Dryad: doi:10.5061/dryad.jm752.
Acknowledgments
We are extremely grateful to J Urabe, W Makino, Y Takami, S Yamamoto, N Nagata, C Klingenberg, Y Savriama and E Sherratt for critical discussions, and to T Fukuhara, S Wada and H Ikeda for support. We also thank M Schilthuizen and GJ Vermeij for helpful comments on earlier version of this manuscript, and three anonymous reviewers for helpful comments on the present manuscript. This work was supported by Japan Society for the Promotion of Science (JSPS) Research Fellowships for Young Scientists and Grants-in-Aid for scientific research from JSPS (Nos. 15340174, 23128507 and 24770020).
The authors declare no conflict of interest.
Footnotes
Supplementary Information accompanies the paper on Heredity website (http://www.nature.com/hdy)
Supplementary Material
References
- Abrams PA. Modelling the adaptive dynamics of traits involved in inter- and intraspecific interactions: an assessment of three methods. Ecol Lett. 2001;4:166–175. [Google Scholar]
- Albertson RC, Streelman JT, Kocher T. Genetic basis of adaptive shape differences in the cichlid head. J Hered. 2003a;94:291–301. doi: 10.1093/jhered/esg071. [DOI] [PubMed] [Google Scholar]
- Albertson RC, Streelman JT, Kocher T. Directional selection has shaped the oral jaws of Lake Malawi cichlid fishes. Proc Natl Acad Sci USA. 2003b;100:5252–5257. doi: 10.1073/pnas.0930235100. [DOI] [PMC free article] [PubMed] [Google Scholar]
- Albertson RC, Streelman JT, Kocher TD, Yelick PC. Integration and evolution of the cichlid mandible: The molecular basis of alternate feeding strategies. Proc Natl Acad Sci USA. 2005;102:16287–16292. doi: 10.1073/pnas.0506649102. [DOI] [PMC free article] [PubMed] [Google Scholar]
- Blankers T, Adams DC, Wiens JJ. Ecological radiation with limited morphological diversification in salamanders. J Evol Biol. 2012;25:634–646. doi: 10.1111/j.1420-9101.2012.02458.x. [DOI] [PubMed] [Google Scholar]
- Bradshaw HD, Otto KG, Frewen BE, McKay JK, Schemske DW. Quantitative trait loci affecting differences in floral morphology between two species of monkeyflowers (mimulus) Genetics. 1998;149:367–382. doi: 10.1093/genetics/149.1.367. [DOI] [PMC free article] [PubMed] [Google Scholar]
- Burnaby TP. Growth-invariant discriminant functions and generalized distances. Biometrics. 1966;22:96–110. [Google Scholar]
- Cheverud JM. A comparison of genetic and phenotypic correlations. Evolution. 1988;43:958–968. doi: 10.1111/j.1558-5646.1988.tb02514.x. [DOI] [PubMed] [Google Scholar]
- Cheverud JM, Routman EJ, Irschick DJ. Pleiotropic effects of individual gene loci on mandibular morphology. Evolution. 1997;51:2006–2016. doi: 10.1111/j.1558-5646.1997.tb05122.x. [DOI] [PubMed] [Google Scholar]
- Cockerham CC. Modifications in estimating the number of genes for a quantitative character. Genetics. 1986;114:659–664. doi: 10.1093/genetics/114.2.659. [DOI] [PMC free article] [PubMed] [Google Scholar]
- Cooper WJ, Wernle J, Mann K, Albertson RC. Functional and genetic integration in the jaws of Lake Malawi cichlids. Evol Biol. 2011;38:316–334. [Google Scholar]
- Drake AG, Klingenberg CP. Large-scale diversification of skull shape in domestic dogs: disparity and modularity. Am Nat. 2010;175:289–301. doi: 10.1086/650372. [DOI] [PubMed] [Google Scholar]
- Gavrilets S. Perspective: models of speciation: what have we learned in 40 years. Evolution. 2003;57:2197–2215. doi: 10.1111/j.0014-3820.2003.tb00233.x. [DOI] [PubMed] [Google Scholar]
- Gavrilets S, Losos JB. Adaptive radiation: contrasting theory with data. Science. 2009;323:732–737. doi: 10.1126/science.1157966. [DOI] [PubMed] [Google Scholar]
- Gavrilets S, Vose A. Dynamic patterns of adaptive radiation. Proc Natl Acad Sci USA. 2005;102:18040–18045. doi: 10.1073/pnas.0506330102. [DOI] [PMC free article] [PubMed] [Google Scholar]
- Grant PR, Grant BR. How and Why Species Multiply. Princeton University Press: Princeton, NJ; 2009. [Google Scholar]
- Hawthorne DJ, Via S. Genetic linkage of ecological specialization and reproductive isolation in pea aphids. Nature. 2001;412:904–907. doi: 10.1038/35091062. [DOI] [PubMed] [Google Scholar]
- Hori M. Frequency dependent natural selection in the handedness of scale-eating cichlid fish. Science. 1993;260:216–219. doi: 10.1126/science.260.5105.216. [DOI] [PubMed] [Google Scholar]
- Jungers WL, Falsetti AB, Wall CE. Shape, relative size, and size-adjustments in morphometrics. Am J Phys Anthropol. 1995;38:137–161. [Google Scholar]
- Klingenberg CP.1996Multivariate allometryIn: Marcus LF, Corti M, Loy A, Naylor GJP, Slice DE (eds).Advances in Morphometrics Plenum Press: New York; 23–49. [Google Scholar]
- Klingenberg CP. Morphological integration and developmental modularity. Annu Rev Ecol Evol Syst. 2008;39:115–132. [Google Scholar]
- Klingenberg CP. Evolution and development of shape: integrating quantitative approaches. Nat Rev Genet. 2010;11:623–635. doi: 10.1038/nrg2829. [DOI] [PubMed] [Google Scholar]
- Konuma J, Chiba S. Trade-offs between force and fit: extreme morphologies associated with feeding behavior in carabid beetles. Am Nat. 2007;170:90–100. doi: 10.1086/518182. [DOI] [PubMed] [Google Scholar]
- Konuma J, Nagata N, Sota T. Factors determining the direction of ecological specialization in snail-feeding carabid beetles. Evolution. 2011;65:408–418. doi: 10.1111/j.1558-5646.2010.01150.x. [DOI] [PubMed] [Google Scholar]
- Lande R. Quantitative genetic analysis of multivariate evolution, applied to brain: body size allometry. Evolution. 1979;33:402–416. doi: 10.1111/j.1558-5646.1979.tb04694.x. [DOI] [PubMed] [Google Scholar]
- Lande R. The minimum number of genes contributing to quantitative variation between and within populations. Genetics. 1981;99:541–553. doi: 10.1093/genetics/99.3-4.541. [DOI] [PMC free article] [PubMed] [Google Scholar]
- Lynch M, Walsh B. Genetics and Analysis of Quantitative Traits. Sinauer Associates: Sunderland, MA; 1998. [Google Scholar]
- Monteiro LR, Nogueira MR. Adaptive radiations, ecological specialization, and the evolutionary integration of complex morphological structures. Evolution. 2009;64:724–744. doi: 10.1111/j.1558-5646.2009.00857.x. [DOI] [PubMed] [Google Scholar]
- Mosimann JE. Size allometry: size and shape variables with characterizations of the lognormal and generalized gamma distributions. J Am Stat Assoc. 1970;65:930–945. [Google Scholar]
- Parsons KJ, Cooper WJ, Albertson RC. Modularity of the oral jaws is linked to repeated changes in the craniofacial shape of African cichlids. Int J Evol Biol. 2011;2011:641501. doi: 10.4061/2011/641501. [DOI] [PMC free article] [PubMed] [Google Scholar]
- Peichel CL, Nereng KS, Ohgi KA, Cole BLE, Colosimo PF, Buerkley CA, et al. The genetic architecture of divergence between threespine stickleback species. Nature. 2001;414:901–905. doi: 10.1038/414901a. [DOI] [PubMed] [Google Scholar]
- Saldamando CI, Miyaguchi S, Tatsuta H, Kishino H, Bridle JR, Butlin RK. Inheritance of song and stridulatory peg number divergence between Chorthippus brunneus and C. jacobsi, two naturally hybridizing grasshopper species (Orthoptera: Acrididae) J Evol Biol. 2005;18:703–712. doi: 10.1111/j.1420-9101.2004.00838.x. [DOI] [PubMed] [Google Scholar]
- Schluter D. Adaptive radiation along genetic lines of least resistance. Evolution. 1996;50:1766–1774. doi: 10.1111/j.1558-5646.1996.tb03563.x. [DOI] [PubMed] [Google Scholar]
- Schluter D. Evidence for ecological speciation and its alternative. Science. 2009;323:737–741. doi: 10.1126/science.1160006. [DOI] [PubMed] [Google Scholar]
- Sezer M, Butlin RK. The genetic basis of oviposition preference differences between sympatric host races of the brown planthopper (Nilaparvata lugens) Proc R Soc Lond Ser B. 1998;265:2399–2405. [Google Scholar]
- Smith TB. Disruptive selection and the genetic basis of bill size polymorphism in the African finch Pyrenestes. Nature. 1993;363:618–620. [Google Scholar]
- Sota T, Ishikawa R. Phylogeny and life-history evolution in Carabus (subtribe Carabina: Coleoptera, Carabidae) based on sequences of two nuclear genes. Biol J Linn Soc. 2004;81:135–149. [Google Scholar]
- Sturani M. Osservazioni e ricerche biologishce sul genere Carabus Linnaeus (sensu lato) Mem Soc Entomol Ital. 1962;41:85–202. [Google Scholar]
- Su Z, Tominaga O, Okamoto M, Osawa S. Origin and diversification of hindwingless Damaster ground beetles within the Japanese islands as deduced from mitochondrial ND5 gene sequences (Coleoptera, Carabidae) Mol Biol Evol. 1998;15:1026–1039. doi: 10.1093/oxfordjournals.molbev.a026001. [DOI] [PubMed] [Google Scholar]
- Wagner GP, Pavlicev M, Cheverud JM. The road to modularity. Nat Rev Genet. 2007;8:921–931. doi: 10.1038/nrg2267. [DOI] [PubMed] [Google Scholar]
Associated Data
This section collects any data citations, data availability statements, or supplementary materials included in this article.


