Background: Due to renewed interest in the Warburg effect, glycolytic enzymes have garnered interest as therapeutic targets for cancer.
Results: Proliferation of transformed cell lines is halted upon aldolase knockdown using RNAi, an effect not seen upon knockdown of other glycolytic enzymes.
Conclusion: Aldolase knockdown inhibits proliferation through a non-glycolytic function, likely affecting cytokinesis.
Significance: Non-glycolytic aldolase functions represent a new potential target for cancer therapeutics.
Keywords: Cancer Biology, Carbohydrate Metabolism, Cell Proliferation, Cytokinesis, Cytoskeleton, Glycolytic Flux, Moonlighting, Warburg Effect
Abstract
In cancer, glucose uptake and glycolysis are increased regardless of the oxygen concentration in the cell, a phenomenon known as the Warburg effect. Several (but not all) glycolytic enzymes have been investigated as potential therapeutic targets for cancer treatment using RNAi. Here, four previously untargeted glycolytic enzymes, aldolase A, glyceraldehyde 3-phosphate dehydrogenase, triose phosphate isomerase, and enolase 1, are targeted using RNAi in Ras-transformed NIH-3T3 cells. Of these enzymes, knockdown of aldolase causes the greatest effect, inhibiting cell proliferation by 90%. This defect is rescued by expression of exogenous aldolase. However, aldolase knockdown does not affect glycolytic flux or intracellular ATP concentration, indicating a non-metabolic cause for the cell proliferation defect. Furthermore, this defect could be rescued with an enzymatically dead aldolase variant that retains the known F-actin binding ability of aldolase. One possible model for how aldolase knockdown may inhibit transformed cell proliferation is through its disruption of actin-cytoskeleton dynamics in cell division. Consistent with this hypothesis, aldolase knockdown cells show increased multinucleation. These results are compared with other studies targeting glycolytic enzymes with RNAi in the context of cancer cell proliferation and suggest that aldolase may be a useful target in the treatment of cancer.
Introduction
Glucose uptake and glycolysis are increased in transformed cells, regardless of the presence or absence of oxygen. Otto Warburg originally observed this phenomenon, and it is thus known as the Warburg effect (1). Because cancer cells are highly dependent on glycolysis, the expression of most glycolytic enzymes is increased (2), and this pathway has recently garnered interest as a possible target for the treatment of cancer (3). Through the use of RNAi, the glycolytic enzymes hexokinase II, phosphofructokinase 1 (PFK-1),2 phosphoglucoisomerase, pyruvate kinase M2, and lactate dehydrogenase A have been targeted in various cancer cell lines. In addition to effects on metabolism, these studies have uncovered several interesting effects on transformed cells, including cell cycle delay and increased apoptosis (hexokinase II and PFK-2) (4, 5), redirection of glucose into the pentose phosphate pathway through inhibition of PFK-1 (6), reversal of the epithelial-to-mesenchymal transition (phosphoglucoisomerase) (7, 8), expression of isoforms that provide selective advantages for tumor growth (pyruvate kinase M2) (9), and increased sensitivity to hypoxia (lactate dehydrogenase A) (10). However, knockdown of the glycolytic enzymes in these studies showed modest effects on the proliferation of transformed cells in culture (a 10–25% decrease depending on the enzyme targeted).
Other glycolytic enzymes have not been targeted by RNAi in transformed cells. In this study, four such enzymes, aldolase A, glyceraldehyde-3-phosphate dehydrogenase (GAPDH), triose-phosphate isomerase, and enolase 1, have been targeted using siRNA in Ras-transformed NIH-3T3 (Ras-3T3) cells (11–13). Among these, aldolase knockdown had the greatest effect on the proliferation of Ras-3T3 cells. This effect was shown in other cancer cell lines and was more pronounced in transformed cells than in their non-transformed parental cell lines. However, the aldolase knockdown effect was not due to loss of glycolytic capacity and rather correlated with an increase in multinucleation, suggesting a cytokinesis defect through a non-glycolytic function of aldolase consistent with known interactions of aldolase with F-actin and WASP (14, 15).
EXPERIMENTAL PROCEDURES
Tissue Culture
Mouse NIH-3T3, Ras-3T3, human A293T, Rat1, DNp53-Rat1, rat PC-12, and rat 9L were gifts of Drs. Ulla Hansen, Thomas Gilmore, Geoffrey Cooper, and David Waxman. Cells were maintained in DMEM with the appropriate serum (NIH-3T3, Ras-3T3, Rat1, and DNp53-Rat1, 10% newborn calf serum; 9L, 10% fetal bovine serum; PC-12, 10% fetal bovine serum plus 5% horse serum), 50 units/ml penicillin, and 50 mg/ml streptomycin.
Soft agar assays were performed as described previously (12). One day after siRNA transfection, cells were trypsinized, counted, and diluted to a concentration of 104 cells/ml. Cells (104) were placed in the appropriate media plus 0.3% (w/v) BactoAgar (Difco). Plates were incubated at 37 °C, 5% CO2, and colonies were counted 14 days later.
Creation of Stable Cell Lines
Plasmids used were pMSCV (Clontech), pcDNA 3.1-Myc (Invitrogen), pPB14 (rabbit aldolase A expression plasmid) (16), and pCL10-A1 (Clontech). The pMSCV-MycAldolase plasmid was constructed by PCR amplification of the rabbit aldolase A open reading frame from pPB14 (17) with primers containing restriction enzyme sites compatible for cloning into pcDNA3.1-Myc. MycAldolase was subsequently subcloned into BglII-EcoRI-digested pMSCV (Clontech) (pMSCV-MycAldolase). The pMSCV-MycD33S plasmid was created by subcloning from the pAM9 plasmid (18) into pMSCV-MycAldolase using the BamHI and SbfI restriction sites. Plasmids pMSCV, pMSCV-MycAldolase, or pMSCV-MycD33S were co-transfected with the pCL10-A1 packaging vector (Imgenex) into the packaging cell line A293T using polyethylenimine. Viral particles containing the appropriate plasmids were collected and were used to infect 9L cells as described previously (19). The population of cells that survived puromycin treatment was allowed to grow to confluence for isolation and storage.
Design of siRNAs
Three siRNAs to mouse aldolase A were designed based on algorithms for predicting potent and specific RNAi (20). Sequence-dependent silencing of off-target transcripts was minimized by comparing sequences to the mouse EST database (http://www.ncbi.nlm.nih.gov/nucest/), ensuring no significant similarity to other genes. The design ensured minimal sequence identity to rabbit aldolase A used in rescue experiments. siRNAs to the following target sequences were synthesized (Invitrogen): siRNA 287, 5′-CGCCUGCAGUCCAUUGGCA-3′; siRNA 1171, 5′-CGCUUGUCAAGGAAAGUAU-3′; and siRNA 1301, 5′-CUACCCACTUUGCUAUUGAA-3′. Verified siRNAs to GAPDH (ABI/Ambion), triose-phosphate isomerase (Qiagen), and enolase (Qiagen) were purchased.
Transfection of siRNA
Transfection of siRNAs was performed using Lipofectamine 2000 (Invitrogen) according to the manufacturer's instructions. The optimal total concentration was 25 nm (see supplemental Fig. S1). Pooled equimolar mouse aldolase siRNAs (siRNA287, siRNA1171, and siRNA1301; 8.3 nm each) were used; no siRNA was more effective than the others and there was no increased effect due to pooling (supplemental Fig. S2). All targeted enzymes showed maximal knockdown 3–4 days after transfection (supplemental Fig. S3).
Enzymatic Activity Assays and Protein Determination
Cells were washed twice with ice-cold PBS, scraped from the dish, collected by centrifugation, and resuspended in 100 μl of 20 mm HEPES, pH 7.4, 150 mm NaCl, 1 mm EDTA, 1% (v/v) Triton X-100, 1 mm DTT, and 1 μg/μl each of leupeptin, pepstatin A, and PMSF. Lysates were cleared by centrifugation at 20,000 × g for 1 h. Activity of glycolytic enzymes in the cleared lysates was determined as described previously for aldolase (17), GAPDH (21), triose-phosphate isomerase, and enolase (22) (the latter two did not use added rotenone). Protein concentration for each lysate was determined by dye-binding assay (23).
Proliferation and Cell Viability Assays
Cell proliferation was measured using three separate assays. For cell counting using a hemocytometer, medium was removed from cells and reserved. Cells were trypsinized from the plate and incubated at 37 °C for 5–10 min. Trypsinization was stopped by addition of the reserved growth media, thus accounting for both live and dead cells. An aliquot was removed, diluted 1:2 with Trypan Blue dye (0.4% (w/v)), and counted. Cell viability was determined by comparing live cells to the total number of cells. Second, relative cell numbers were determined by crystal violet staining as described previously (24). Third, cell proliferation was assessed using the Promega CellTiter 96® AQueous One Solution cell proliferation assay (MTS) based on reducing capacity of live cells was used according the manufacturer's instructions. Absorbance at 490 nm was measured after 1 h.
Immunoblotting
Protein from cleared cell lysates (25–50 μg) was separated by SDS-PAGE (12% (w/v)) and transferred to nitrocellulose using a semi-dry transfer apparatus (Bio-Rad). Blots were blocked overnight in 20 mm Tris, pH 7.5, 50 mm NaCl (TBS) containing 0.1% (v/v) Tween 20 and 5% (w/v) Carnation instant milk. For MycAldolase detection, blots were incubated with mouse anti-Myc primary antibody (Santa Cruz Biotechnology, sc-40, 1:10,000 in TBS), followed by HRP-conjugated goat anti-mouse secondary antibody (Bio-Rad, 170–6516, 1:2000 in TBS) for one h each. For actin detection, blots were incubated in the same manner using goat anti-actin primary antibody (Santa Cruz Biotechnology, sc-1616, 1:500 in TBS), followed by HRP-conjugated rabbit anti-goat secondary antibody (Pierce, 31402, 1:10,000 in TBS). Bands were visualized using SuperSignal West Dura Extended Duration Substrate (Thermo Scientific).
Determination of Glycolytic Flux
Three days after transfection with siRNA, cells were incubated in glucose-free DMEM for 24 h. A bolus of 5 mm glucose was added, and aliquots of the media were removed every 4–6 h over a 24–36 h time period and immediately frozen at −80 °C. Each aliquot was heated to 80 °C for 15 min, clarified by centrifugation at 8000 × g for 10 min at 4 °C, and used for determination of lactate (25) or glucose (26).
Determination of ATP Concentration
Several methods for ATP extraction from cells were tested as described in supplemental Table S1). The method giving the highest yield with the most precision is as follows: 4 days after transfection, cells were washed twice with PBS, scraped, and immediately frozen at −80 °C. Samples were lysed and deproteinized by incubation at 80 °C for 15 min, and clarified by centrifugation (1000 × g for 10 min). ATP concentration was determined using a luciferase-based assay per the manufacturer's instructions (Invitrogen). The [ATP] extracted using this method was on the order of 1–2 fmol/cell, consistent with other observations (27).
Staining and Microscopy
Cells grown on poly-l-lysine-coated coverslips were stained for F-actin with Alexa Fluor 488-phalloidin (5 units/ml) and for nuclei with DAPI (300 nm), and cells were treated as described in the manufacturer's instructions (Invitrogen). Cells were imaged on an Olympus IX50 microscope at 400×.
RESULTS
Aldolase Depletion Caused a Significant Decrease in Rate of Proliferation
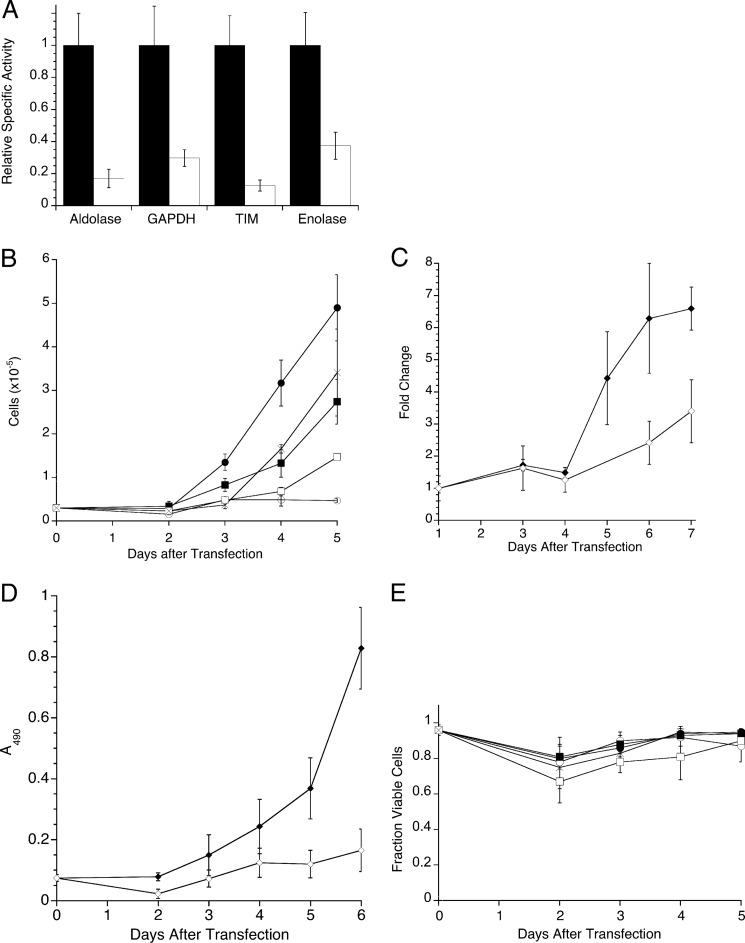
Ras-transformed mouse 3T3 fibroblasts (Ras-3T3) show hallmarks of transformation such as changes in cell morphology, lack of contact inhibition, and anchorage-independent growth (11–13). Using siRNAs, the effect of knockdown of four glycolytic enzymes, aldolase A, GAPDH, triose-phosphate isomerase, and enolase-1, was investigated. The embryonic forms of aldolase and enolase isozymes were chosen because there is generally a reversion to embryonic expression in cancer cells (28). GAPDH and triose-phosphate isomerase only have one isoform. Knockdown was monitored by loss of enzymatic activity, and at 4 days post-transfection, the degree of knockdown was maximal (supplemental Fig. S3). Four days after transfection, the activity of all four enzymes was reduced 60–80% compared with mock transfected cells (average p < 0.022) (Fig. 1A). The rate of cell proliferation was measured by counting cells present each day after transfection for 5 days. Differences in exponential rates of proliferation were seen depending on which glycolytic enzyme was targeted (Fig. 1B and supplemental Table S2). Compared with mock-transfected controls, the relative rates of proliferation of cells treated with siRNA to aldolase, GAPDH, triose-phosphate isomerase, and enolase decreased by 80, 50, 25, and 20%, respectively (supplemental Table S2). The drastic decrease in the rate of cell proliferation using siRNA to aldolase was confirmed using both crystal violet (Fig. 1C) and MTS (Fig. 1D) measurements. Cell viability was measured by trypan blue exclusion assay, and the viability of all glycolytic enzyme-knockdown cells was indistinguishable from mock-transfected cells (Fig. 1E). Therefore, the decrease in cell proliferation in aldolase-knockdown cultures was not due to an increase in cell death but to inhibition of proliferation.
FIGURE 1.
Knockdown, proliferation, and viability of Ras-3T3 cells depleted of several glycolytic enzymes. A, relative knockdown of glycolytic enzymes in Ras-3T3 cells. Cell extracts harvested 4 days after transfection were assayed for the indicated enzyme activity with and without substrate, and the no substrate control was subtracted before calculation of units/mg protein in each lysate. Relative specific activity was normalized to the specific activity of mock-transfected cells for each enzyme. Mock transfection (black) and siRNA to the indicated enzyme (white) are plotted. Experiments were done ≥3 times, and error bars are expressed as S.E. Mock transfection values used for normalization were 0.027 ± 0.003 (aldolase), 0.23 ± 0.04 (GAPDH), 1.3 ± 0.17 (triose-phosphate isomerase; TIM), and 0.12 ± 0.02 (enolase) units/mg. B, cells were plated at 2.5 × 10⁴/35 mm dish, and at the indicated time points after transfection, the number of cells for each treatment was determined using a hemocytometer and plotted for mock-transfected cells (●), and cells were transfected with aldolase siRNA (○), GAPDH siRNA (■), triose-phosphate isomerase siRNA (□), or enolase siRNA (×). Error bars represent 1 S.D. C, mock (♦) and aldolase siRNA-transfected (♢) cells were stained with crystal violet each day after transfection and plotted versus time. Values are normalized to 1 day post-transfection values for each treatment. Error bars are represented as S.D. D, mock (♦) and aldolase siRNA-transfected (♢ cells were assayed for proliferation using MTS each day after transfection. The absorbance reading at 490 nm for each treatment each day is plotted versus time. Error bars are represented as S.D. E, cells treated as in B were subjected to trypan-blue exclusion assay. Live cells were counted, normalized to total number of cells and plotted as fraction of viable cells for each treatment. Symbols and error bars are as described in B.
Aldolase Knockdown Reduces the Proliferation of Several Transformed Cell Lines
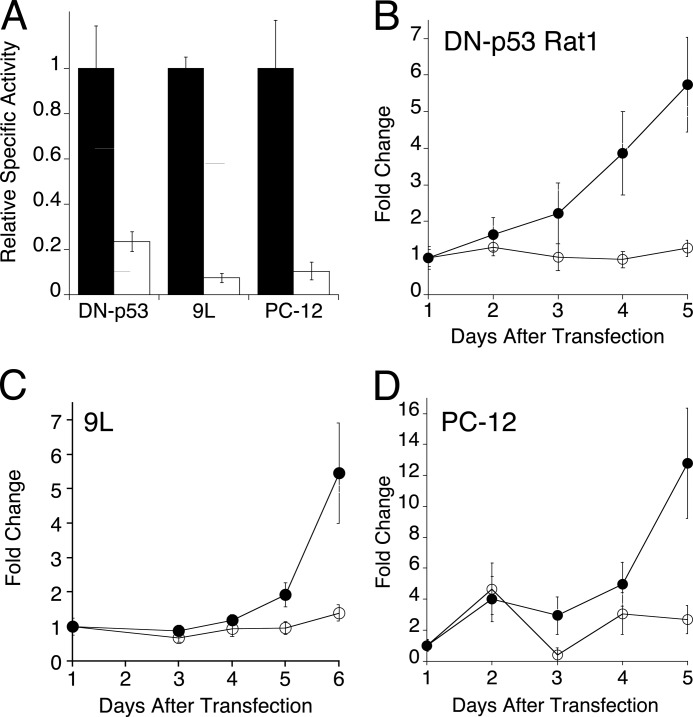
Next, the effect of aldolase knockdown on proliferation in other transformed rodent cell lines was investigated. Dominant-negative p53-transformed Rat1 fibroblast (DN-p53 Rat1) (29), rat 9L glioblastoma, and rat PC-12 pheochromocytoma cells all form tumors when injected into animals (29–31). Each of these cell lines was transfected with the same aldolase siRNAs as were used for Ras-3T3 cells. After 4 days, aldolase activity was reduced by 80–90% in each cell type (Fig. 2A). Moreover, aldolase knockdown severely reduced cell proliferation in all three cell lines (Fig. 2, B–D) as determined by crystal violet measurements. These data indicate that inhibition of cell proliferation following aldolase knockdown was likely a pervasive effect in transformed cell lines.
FIGURE 2.
Effect of aldolase depletion on proliferation in a panel of transformed cell lines. A, the indicated cell lines were transfected with siRNAs to aldolase and were monitored for aldolase activity as described in Fig. 1A. Relative activity at 4 days after transfection is plotted for mock transfection (black) and siRNA to aldolase (white) treatments. Experiments were done ≥3 times, and error bars are expressed as S.E. (B–D). For the indicated cell lines (top left of each panel), crystal violet staining determined the fold change in cell number for mock-transfected (●) and aldolase siRNA-transfected (○) cells as a function of time after transfection. Values at 1 day were used for normalization, and error bars are represented as 1 S.D.
Rescue of Aldolase Knockdown Phenotype
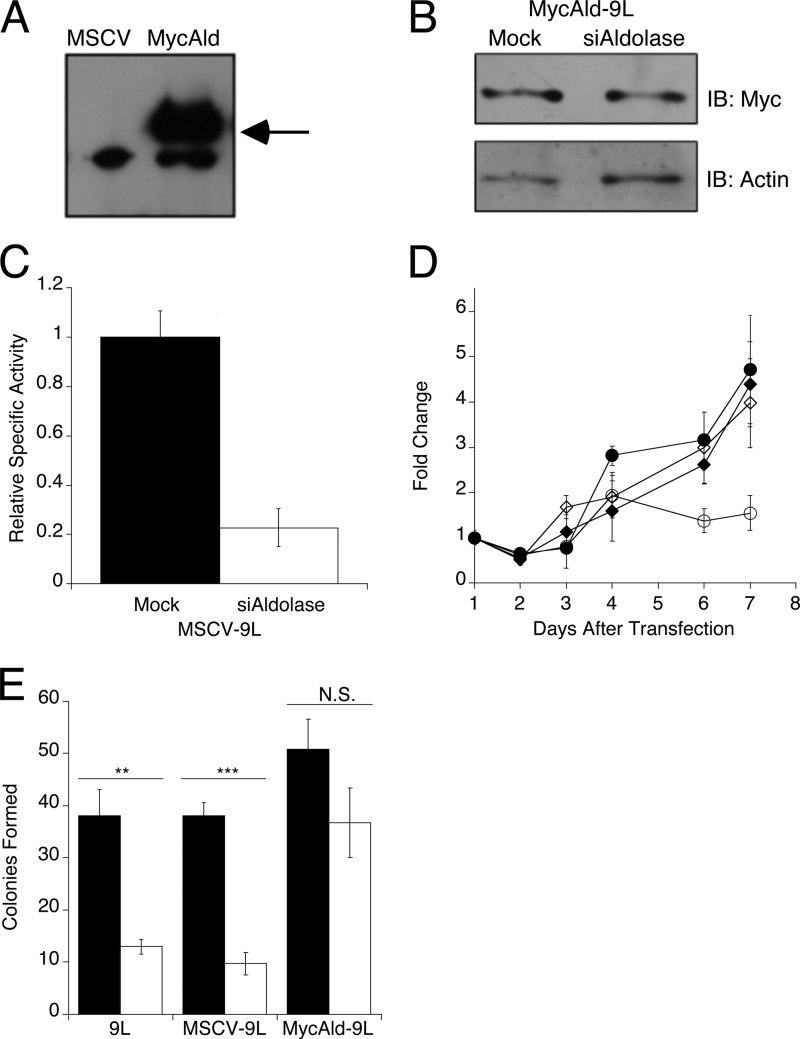
Whether the effect of aldolase knockdown on cell proliferation was specific to aldolase or was due to an off-target effect(s) was addressed by rescue with exogenous rabbit aldolase A. The siRNAs used in this study target mouse and rat aldolase A but not rabbit aldolase A. Of the four transformed cell lines tested, only the 9L and PC-12 cells were not already puromycin-resistant; therefore, 9L cells were used for these rescue experiments. Rat 9L cells were stably transduced with the pMSCV-empty vector, which served as negative control for the MycAldolase rescue, or the pMSCV-MycAldolase vector, which should demonstrate the rescue. Cells transduced by MSCV-empty (MSCV-9L) or MSCV-MycAldolase (MycAld-9L) were selected by puromycin resistance. Expression of Myc-tagged rabbit aldolase was confirmed via immunoblot (Fig. 3A). Both MSCV-9L and MycAld-9L cells were transfected with the siRNAs specific to rat aldolase A. At 4 days post-transfection, exogenous aldolase expression in MycAld-9L cells was not affected by siRNA treatment as shown by immunoblot (Fig. 3B). In contrast, MSCV-9L cells, which did not express the exogenous rabbit aldolase, showed an 80% reduction in aldolase activity as determined by aldolase activity assay (Fig. 3C).
FIGURE 3.
Rescue of 9L cells with exogenously expressed aldolase. A, anti-Myc immunoblot showing expression of Myc-tagged rabbit aldolase A in MycAld cells, but not in MSCV cells. Arrow indicates the position of 43 kDa, the expected size of the Myc-tagged aldolase. B, immunoblot showing Myc-tagged rabbit aldolase A expression in lysates following transfection of mock-treated and aldolase-knockdown (siAldolase) MycAld-9L cells. Cells were harvested 4 days after transfection, protein extracted, and assayed for MycAldolase via immunoblot. Actin was blotted as a loading control. C, MSCV-9L cells transfected with siRNAs to mouse aldolase A were monitored for knockdown by aldolase activity assay as described in Fig. 1A. Mock-transfected (0.02 ± 0.0014 units/mg) (black) and aldolase siRNA-transfected (white) values are shown. Error bars are represented as S.E. D, the number of cells/day were measured and plotted as described in Fig. 2 for mock (black) or siRNA to aldolase (open) transfected MSCV-9L (●, ○) and MycAld-9L (♦,♢) cells, respectively. Error bars are represented as 1 S.D. E, soft agar colony assay for parental 9L, MSCV-9L, or MycAld-9L mock-transfected (black) or aldolase-siRNA transfected (white) cells. After 14 days in soft agar, colonies were counted. Error bars represent 1 S.D. Statistical significance determined by t test is represented as ** (p < 0.005), triple asterisks (p < 0.001), or not significant (N.S., p > 0.05). IB, immunoblot.
Proliferation was measured using crystal violet for both mock- and aldolase siRNA-transfected MSCV-9L and MycAld-9L cells. The empty vector-transduced MSCV-9L cells showed the same proliferation defect as parental 9L cells (compare Figs. 2C and 3D). In contrast, MycAld-9L cells showed no reduction in proliferation upon aldolase knockdown as compared with mock-transfected controls. These data indicate that reduced proliferation in aldolase-knockdown 9L cells was specific to the loss of aldolase expression and was not due to an off-target effect.
The effect of aldolase knockdown on anchorage-independent growth was tested in parental 9L, MSCV-9L, and MycAld-9L cells in a soft agar assay (Fig. 3E). Each cell line was transfected with siRNA to aldolase, and 1 day after siRNA transfection, cells were placed in soft agar. After 14 days, the aldolase siRNA-treated cells formed significantly fewer colonies than mock-transfected cells in both 9L and MSCV-9L cells. In contrast, MycAld-9L cells did not show a significant difference in the number of colonies formed as compared with mock-transfected cells. These data provided a second demonstration that the knockdown of aldolase was responsible for changes in proliferation of these transformed cell lines.
Transformed Cell Lines Were more Sensitive to Aldolase Knockdown Than Their Non-transformed Counterparts
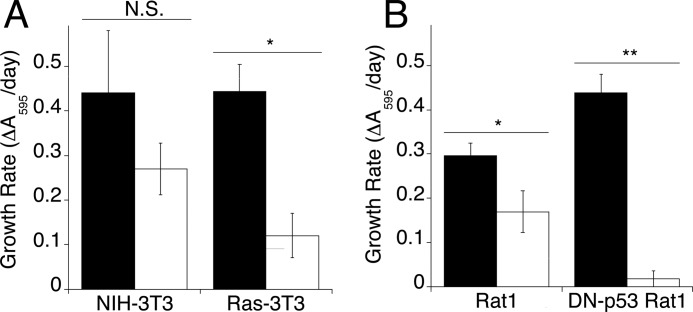
It has been shown that Ras-transformed cells are more sensitive to decreased glucose concentrations than non-transformed cells (32). It follows then that transformed cells may be more sensitive to glycolytic enzyme knockdown than non-transformed cells. Therefore, the relative sensitivity to aldolase knockdown of two parental cell lines and their transformed counterparts was tested (NIH-3T3 versus Ras-3T3, and Rat1 versus DN-p53 Rat1). These cell lines were transfected with siRNA to aldolase, and proliferation was measured for 7 days using the crystal violet assay. All cell lines showed a reduction in aldolase activity ranging from 70–90%. Upon aldolase knockdown, in both cases, cell proliferation was inhibited more in transformed cells than in non-transformed cells (Fig. 4, A and B). NIH-3T3 cells transfected with aldolase siRNA showed a decrease in the rate of proliferation of 40% (p = 0.302), whereas Ras-3T3 cells showed up to a 90% decrease (p = 0.0015) (Fig. 4A). Likewise, wild-type Rat1 cells showed a 40% decrease in the rate of proliferation (p = 0.0181), whereas DN-p53 Rat1 cells showed a 95% decrease in proliferation rate (p = 0.0001) (Fig. 4B). These data indicate that inhibition of cell proliferation following aldolase knockdown was likely a pervasive effect in transformed cell lines.
FIGURE 4.
Proliferation of transformed versus non-transformed cells derived from the same parental cell line. Growth rates were calculated from the slope of a log plot of cell number (determined by crystal violet) versus days after transfection for mock-transfected (black) or aldolase siRNA-transfected (white) cells. A, NIH-3T3 and Ras-3T3 cells; B, Rat1 and DN-p53 Rat1 cells. Error bars are represented as S.E. Statistical significance as determined by t test is represented as *, p < 0.05; **, p < 0.005; or not significant (N.S.) p > 0.05).
Aldolase Depletion Did Not Affect Glycolytic Flux or Intracellular ATP Concentration
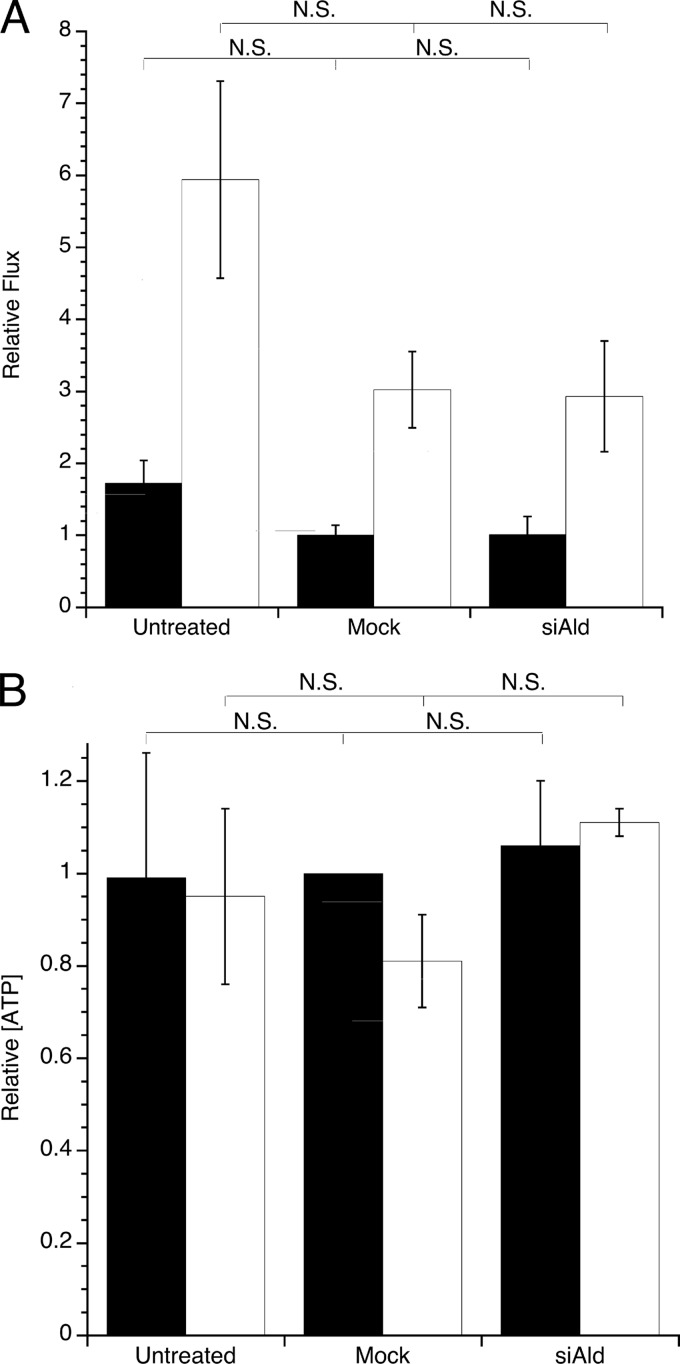
According to the Warburg effect, the glycolytic pathway is especially important for transformed cells. Thus, the effect of aldolase knockdown on energy metabolism was investigated by measuring glycolytic flux and intracellular ATP concentration following aldolase knockdown. Untreated, mock-transfected, and aldolase siRNA-transfected NIH-3T3 and Ras-3T3 cells were examined for changes in glycolytic capacity. The fluxes measured by lactate production were normalized to mock-treated NIH-3T3 cells. Consistent with glycolysis being up-regulated in transformed cells, glycolytic flux in Ras-3T3 cells was 3- to 4-fold higher than in NIH-3T3 cells regardless of treatment (Fig. 5A). However, when either NIH-3T3 or Ras-3T3 cells were mock- or aldolase siRNA-transfected, no significant difference in glycolytic flux between the two cell lines was observed. These data were supported by measuring rates of glucose consumption in Ras-3T3 cells, in which no significant differences were seen among untreated, mock-transfected, and aldolase siRNA-transfected cells (Fig. S4). Similarly, when intracellular ATP was measured, aldolase knockdown did not cause a significant change in ATP concentration in either cell line (Fig. 5B). These data showed that aldolase knockdown did not greatly interfere with cellular energy metabolism and suggest that a non-glycolytic mechanism(s) was likely causing the dramatic proliferation defect in aldolase knockdown-transformed cells.
FIGURE 5.
Glycolytic flux and intracellular ATP concentrations in aldolase siRNA-transfected Ras-3T3 cells. A, glycolytic flux was measured in NIH-3T3 (black) and Ras-3T3 (white) cells that were untreated, mock-transfected, or aldolase siRNA (siAld)-transfected using the rate of lactate production per cell. Values were normalized to NIH-3T3 mock-transfected treatment values (average 1.84 ± 0.17 × 10⁻⁷ μmol/h·cell). Error bars are represented as S.E. No significant differences were seen among any of the treatments within one cell type. B, intracellular [ATP]/cell was measured using a bioluminescence assay in NIH-3T3 (black) or Ras-3T3 (white) cell lysates after treatment as described in A. Values are normalized to NIH-3T3 mock-transfected treatment values (average value 0.1 fmol/cell). Error bars are represented as S.E. No significant differences were seen among any of the treatments within one cell type.
Aldolase Activity Is Not Required for Rescue of the Proliferation Defect
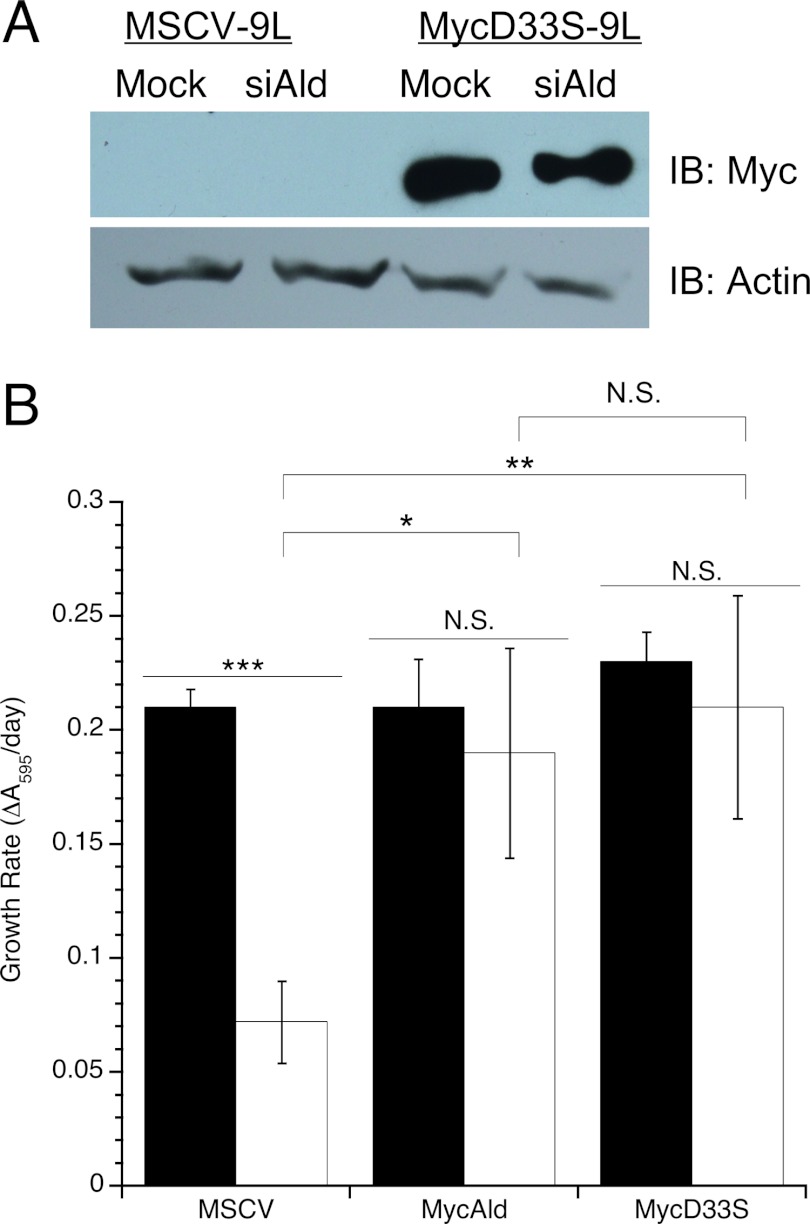
The data presented above (Fig. 5) suggested a non-catalytic role for aldolase was responsible for this proliferation defect. This mechanism was further tested using the catalytically inactive D33S-aldolase variant. This variant has been been described previously to have a 6000-fold decrease in kcat, while retaining wild type actin binding capability (18). The D33S mutation was subcloned into the MycAldolase expression vector and stably expressed in 9L cells (MycD33S-9L). Expression was confirmed by immunoblot and was not affected by knockdown of the endogenous mouse aldolase A (Fig. 6A). D33S-aldolase was tested for its ability to rescue the proliferation defect seen after knockdown of endogenous aldolase. Proliferation was measured using crystal violet for mock- and aldolase siRNA-transfected MSCV-, MycAldolase-, and MycD33S-9L cells. The significant decrease in proliferation after treatment with aldolase siRNA in MSCV-9L cells was rescued by expression of both wild type MycAldolase and the inactive MycD33S variant (Fig. 6B). Both MycAld-9L and MycD33S-9L aldolase siRNA-treated cells proliferated significantly faster than the MSCV-9L control but were not significantly different from each other. These data provided further evidence that the proliferation defect seen with aldolase knockdown was not due to the catalytic function of aldolase.
FIGURE 6.
Catalytically dead D33S-aldolase rescues proliferation defect. A, immunoblot of MSCV-9L and MycAld-9L cells that were mock- or aldolase siRNA-transfected (Mock or siAld). Cells were harvested 4 days post transfection, and protein was extracted and assessed for MycAldolase expression via immunoblot (IB; top row). Actin was blotted as a loading control (bottom row). B, comparison of growth rates for MSCV-, MycAld-, and MycD33S-9L cells that were mock- (black) or aldolase siRNA (white)-transfected. Cells were stained with crystal violet each day after transfection. Rates were determined and compared by plotting ln A570 versus time. Each treatment was performed in triplicate, and error bars are expressed as 1 S.D. *, p < 0.05; **, p < 0.005; ***, p < 0.001, or not significant (N.S.), p > 0.05.
Aldolase Knockdown Resulted in Multinucleated Cells
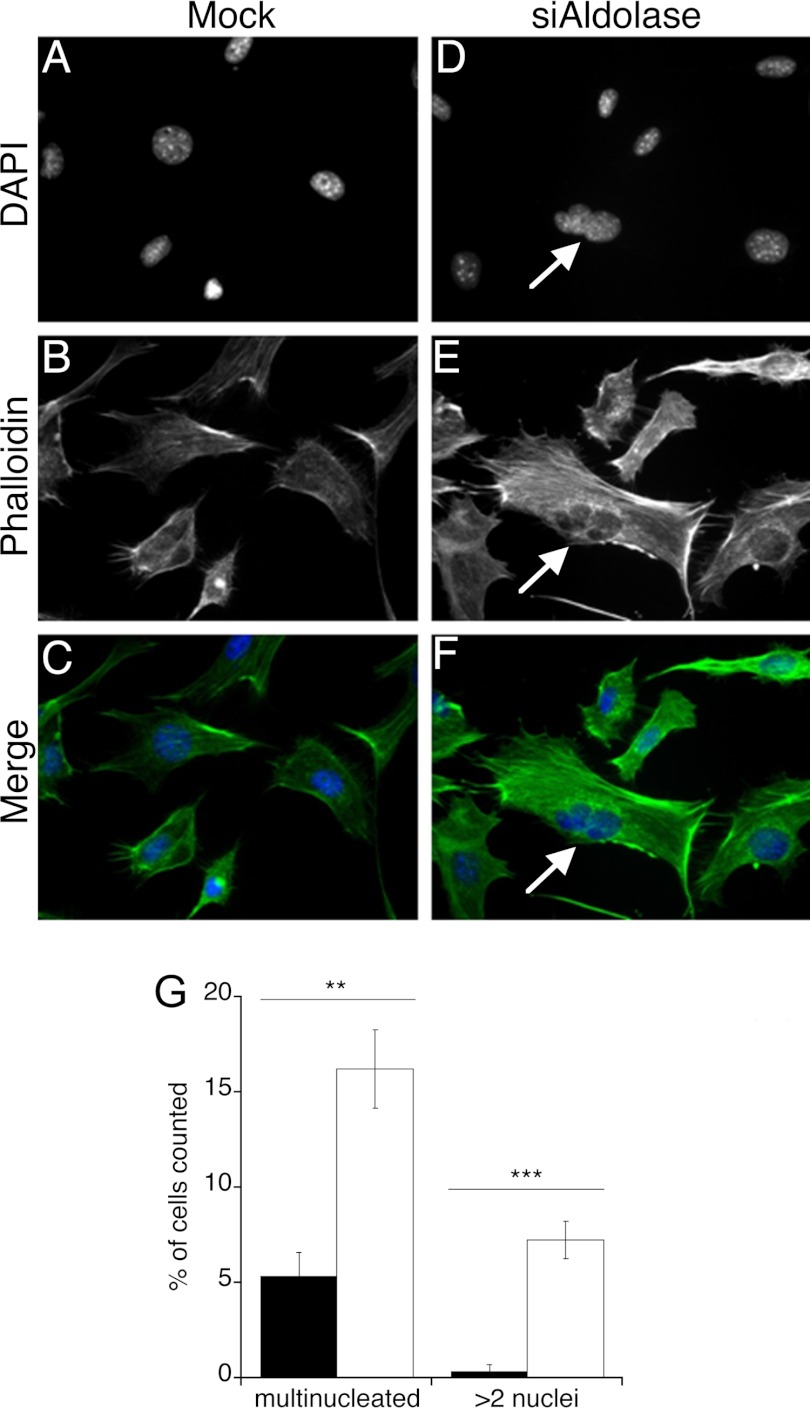
The data described above clearly establish a mechanism behind the cell proliferation defect that does not involve aldolase catalytic activity. In addition to its roles in metabolism, aldolase has been implicated in several so-called “moonlighting” functions, which are distinct from its metabolic roles (see below). Although most of these moonlighting functions have not been thoroughly investigated, it is clear that many of these purported aldolase moonlighting functions involve interactions with F-actin, with which aldolase clearly interacts both in vitro (14, 18, 33) and in vivo (34, 35). F-actin is also involved in the cell cycle, most notably in cytokinesis. Therefore, the possibility of a cytokinesis defect was investigated in the aldolase knockdown cells. Four days after either mock- or aldolase siRNA-transfection, Ras-3T3 cells were stained for nuclei and counterstained with phalloidin. Multinucleated cells were counted for each treatment (Fig. 7, A–F). Mock-transfected Ras-3T3 cells showed 5% binucleated cells. In contrast, aldolase knockdown cells had a 3-fold increase multinucleated cells (16%) (Fig. 7G). Furthermore, almost half of multinucleated cells in the aldolase siRNA cultures showed >2 nuclei. These results suggested that the severe decrease in cell proliferation caused by aldolase knockdown was due to a cell cycle defect, likely during the cytokinesis step, which plausibly involves the actin binding of aldolase and not its catalytic function.
FIGURE 7.
Increased multinucleation in aldolase siRNA-transfected Ras-3T3 cells. A–F, representative images of mock-transfected (A–C) and aldolase siRNA-transfected (D–F) Ras-3T3 cells stained for nuclei (DAPI) (A and D), counterstained with Alexa Fluor 488 phalloidin (B and E), or the merged images (C and F) are depicted. An arrow indicates the presence of multiple nuclei in one cell. G, quantification of the percentage of multinucleated cells and percentage of cells with >2 nuclei for mock-transfected (black) or aldolase siRNA-transfected (white) Ras-3T3 cells. The experiment was performed ≥4 times, and at least 50 cells were counted for each treatment. Error bars are represented as S.E., and significance is represented as double asterisks (p < 0.005) or triple asterisks (p < 0.001).
DISCUSSION
Cancer cells up-regulate a number of different pathways to keep up with the demands of providing biomass for rapidly dividing cells (36). Glycolysis is one such pathway (2), which is up-regulated in transformed cells regardless of the presence or absence of oxygen (1). Furthermore, several anabolic biosynthetic pathways such as the pentose phosphate shunt, phospholipid synthesis, and amino acid biosynthesis begin with intermediates in the glycolytic pathway. Thus, glycolytic enzymes are potential targets for interfering with proliferation and growth in cancer (36). The data presented here showed the consequences of knockdown of several glycolytic enzymes on transformed cells. Of the glycolytic enzymes targeted in this study, knockdown of aldolase had the most drastic effects on proliferation. However, when effects on glycolytic flux and energy metabolism were investigated, aldolase knockdown affected neither, which indicated that loss of aldolase affects a non-glycolytic (moonlighting) function of aldolase.
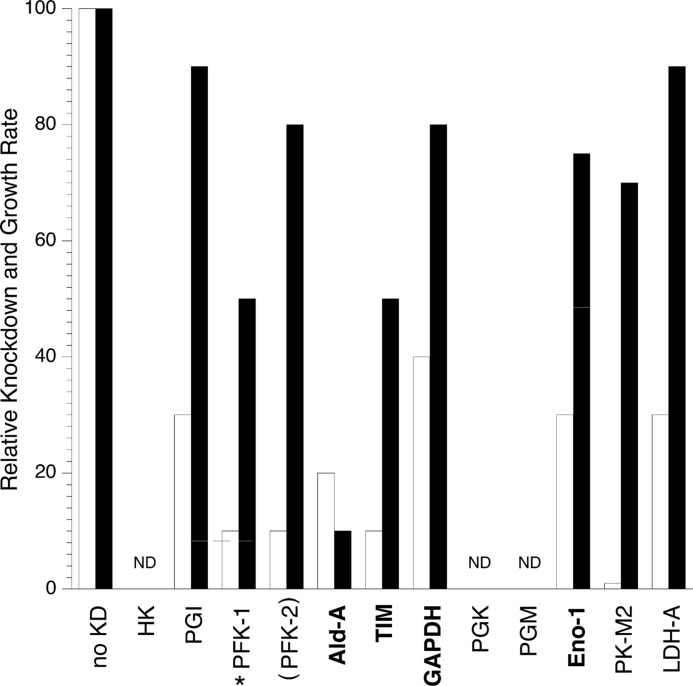
Including data presented here, nine of the eleven glycolytic enzymes, plus the regulatory enzyme PFK-2, have been investigated using RNAi in transformed cell lines. For most enzymes studied, the knockdown ranged from 60–100% (Fig. 8, white bars); however, the decrease in rate of proliferation in culture was modest (5–50%, Fig. 8, black bars). The striking exception was aldolase, which inhibited cell proliferation up to 90%. This unusual dependence on aldolase for proliferation was shown across several transformed cell lines in both monolayer and anchorage-independent growth assays (see Figs. 1B, 2, B–D, and 3E). An effect on anchorage independent growth is observed for knockdown of other glycolytic enzymes in transformed cell lines, both in the context of soft agar colony formation, as seen with hexokinase II and PFK-2 (4, 5), and tumor formation and growth in mice, as seen with depletion of hexokinase II, phosphoglucoisomerase, pyruvate kinase M2, and lactate dehydrogenase A (4, 7, 9, 10). The effect of aldolase depletion in soft agar (75% decrease in colony formation; see Fig. 3E) was on par with RNAi directed against other glycolytic enzymes in similar soft agar colony formation or tumor formation assays in mice (60–100% decrease).
FIGURE 8.
Comparison of the effects of glycolytic enzyme depletion on proliferation in transformed cell lines. Relative protein expression (white) and relative rates of proliferation (black) for RNAi-treated cells for each enzyme were normalized to the controls for protein expression or cell proliferation, respectively. Boldface type indicates enzymes investigated in this study. Enzymes are shown in the order of the reactions they catalyze in the glycolytic pathway (although PFK-2 is not directly involved in glycolytic reactions, it is a positive regulator of PFK-1, and its knockdown is functionally equivalent to inhibition of PFK-1; thus, it is depicted in parentheses): no knockdown (KD; no RNAi), hexokinase (HK), phosphoglucoisomerase (PGI) (7), phosphofructokinase-1 (PFK-1) (6), phosphofructokinase-2 (PFK-2) (5), aldolase A (Ald-A), triose-phosphate isomerase, GAPDH, phosphoglycerate kinase (PGK) (4), phosphoglycerate mutase (PGM), enolase-1 (Eno-1), PK-M2 (9), lactate dehydrogenase-A (LDH-A; 10). ND indicates no report of this enzyme affecting growth of cells in culture. All data are for cells grown under normoxic conditions with the exception of PFK-1, which was measured under hypoxic conditions and is indicated by an asterisk.
Moreover, transformed cells were more sensitive to aldolase depletion than their parental non-transformed cell lines in the case of two different oncogenes (v-Ras and dominant-negative p53). Knockdown of aldolase caused proliferation defects in both non-transformed and transformed cells, but the effect on transformed cells was 2-fold greater. The increased sensitivity to aldolase knockdown, as reflected in their proliferation rate, was similar in both Ras-3T3 and DN-p53-Rat1 cells, indicating that transformation in general, and not transformation by a specific mechanism, confers this sensitivity. Of the other studies that depleted glycolytic enzymes in transformed cells, only one made a comparison to non-transformed counterparts (10). In this study of lactate dehydrogenase A knockdown, there was no effect on non-transformed counterpart and only an ∼10% decrease in proliferation following knockdown in transformed cells in culture. This was unlike the dramatic difference shown here following knockdown of aldolase in Ras-3T3 and NIH 3T3 cells. This accentuated effect of aldolase knockdown on transformed versus non-transformed cells has implications for selective cancer therapies targeting aldolase.
Compared with cells with other glycolytic enzymes targeted by RNAi, aldolase knockdown caused the largest decrease in cell proliferation (see Figs. 1B and 8). This observation by itself suggested that the cause of this defect was unrelated to energy metabolism. This hypothesis was supported by showing that knockdown of aldolase did not significantly affect glycolytic flux, did not significantly affect intracellular ATP concentration (see Fig. 5), and could be rescued by an inactive variant (see Fig. 6). Its interesting that knockdown of almost any glycolytic enzyme as much as 80–90% has little effect on glycolysis (9, 10) (supplemental Fig S5), although some showed slight decreases in lactate and/or [ATP] (9), with the most significant drop in [ATP] caused by lactate dehydrogenase A knockdown (10). This phenomenon can be explained by the fact that for some tissues, the activity of glycolytic enzymes is 10–1000-fold higher than maximally required glycolytic flux (37).
These studies suggest that another cellular function of aldolase is responsible for the proliferation defect of transformed cells. Moreover, aldolase knockdown affected the proliferation of non-transformed cells, making this cellular function of aldolase not exclusive to transformed cell lines, but like many cellular functions, a process that is exploited when cells become transformed. In addition to its roles in metabolism, aldolase has been implicated in several so-called moonlighting functions, which are distinct from its metabolic roles. These non-glycolytic functions of aldolase include roles in signal transduction (38–41), vesicle trafficking (42, 43), and cell motility (15, 44). As mentioned previously, many of these moonlighting functions may involve the interaction of aldolase with the F-actin cytoskeleton (18, 34, 35). F-actin is involved in cell division, where it is critical for formation of the cleavage furrow during cytokinesis (45). Increased multinucleation in aldolase knockdown transformed cells is consistent with aberrant cytokinesis and/or a requirement for aldolase for proper progression through the cell cycle. However, perturbation of the actin cytoskeleton in the cell can result in defects earlier in the cell cycle. Treatment of cells cytochalsin D and latrunculin A cause cell cycle arrest at G1, inhibition of kinetochore-microtubule elongation, and mitosis delay (46–49). Furthermore, a bioinformatics search for possible aldolase binding partners found putative partners that included cyclin H and anaphase promoting complex subunit 4, two proteins involved in regulation of cell cycle and mitosis, respectively (15). These interactions have not been confirmed in vivo.
Additionally, aldolase binds WASP and N-WASP, activators of Arp2/3 in actin polymerization (41), and the binding site for WASP on aldolase has been determined by x-ray crystallography (50). The roles of WASP family members in cell motility, morphology, and endocytosis have been extensively studied (for review, see Ref. 51). Less is known about the role of WASP in cell proliferation. Several reports show that activity and expression of WASP must be controlled properly for cells to proliferate correctly. Overexpression of a constitutively active WASPI294T variant in U937 myeloid cells causes a decrease in growth rate and cytokinesis defects leading to multinucleate cells (52), similar to what is seen in aldolase knockdown cells (see Fig. 7). A decrease in WASP can cause similar phenotypes. Knock-out of the Caenorhabditis elegans WASP homolog wsp1 results in cytokinesis defects (53). N-WASP knockdown in HeLa cells also causes proliferation defects and multinucleate cells, and N-WASP is required for proper chromosome congression and segregation (54). If aldolase is a modulator of WASP activity, then aldolase knockdown could lead to misregulation of WASP, disrupting actin dynamics and the cell cycle.
An essential step in determining the mechanistic role of aldolase in cell proliferation is to dissect its catalytic functions from its moonlighting functions. The catalytically inactive D33S-aldolase rescued the knockdown-induced proliferation defect, which is consistent with a moonlighting function and not a catalytic function for aldolase in cell proliferation. Moreover, this variant retains its ability to bind actin (18) and likely retains the ability to bind WASP as determined by its binding site in a crystal structure of the aldolase-WASP complex (50). Taken together, the mechanism of aldolase in cell proliferation likely involves a non-catalytic moonlighting function.
Because the effect of aldolase knockdown on transformed cell proliferation is apparently not dependent on its glycolytic function, aldolase could be an interesting target for potential cancer therapies. Inhibitors of glycolysis such as 2-deoxyglucose and 3-bromopyruvate have required large dosages (μm to mm range) in both cells and xenographic mouse models and have had mixed results in clinical trials (for review, see Refs. 3 and 55). However, a combinatorial approach targeting general glycolysis and aldolase-specific non-metabolic functions could be envisioned using known inhibitors of glycolysis, such as 2-deoxyglucose, along with RNAi or inhibitors of aldolase moonlighting function(s). The apparent sensitivity of transformed cells to aldolase knockdown makes this enzyme an attractive therapeutic target.
Supplementary Material
Acknowledgments
We thank Dr. Thomas Gilmore for cell lines, plasmids, and critical reading of the manuscript and Dr. Aaron Morris for help with siRNA design. We thank Drs. Geoffrey Cooper, Ulla Hansen, and David Waxman for cell lines and Dr. Francisco Naya for plasmids. We appreciate Drs. David Waxman and Erin Coffee for critical reading of the manuscript

This article contains supplemental “Methods,” Tables S1–S3, and Figs. S1–S5.
- PFK-1
- phosphofructokinase-1
- Ras-3T3
- vRas-transformed NIH-3T3 cells
- DNp53-Rat1
- dominant-negative p53-transformed Rat1 cells
- WASp
- Wiskott-Aldrich Syndrome protein.
REFERENCES
- 1. Warburg O., Wind F., Negelein E. (1927) The metabolism of tumors in the body. J. Gen. Physiol. 8, 519–530 [DOI] [PMC free article] [PubMed] [Google Scholar]
- 2. Dang C. V., Semenza G. L. (1999) Oncogenic alterations of metabolism. Trends Biochem. Sci. 24, 68–72 [DOI] [PubMed] [Google Scholar]
- 3. Chen Z., Lu W., Garcia-Prieto C., Huang P. (2007) The Warburg effect and its cancer therapeutic implications. J. Bioenerg. Biomembr. 39, 267–274 [DOI] [PubMed] [Google Scholar]
- 4. Peng Q., Zhou Q., Zhou J., Zhong D., Pan F., Liang H. (2008) Stable RNA interference of hexokinase II gene inhibits human colon cancer LoVo cell growth in vitro and in vivo. Cancer. Biol. Ther. 7, 1128–1135 [DOI] [PubMed] [Google Scholar]
- 5. Calvo M. N., Bartrons R., Castaño E., Perales J. C., Navarro-Sabaté A., Manzano A. (2006) PFKFB3 gene silencing decreases glycolysis, induces cell-cycle delay and inhibits anchorage-independent growth in HeLa cells. FEBS Lett. 580, 3308–3314 [DOI] [PubMed] [Google Scholar]
- 6. Yi W., Clark P. M., Mason D. E., Keenan M. C., Hill C., Goddard W. A., 3rd, Peters E. C., Driggers E. M., Hsieh-Wilson L. C. (2012) Phosphofructokinase 1 glycosylation regulates cell growth and metabolism. Science 337, 975–980 [DOI] [PMC free article] [PubMed] [Google Scholar]
- 7. Funasaka T., Hu H., Yanagawa T., Hogan V., Raz A. (2007) Down-regulation of phosphoglucose isomerase/autocrine motility factor results in mesenchymal-to-epithelial transition of human lung fibrosarcoma cells. Cancer Res. 67, 4236–4243 [DOI] [PubMed] [Google Scholar]
- 8. Watanabe H., Takehana K., Date M., Shinozaki T., Raz A. (1996) Tumor cell autocrine motility factor is the neuroleukin/phosphohexose isomerase polypeptide. Cancer Res. 56, 2960–2963 [PubMed] [Google Scholar]
- 9. Christofk H. R., Vander Heiden M. G., Harris M. H., Ramanathan A., Gerszten R. E., Wei R., Fleming M. D., Schreiber S. L., Cantley L. C. (2008) The M2 splice isoform of pyruvate kinase is important for cancer metabolism and tumour growth. Nature 452, 230–233 [DOI] [PubMed] [Google Scholar]
- 10. Fantin V. R., St-Pierre J., Leder P. (2006) Attenuation of LDH-A expression uncovers a link between glycolysis, mitochondrial physiology, and tumor maintenance. Cancer Cell 9, 425–434 [DOI] [PubMed] [Google Scholar]
- 11. Gapuzan M. E., Schmah O., Pollock A. D., Hoffmann A., Gilmore T. D. (2005) Immortalized fibroblasts from NF-κB RelA knockout mice show phenotypic heterogeneity and maintain increased sensitivity to tumor necrosis factor α after transformation by v-Ras. Oncogene 24, 6574–6583 [DOI] [PubMed] [Google Scholar]
- 12. Gapuzan M. E., Yufit P. V., Gilmore T. D. (2002) Immortalized embryonic mouse fibroblasts lacking the RelA subunit of transcription factor NF-κB have a malignantly transformed phenotype. Oncogene 21, 2484–2492 [DOI] [PubMed] [Google Scholar]
- 13. Shimizu K., Goldfarb M., Suard Y., Perucho M., Li Y., Kamata T., Feramisco J., Stavnezer E., Fogh J., Wigler M. H. (1983) Three human transforming genes are related to the viral ras oncogenes. Proc. Natl. Acad. Sci. U.S.A. 80, 2112–2116 [DOI] [PMC free article] [PubMed] [Google Scholar]
- 14. Arnold H., Pette D. (1970) Binding of aldolase and triosephosphate dehydrogenase to F-actin and modification of catalytic properties of aldolase. Eur. J. Biochem. 15, 360–366 [DOI] [PubMed] [Google Scholar]
- 15. Buscaglia C. A., Penesetti D., Tao M., Nussenzweig V. (2006) Characterization of an aldolase-binding site in the Wiskott-Aldrich syndrome protein. J. Biol. Chem. 281, 1324–1331 [DOI] [PubMed] [Google Scholar]
- 16. Beernink P. T., Tolan D. R. (1992) Construction of a high-copy “ATG vector” for expression in Escherichia coli. Protein Expr. Purif. 3, 332–336 [DOI] [PubMed] [Google Scholar]
- 17. Morris A. J., Tolan D. R. (1993) Site-directed mutagenesis identifies aspartate 33 as a previously unidentified critical residue in the catalytic mechanism of rabbit aldolase A. J. Biol. Chem. 268, 1095–1100 [PubMed] [Google Scholar]
- 18. Wang J., Morris A. J., Tolan D. R., Pagliaro L. (1996) The molecular nature of the F-actin binding activity of aldolase revealed with site-directed mutants. J. Biol. Chem. 271, 6861–6865 [PubMed] [Google Scholar]
- 19. Gilmore T. D., Jean-Jacques J., Richards R., Cormier C., Kim J., Kalaitzidis D. (2003) Stable expression of the avian retroviral oncoprotein v-Rel in avian, mouse, and dog cell lines. Virology 316, 9–16 [DOI] [PubMed] [Google Scholar]
- 20. Reynolds A., Leake D., Boese Q., Scaringe S., Marshall W. S., Khvorova A. (2004) Rational siRNA design for RNA interference. Nat. Biotechnol. 22, 326–330 [DOI] [PubMed] [Google Scholar]
- 21. Knight R. J., Kofoed K. F., Schelbert H. R., Buxton D. B. (1996) Inhibition of glyceraldehyde-3-phosphate dehydrogenase in post-ischaemic myocardium. Cardiovasc. Res. 32, 1016–1023 [DOI] [PubMed] [Google Scholar]
- 22. Brooks D. E. (1976) Activity and androgenic control of glycolytic enzymes in the epididymis and epididymal spermatozoa of the rat. Biochem. J. 156, 527–537 [DOI] [PMC free article] [PubMed] [Google Scholar]
- 23. Bradford M. M. (1976) A rapid and sensitive method for the quantitation of microgram quantities of protein utilizing the principle of protein-dye binding. Anal. Biochem. 72, 248–254 [DOI] [PubMed] [Google Scholar]
- 24. Kueng W., Silber E., Eppenberger U. (1989) Quantification of cells cultured on 96-well plates. Anal. Biochem. 182, 16–19 [DOI] [PubMed] [Google Scholar]
- 25. Gutman I., Wahlefeld A. W. (1983). in Methods of Enzymatic Analysis (Bergmeyer H. U., ed.), 3rd Ed., pp. 1464–1468, Academic Press, Inc., New York [Google Scholar]
- 26. Bergmeyer H. U., Bernt E. (1974) d-Glucose: Determination with glucose oxidase and peroxidase in Methods of Enzymatic Analysis (Bergmeyer H. U., ed.), 2nd Ed., pp. 1205–1212, Academic Press, New York [Google Scholar]
- 27. Puschner B., Schacht J. (1997) Energy metabolism in cochlear outer hair cells in vitro. Hear Res. 114, 102–106 [DOI] [PubMed] [Google Scholar]
- 28. Guguen-Guillouzo C., Szajnert M. F., Glaise D., Gregori C., Schapira F. (1981) Isozyme differentiation of aldolase and pyruvate kinase in fetal, regenerating, preneoplastic, and malignant rat hepatocytes during culture. In Vitro 17, 369–377 [DOI] [PubMed] [Google Scholar]
- 29. Appleman L. J., Uyeki J., Frey A. B. (1995) Mouse embryo fibroblasts transformed by activated ras or dominant-negative p53 express cross-reactive tumor rejection antigens. Int. J. Cancer 61, 887–894 [DOI] [PubMed] [Google Scholar]
- 30. Keng P. C., Siemann D. W., Wheeler K. T. (1984) Comparison of tumour age response to radiation for cells derived from tissue culture or solid tumours. Br. J. Cancer 50, 519–526 [DOI] [PMC free article] [PubMed] [Google Scholar]
- 31. Hatton J. D., Lechtman A. N., U H. S. (1992) Formation of PC12 tumors after transplantation into rat brains: dependence of time course on host age. Cancer Res. 52, 1933–1937 [PubMed] [Google Scholar]
- 32. Chiaradonna F., Magnani C., Sacco E., Manzoni R., Alberghina L., Vanoni M. (2005) Acquired glucose sensitivity of K-ras transformed fibroblasts. Biochem. Soc. Trans. 33, 297–299 [DOI] [PubMed] [Google Scholar]
- 33. Arnold H., Pette D. (1968) Binding of glycolytic enzymes to structure proteins of the muscle. Eur. J. Biochem. 6, 163–171 [DOI] [PubMed] [Google Scholar]
- 34. Wang J., Tolan D. R., Pagliaro L. (1997) Metabolic compartmentation in living cells: structural association of aldolase. Exp. Cell Res. 237, 445–451 [DOI] [PubMed] [Google Scholar]
- 35. Pagliaro L., Taylor D. L. (1992) 2-Deoxyglucose and cytochalasin D modulate aldolase mobility in living 3T3 cells. J. Cell Biol. 118, 859–863 [DOI] [PMC free article] [PubMed] [Google Scholar]
- 36. Vander Heiden M. G., Cantley L. C., Thompson C. B. (2009) Understanding the Warburg effect: the metabolic requirements of cell proliferation. Science 324, 1029–1033 [DOI] [PMC free article] [PubMed] [Google Scholar]
- 37. Fell D. A. (1997) Understanding the Control of Metabolism, pp. 90–92 Portland Press, London [Google Scholar]
- 38. Orosz F., Christova T. Y., Ovádi J. (1988) Modulation of phosphofructokinase action by macromolecular interactions. Quantitative analysis of the phosphofructokinase-aldolase-calmodulin system. Biochim. Biophys. Acta 957, 293–300 [DOI] [PubMed] [Google Scholar]
- 39. Kim J. H., Lee S., Kim J. H., Lee T. G., Hirata M., Suh P. G., Ryu S. H. (2002) Phospholipase D2 directly interacts with aldolase via its PH domain. Biochemistry 41, 3414–3421 [DOI] [PubMed] [Google Scholar]
- 40. Baron C. B., Ozaki S., Watanabe Y., Hirata M., LaBelle E. F., Coburn R. F. (1995) Inositol 1,4,5-trisphosphate binding to porcine tracheal smooth muscle aldolase. J. Biol. Chem. 270, 20459–20465 [DOI] [PubMed] [Google Scholar]
- 41. Ishida A., Tada Y., Nimura T., Sueyoshi N., Katoh T., Takeuchi M., Fujisawa H., Taniguchi T., Kameshita I. (2005) Identification of major Ca2+/calmodulin-dependent protein kinase phosphatase-binding proteins in brain: biochemical analysis of the interaction. Arch. Biochem. Biophys. 435, 134–146 [DOI] [PubMed] [Google Scholar]
- 42. Kao A. W., Noda Y., Johnson J. H., Pessin J. E., Saltiel A. R. (1999) Aldolase mediates the association of F-actin with the insulin-responsive glucose transporter GLUT4. J. Biol. Chem. 274, 17742–17747 [DOI] [PubMed] [Google Scholar]
- 43. Lundmark R., Carlsson S. R. (2004) Regulated membrane recruitment of dynamin-2 mediated by sorting nexin 9. J. Biol. Chem. 279, 42694–42702 [DOI] [PubMed] [Google Scholar]
- 44. Jewett T. J., Sibley L. D. (2003) Aldolase forms a bridge between cell surface adhesins and the actin cytoskeleton in apicomplexan parasites. Mol. Cell 11, 885–894 [DOI] [PubMed] [Google Scholar]
- 45. Marks J., Hagan I. M., Hyams J. S. (1986) Growth polarity and cytokinesis in fission yeast: the role of the cytoskeleton. J. Cell Sci Suppl. 5, 229–241 [DOI] [PubMed] [Google Scholar]
- 46. Lee K., Song K. (2007) Actin dysfunction activates ERK1/2 and delays entry into mitosis in mammalian cells. Cell Cycle 6, 1487–1495 [PubMed] [Google Scholar]
- 47. Forer A., Spurck T., Pickett-Heaps J. D. (2007) Actin and myosin inhibitors block elongation of kinetochore fibre stubs in metaphase crane-fly spermatocytes. Protoplasma 232, 79–85 [DOI] [PubMed] [Google Scholar]
- 48. Rosenblatt J., Cramer L. P., Baum B., McGee K. M. (2004) Myosin II-dependent cortical movement is required for centrosome separation and positioning during mitotic spindle assembly. Cell 117, 361–372 [DOI] [PubMed] [Google Scholar]
- 49. Uzbekov R., Kireyev I., Prigent C. (2002) Centrosome separation: respective role of microtubules and actin filaments. Biol. Cell 94, 275–288 [DOI] [PubMed] [Google Scholar]
- 50. St-Jean M., Izard T., Sygusch J. (2007) A hydrophobic pocket in the active site of glycolytic aldolase mediates interactions with Wiskott-Aldrich syndrome protein. J. Biol. Chem. 282, 14309–14315 [DOI] [PubMed] [Google Scholar]
- 51. Pollitt A. Y., Insall R. H. (2009) WASP and SCAR/WAVE proteins: the drivers of actin assembly. J. Cell Sci. 122, 2575–2578 [DOI] [PMC free article] [PubMed] [Google Scholar]
- 52. Moulding D. A., Blundell M. P., Spiller D. G., White M. R., Cory G. O., Calle Y., Kempski H., Sinclair J., Ancliff P. J., Kinnon C., Jones G. E., Thrasher A. J. (2007) Unregulated actin polymerization by WASp causes defects of mitosis and cytokinesis in X-linked neutropenia. J. Exp. Med. 204, 2213–2224 [DOI] [PMC free article] [PubMed] [Google Scholar]
- 53. Withee J., Galligan B., Hawkins N., Garriga G. (2004) Caenorhabditis elegans WASP and Ena/VASP proteins play compensatory roles in morphogenesis and neuronal cell migration. Genetics 167, 1165–1176 [DOI] [PMC free article] [PubMed] [Google Scholar]
- 54. Park S. J., Takenawa T. (2011) Neural Wiskott-Aldrich syndrome protein is required for accurate chromosome congression and segregation. Mol. Cells 31, 515–521 [DOI] [PMC free article] [PubMed] [Google Scholar]
- 55. Tennant D. A., Durán R. V., Gottlieb E. (2010) Targeting metabolic transformation for cancer therapy. Nat. Rev. Cancer 10, 267–277 [DOI] [PubMed] [Google Scholar]
Associated Data
This section collects any data citations, data availability statements, or supplementary materials included in this article.


