

Abstract
Ryanodine receptors (RyRs) are the major ion channels in the sarcoplasmic reticulum responsible for Ca2+ release in muscle cells. Localization of RyRs is therefore critical to our understanding of Ca2+ cycling and Ca2+-dependent processes within ventricular cells. Recently, RyRs were reportedly found in non-classical locations in the middle of the sarcomere, between perinuclear mitochondria and in the inner mitochondrial membrane of cardiac mitochondria. However, for multiple reasons these reports could not be considered conclusive. Therefore, we modified immunogold labeling to visualize the distribution of RyRs in ventricular myocytes. Using antibodies to the voltage-dependent anion channel (i.e. VDAC) or cytochrome c along with our labeling method, we showed that these mitochondrial proteins were appropriately localized to the mitochondrial outer and inner membrane respectively. Immunogold labeling of ultrathin sections of intact and permeabilized ventricular myocytes with antibodies to three types of RyRs confirmed the existence of RyRs between the Z-lines and around the perinuclear mitochondria. However, we did not find any evidence to support localization of RyRs to the mitochondrial inner membrane.
Keywords: RyR, Ultrastructure of cardiomyocyte, Electron microscopy, Cytochrome c, VDAC, Mitochondria
Introduction
Ryanodine receptors (RyRs) are Ca2+-permeable ion channels in the membrane of the sarcoplasmic reticulum (SR). In ventricular cardiomyocytes, RyRs are responsible for local Ca2+-induced Ca2+ release from the SR (Bers 2001). Ca2+, when released from the SR, activates contraction and affects other Ca2+-dependent intracellular processes. Thus, the spatial distribution and organization of RyRs is important to our understanding of cardiac cell physiology.
There are three isoforms of RyRs: RyR1 is the primary type in skeletal muscle; RyR2 is primarily the cardiac isoform, and RyR3 is found in brain (Bers 2001). In addition to RyR3 brain also expresses both RyR2 and RyR1, and a small amount of RyR3 can be found in mammalian skeletal muscle. In heart, in addition to RyR2, expression of RyR1 was found in cardiac mitochondria (Altschafl et al. 2007; Beutner et al. 2005).
In ventricular myocytes RyRs were shown to be largely localized to the junctional SR (jSR) that apposes the T-tubules (TT) of the transverse-axial tubular system. RyRs span the junctional cleft (JC) between the TT and jSR (Carl et al. 1995; Franzini-Armstrong 1973; Franzini-Armstrong et al. 1999, 2005; Jorgensen et al. 1993; Lukyanenko et al. 2007). Besides the jSR, RyRs were also found to be localized in the corbular SR, which is located in close proximity to Z-lines but much further from the TT membranes than the jSR (Dolber and Sommer 1984; Jorgensen et al. 1993; Jorgensen and McGuffee 1987). Early immunogold experiments suggest that the network SR (nSR) in ventricular myocytes is nearly free of RyRs (Jorgensen et al. 1993).
Recent results raise questions about the RyR distribution in ventricular myocytes: (1) two laboratories reported the existence of RyR1 in mitochondria (Altschafl et al. 2007; Beutner et al. 2001, 2005); (2) modeling of circularly propagating Ca2? waves suggests that a significant fraction of Ca2? release units (e.g. 20%) should exist between Z-lines (Subramanian et al. 2001); and (3) more recently, we and others presented evidence suggesting the existence of functional groups of RyRs in the middle of the sarcomere and between perinuclear mitochondria (Chen-Izu et al. 2006; Lukyanenko et al. 2007; Yang and Steele 2005). These sarcoplasmic regions produced the elementary Ca2? release events, Ca2? sparks (Cheng et al. 1993) and were labeled with antibodies against RyRs using immunofluorescent labeling (Chen-Izu et al. 2006; Lukyanenko et al. 2007). However, input from out-of-focus light and the complicated structure of ventricular myocytes did not allow us to make a firm conclusion based only on confocal microscopy experiments.
One alternative to confocal microscopy is immunogold labeling followed by electron microscopy (EM), which should be able to demonstrate co-localization of RyRs and intracellular membranes. However, methods for preserving the cell ultrastructure for EM have been shown to mask proteins to be localized (Hayat 1986; Maunsbach and Afzelius 1999). To by-pass this problem, we modified immunogold labeling and subsequent data analyses. For this we: (1) embedded cardiac myocytes in acrylic resin, which better preserves proteins for immunolabeling (Newman and Hobot 1993); (2) used isolated cardiac cells to compare labeling within the cell and nonspecific binding to the resin outside the cell (i.e. to normalize density of labeling within the cell to density of labeling to the resin); and (3) slightly permeabilized ventricular cells with saponin, to release unbound cytoplasmic proteins (to reduce non-specific binding), and to seal TT (Parfenov et al. 2006). The sealing of TT is supposed to better preserve intracellular proteins from the GA because diffusion of the GA into the cell is time and distance dependent (Hayat 1986). Our novel approach is a compromise between quality of the ultrastructure and the availability of epitopes for antibodies. This allows us to localize specific proteins, which are located relatively far from cell borders.
In summary, in this article we used the modified immunogold labeling to investigate the distribution of RyRs and to compare their location to distribution of other intracellular membrane proteins, namely the mitochondrial voltage dependant anion channel (outer mitochondrial membrane; also known as VDAC or porin) and cytochrome c (inner mitochondrial membrane), in rat ventricular myocytes. VDAC and cytochrome c were selected for comparison because (1) their location is well-known, and (2) they correspond to the hypothesized location of RyRs within mitochondrial membranes.
Methods
Cell isolation and experimental solutions
Single ventricular myocytes were obtained from adult male Sprague-Dawley rat hearts by enzymatic dissociation as described previously (DuBell et al. 2000). The animals were killed by lethal injection of Nembutal (100 mg/kg I.P.). The standard Tyrode solution contained (in mM): 140 NaCl, 5.4 KCl, 0.5 MgCl2, 1 CaCl2, 10 Hepes, 0.25 NaH2PO4, 5.6 glucose, pH 7.3. Unless specified otherwise, all chemicals were from Sigma.
Isolated ventricular cells were permeabilized by exposure to 0.01% saponin for 0.5 min. The permeabilization solution contained: 100 mM K? aspartate, 20 mM KCl, 3 mM MgATP, 0.81 mM MgCl2 ([Mg2?]free= 1 mM), 0.5 mM EGTA, 0.114 mM CaCl2 ([Ca2?]free = 90 nM), 20 mM Hepes, 3 mM glutamic acid, 3 mM malic acid, and 1% polyvinylpyrrolidone (PVP), pH 7.2 (Lukyanenko et al. 2007). The control experimental solution contained: 100 mM K? aspartate, 20 mM KCl, 3 mM MgATP, 0.81 mM MgCl2 ([Mg2?]free = 1 mM), 0.5 mM EGTA, 0.114 mM CaCl2 ([Ca2?]free = 90 nM), 20 mM Hepes, 10 mM phosphocreatine, 5 U/ml creatine phosphokinase, 3 mM glutamic acid, 3 mM malic acid and 1% polyvinylpyrrolidone, pH 7.2. The free [Ca2?]free and [Mg2?]free at the given total Ca2?, Mg2?, ATP, and EGTA concentrations were calculated using WinMAXC32 2.5 (Stanford University, CA). Measurements with a spectro-fluorometer D-Scan (PTI, Monmouth Junction, NJ) and the Ca2? indicator fura-2 (TefLabs, Austin, TX) showed that real [Ca2?]free in the experimental solution is 100 nM.
Immunogold labeling
To get longitudinal sections, isolated rat ventricular cells were allowed to attach to coverslips covered with laminin in Tyrode solution for 10 min before fixation. Unless specified otherwise, the Tyrode solution was then replaced with 0.1 M Na-cacodylate buffer (pH = 7.4) containing 6% glutaraldehyde and 2% paraformaldehyde for 20 min at room temperature. After fixation, the cells were rinsed two times with the same buffer supplemented with 0.2 M sucrose and post-fixed with 1% osmium in s-Colloidine buffer (Electron Microscopic Science, Hatfield, PA). Then samples were en block stained (2% uranyl acetate in 50% ethanol) for 1 h. After dehydration in an alcohol series, the samples were embedded in LR White resin (Ted Pella, Inc., Redding, CA). Ultrathin sections were obtained with a LKB III microtome, (LKB, Sweden), collected on formvar-coated nickel grids, and stained for 15 min with 2% aqueous uranyl acetate and then for 2 min with lead citrate at room temperature. Sections were examined at 60 kV with a Zeiss electron microscope EM 10C/EM 10 CR (Zeiss, Gottingen, Germany). Images were stored in tiff-format.
To examine the intracellular localization of proteins in the cells, longitudinal ultrathin sections of the cardiomyocytes were treated from one side of the slice with antibodies to RyRs (types 1,2 and 3), cytochrome c, or VDAC. For the work reported here, the following antibodies were used:
anti-RyR1 (anti-Ryanodine, mouse monoclonal, 450 kDa, IgM, used dilutions 1:20 and 1:50, Upstate Biotechnology, Lake Placid, NY; this antibody is against type 1 RyRs only, but see Temsah et al. (2000));
anti-RyRs1/2 (MA3-925, mouse monoclonal, IgG1, used dilutions—1:20 and 1:50, ABR Affinity BioReagents, Inc., Golden, CO; against types 1 and 2 RyRs);
anti-RyR2 (MA3-916, mouse monoclonal, clone C3-33, IgG1, used dilutions 1:20, 1:100, ABR Affinity BioReagents, Inc., Golden, CO; against types 1 and 2 RyRs, but mainly 2);
anti-RyR3 (type 3, rabbit polyclonal, used dilutions—1:20 and 1:200; was the kind gift of Dr. Vincenzo Sorrentino, University of Siena, Italy);
anti-cytochrome c (H-104, rabbit polyclonal, used dilution—1:100, LabVelocity, Burlingame, CA);
anti-VDAC (anti-Porin, Ab-5, rabbit polyclonal, IgG, used dilutions 1:10 and 1:20, Calbiochem, Oncogene Research Product, San Diego, CA).
For immunolocalization, thin sections on nickel grids were: (a) blocked (15 min, RT, high humidity chamber) in TBST plus 5% normal goat serum (Sigma 5-2007); (b) incubated in primary antibody in TBST/ 5% normal goat serum for 1–1.5 h at room temperature; (c) washed three times in TB; (d) incubated in the appropriate (anti-mouse or anti-rabbit) secondary antibody (1:50) coupled to 5 nm colloidal gold (Amersham Pharmacia Biotech, Piscataway, NJ) in TB plus 0.06% BSA for 1–1.5 h at room temperature, and (e) washed in TB and H2O.
Silver enhancement for gold particles, conjugated with secondary antibody was made with the BBInternational Silver Enhancing Kit (Ted Pella, Inc., Redding, CA). Control experiments were performed in each case by omission of primary antibodies.
We did at least three experiments with each antibody. For each experimental condition, we analyzed 8–10 slices containing 10–12 cells and made 4–5 images from every slice. The area density of gold labels was derived from images with 9 10 000 original magnification using ImageJ 1.31v (NIH, Bethesda, USA).
Experiments were performed at room temperature (21–23°C). Data were expressed as means ± SE. Comparisons were performed using the Student’s t-test, and differences were considered significant when P < 0.05.
Results
Control experiments
Although conventional fixation followed by Epon embedding is best for imaging intracellular structures, it may interfere with immunogold labeling due to the damage done to antigens. To better preserve antigens, we used conventional fixation followed by embedding in acrylic LR White resin. To improve the labeling and better delineate the labeling from mitochondrial granules, we used silver enhancement.
Previously, RyRs were shown to be localized mainly near T-tubules (Jorgensen et al. 1993). However, the preservation of structure did not allow making conclusions about the distribution of the RyRs between the Z-lines. Therefore, our major goal was to maximally preserve ultrastructure for immunogold labeling. We adjusted the parameters of our labeling method using antibodies to VDAC. Distribution of VDAC within the cell is well-known—it localizes to the outer mitochondria membrane (Colombini 2004; Mannella 1987; Salnikov et al. 2007). For these experiments, we gradually increased [GA] from 0.25 to 6% and the time of fixation from 2 to 60 min (data not shown). Increases in [GA] and time of fixation resulted in a predictable increase in ultrastructure quality followed by a decrease in the density of immunogold labeling. Postfixation in osmium did not significantly change the distribution of RyRs in our experiments (not shown).
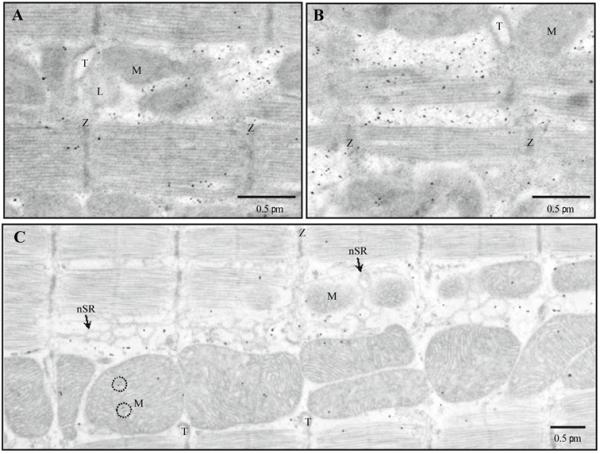
The 60 min fixation in the 6% GA produced the best quality of ultrastructure but almost excluded specific labeling. Therefore, to make the labeling more specific, we had to reduce the time of fixation. Varying the fixation time we found that 20 min was optimal for obtaining the best ultrastructure while preserving antigens relatively well. Indeed, despite a reduction in quality under our conditions all the main intracellular structures could be seen very well. Figure 1 shows mitochondria, network SR (nSR), TT, and Z-lines.To be sure that the fixation technique was suitable for immunolabeling, we conducted control experiments using primary antibodies to VDAC, cytochrome c, and secondary antibodies only. Previous studies have shown VDAC located in the outer mitochondrial membrane (OMM) (Colombini 2004; Mannella 1987; Salnikov et al. 2007), while cytochrome c is a part of the IMM complex (Nicholls 1974). Therefore, if epitopes to these proteins remain unmasked we should see labels to VDAC on the border of mitochondria and labels to cytochrome c mainly inside the mitochondria.
Fig. 1.

Distribution of voltage-dependent anion channels (VDACs) and cytochrome c in intact ventricular cells. Immunogold labeling after 20 min in 6% GA, with 5 nm gold particles after silver enhancement. The electron micrographs (longitudinal ultrathin section) show the distribution of antibodies to VDAC (A, B) or cytochrome c (C). A The border between the mitochondrion and the network SR. Labeled VDAC is marked additionally with arrowheads. B VDAC distribution in the myocyte. C The representative electron micrograph shows the distribution of antibodies to cytochrome c. D Control labeling was performed for20 min in 6% GA only with secondary antibodies. nSR, network SR; M, mitochondrion; T, T-tubule; Z, Z-line; black circles mark gold particles
Figure 1A shows nSR free of gold labels to VDAC, which located exactly on the mitochondrial border (white arrowheads). The labels were never seen to be associated with the sarcolemma. Our data from 6 experiments (- 1000 cells) showed gold labels to VDAC to be mainly located on the OMM. A representative micrograph in Fig. 1B shows that 78% of the labels to VDAC are associated with OMM and 12% of labels are located in close proximity to OMM (6% inside and 6% outside of mitochondria). This shows the possible diffusion of proteins from their original location during preparation for EM. The diffusion of VDAC towards the center of mitochondria was about 0.07 J.tm. This border zone was excluded from analyses when we localized RyRs.
Gold labels for cytochrome c were found mainly within mitochondria (Fig. 1C), while some labels represented nonspecific binding. A representative micrograph from a control experiment without primary antibodies (Fig. 1D) shows only nonspecific labeling (black circles). Note that this labeling marks all intracellular organelles including mitochondria and the nucleus.
Localization of RyRs with immunogold labeling
To visualize all possible RyRs in ventricular myocytes we used antibodies to all three types of RyRs. Most of them were commercially available, but the antibody against RyR3 was a kind gift from Dr. Sorrentino (University of Siena, Italy). None of the antibodies is specific for a single RyR type (see Methods). Therefore, the data presented here do not prove the existence of a specific type of RyR in a ventricular cell directly but reveal an ensemble view of RyR locations. Because type 2 is the major type of RyRs in cardiac cells (Bers 2001), we first studied the distribution of RyR2s using two monoclonal antibodies from ABR: MA3-916 and MA3-925.
Figure 2 shows distribution of MA3-916 in intact ventricular cells after 2 (A and B) or 20 (C) min in 6% GA. As can be seen, 20 min fixation in GA significantly improved the quality of ultrastructure but reduced the density of labels. However, the distribution of the antibody after 20 min in GA was very much the same as after 2 min in GA. Mitochondrial binding was very low (i.e. even less than background labeling such as in myofibrils). Silver labels could be seen along the Z lines, intermyofibrillar mitochondria (IMFMs) (Fig. 2C) and around perinuclear mitochondria (not shown) with the lowest density of antibodies in mitochondria and myofilaments.
Fig. 2.
The distribution of RyR2s (antibody MA3-916) in intact ventricular cells. Immunogold labeling, 5 nm gold, silver enhancement. Silver grains show distribution of antibodies against RyR2 in intact ventricular cells after 2 (A and B) or 20(C) min fixation in 6% glutaraldehyde (GA). nSR, network SR; M, mitochondrion; T, T-tubule; Z, Z-line; L, lipid droplet; black circles mark mitochondrial granules
To further reduce nonspecific labeling we performed parallel experiments with permeabilized cardiac myocytes. The results were very similar (Fig. 3A). Note that antibody MA3-916 had little binding outside of the cell (i.e. to the cell-free resin). Figure 3B shows the perinuclear mitochondria surrounded by multiple labels for RyR2, while mitochondrial matrix and nucleus practically do not have the labeling.
Fig. 3.
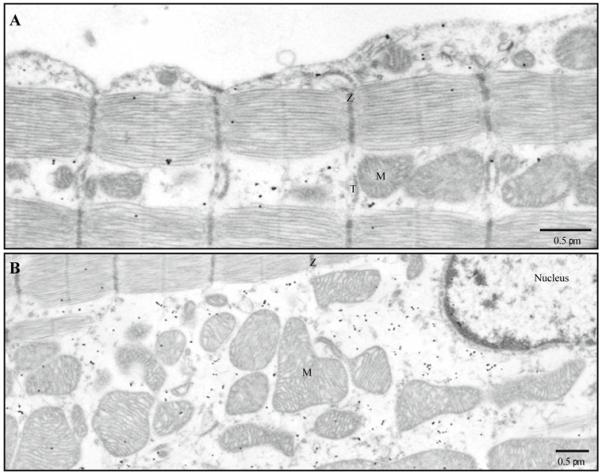
The distribution of RyR2s (antibody MA3-916) in permeabilized ventricular cells. Immunogold labeling, 5 nm gold, silver enhancement. Silver grains show distribution of antibodies against RyR2 in permeabilized ventricular cells. A Sarcomeres. B Zone of perinuclear mitochondria. M, mitochondrion; T, T-tubule; and Z, Z-line
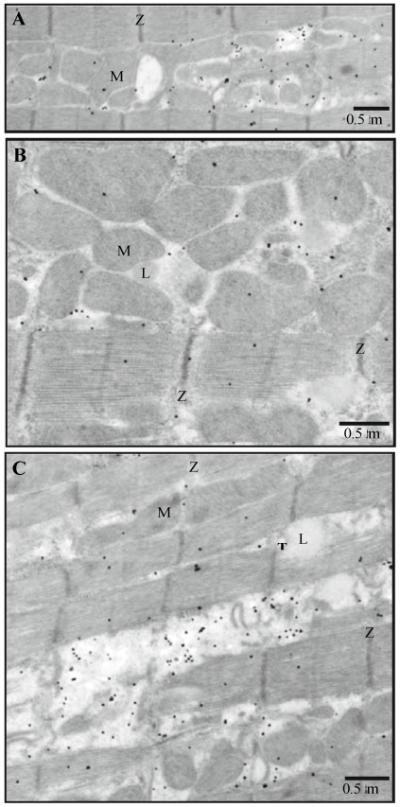
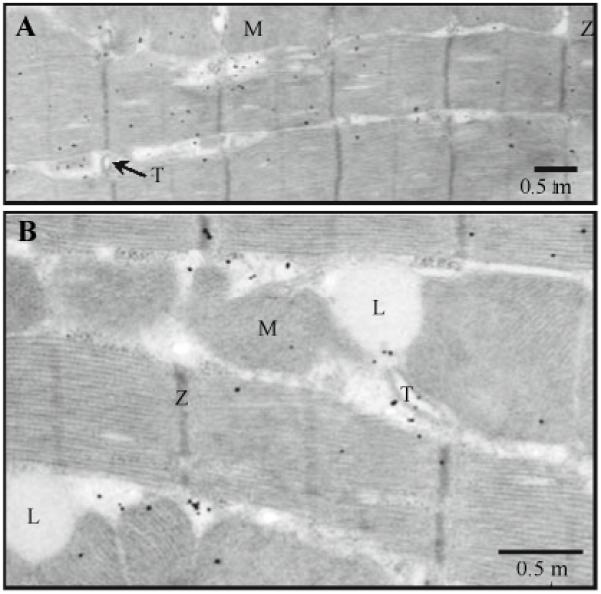
We obtained very similar results for the distribution of RyRs using MA3-925 (Figs. 4 and 5), anti-RyR1 (Fig. 6) and anti-RyR3 (Fig. 7). For every antibody we performed at least 3 experiments (i.e. about 600 cells were examined for each antibody) and measured area density of the labels on cytoplasm, mitochondria, and myofibril surfaces of the slice. To preclude counting proteins diffused inside the mitochondria from the cytoplasm (as described above for VDAC), we measured area densities within mitochondria no closer than 0.07 J.tm to the OMM.
Fig. 4.
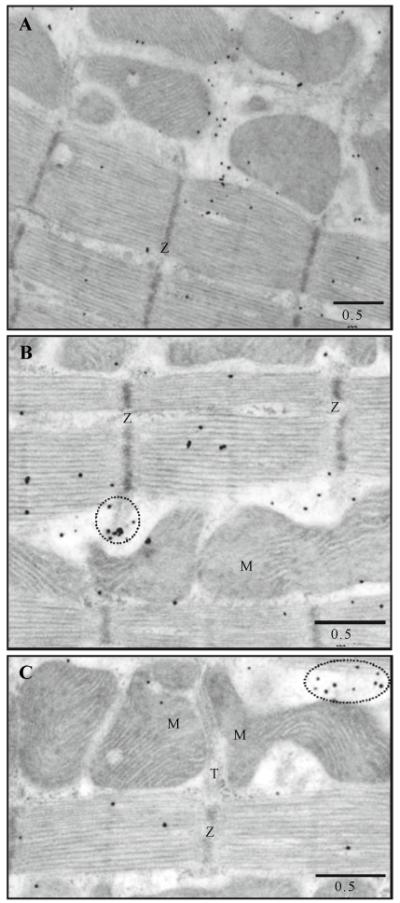
The distribution of RyRs 1 and/or 2 (antibody MA3-925) in intact ventricular cells. A–C The representative electron micrographs show the distribution of antibodies MA3-925. Immunogold labeling; 5 nm gold; silver enhancement. Dotted ovals mark RyRs located along Z-lines (B) or in the middle of A-band and in close proximity to mitochondria (C). M, mitochondrion; T, T-tubule; and Z, Z-line
Fig. 5.
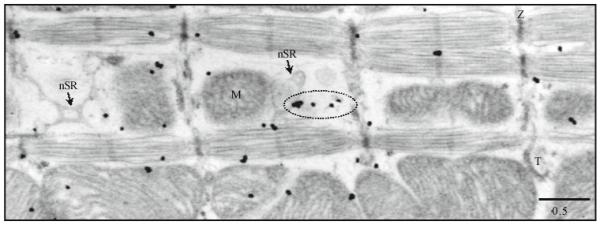
The distribution of RyRs 1 and/or 2 (antibody MA3-925) in permeabilized ventricular cells. Immunogold labeling; 5 nm gold; silver enhancement. The representative electron micrograph shows the distribution of antibodies to RyRs1 and/or 2. Dotted oval marks RyRs located in the middle of A-band and in close proximity to mitochondria. nSR, network SR; M, mitochondrion; T, T-tubule; and Z, Z-line
Fig. 6.
Distribution of RyR1s (monoclonal antibody) in intact ventricular cells. Immunogold labeling; 5 nm gold; silver enhancement. A–C The representative electron micrographs show the distribution of antibodies to RyRs1. M, mitochondrion; T, T-tubule; Z, Z-line; and L, lipid droplet
Fig. 7.
Distribution of RyR3s (polyclonal antibody) in intact ventricular cells. Immunogold labeling; 5 nm gold; silver enhancement. A and B The representative electron micrographs show the distribution of antibodies to RyRs3. M, mitochondrion; T, T-tubule; Z, Z-line; and L, lipid droplet
We did not find a significant difference between density of RyRs for intact and permeabilized cells and Table 1 summarizes all our data for each antibody against RyRs. To make the data comparable, we normalized them to the area density of labels out of the cell (i.e. to nonspecific binding of antibodies to the resin). Therefore, a relative density close to 1 indicates almost no specific labeling.
Table 1.
Relative area density of silver particles found inside cells (normalized to area density of those in resin)
| Antibody | Zones |
||
|---|---|---|---|
| Sarcoplasmic | Myofibrillar (nonspecific) |
Mitochondrial | |
| anti-RyR2 (MA3-916) |
18.39 ± 0.76 1.77 ± 0.09* 1.24 ± 0.09*,** |
||
| anti-RyR1/2 (MA3-925) |
4.83 ± 0.19 1.47 ± 0.05* 1.11 ± 0.07*,** |
||
| anti-RyR1 (MA) | 20.23 ± 0.82 2.13 ± 0.12* | 1.35 ± 0.11*,** | |
| anti-RyR3 (PA) | 6.27 ± 0.47 1.60 ± 0.08* | 1.08 ± 0.08*,** | |
Measurements inside mitochondria were performed for areas at least 70 nm distant from the mitochondrial outer membrane. The data are collected from 3 experiments for each antibody. Area density was measured for 0.2 m2 areas (n = 119–3738)
MA Monoclonal antibody, PA polyclonal antibody
Area density is significantly different from density in sarcoplasm (P <0.0001)
Area density is significantly different from density in myofibrillar zone (P < 0.0001)
For all antibodies used, labeling of the sarcoplasm (including SR) was significantly higher than the labeling of myofibrils or mitochondria. Labeling of the internal parts of the mitochondria was almost the same as non-specific labeling out of cells (i.e. about 1.0 in the Table 1) and significantly lower than a relatively non-specific labeling of myofibrils. Labeling of nuclei (not shown) was practically identical to mitochondria for every RyR antibody used in the experiments.
Discussion
We investigated the distribution of RyRs in cardiac ventricular myocytes using immunogold labeling. We found a large number of RyRs at sites other than around the Z-lines (i.e. outside of the SR-TT junctions. More specifically, these non-junctional RyRs are probably in the nSR (i.e. between Z-lines) and in the SR/ER around the nucleus and the perinuclear mitochondria. Here we discuss some of the issues and controversies related to our findings.
Justification of the method
Our novel approach is an attempt to find compromise between quality ultrastructural preservation and preservation of immunogenicity. It is well known that the former is proportional to the number of cross-links introduced by GA, whereas the latter is usually inversely related to the quality of fixation (Hayat 1986). The 6% GA in the fixative solution is generally detrimental to the antigenicity of the fixed proteins. However, it is also known that some proteins can tolerate hours in up to 2–3% GA (Hayat 1986; Maunsbach and Afzelius 1999). Thus, the higher concentration should be tolerable for short periods of time. More over, it is known that “some antigens located at certain sites in the cell can be detected only after fixation with GA” (Hayat 1986).
Because preservation of ultrastructure was of major concern, we performed preliminary experiments looking for the lowest concentration of GA that could be tolerated. However, we found that to best preserve the structure of muscle cells we needed 6% GA. This concentration of GA had been used for 2 (or more) hour’s fixation of muscle tissue in classical papers (Fawcett and McNutt 1969; Tijskens et al. 2003). Isolated myocytes in culture are much more easily fixed in comparison to pieces of tissue. Our data showed that 1 h fixation of cultured muscle cells by 2.5% GA preserves ultrastructure very well (Nasledov et al. 1999). Therefore, it may be that a 20 min GA fixation in our experiments did not preserve the structure of the myocytes because of the slow diffusion of GA into the cardiac cell. This was a surprise to us, because even without a TT (they were sealed in some of our experiments), we had expected that GA should reach the middle of a myocyte after only 3 min (Hayat 1986). The rate of GA penetration is a function of the fixative concentration, distance, temperature, pH and the type of buffer vehicle (Hayat 1986). We used the cacodylate buffer, which is a “slowest” for GA diffusion (Hayat 1986). This is the only explanation that we can suggest for the relatively slow diffusion of GA into the cardiomyocytes.
Preservation of ultrastructure includes preservation of membranes. Although LR White used in our experiments is an excellent resin for preservation of antigens (Newman and Hobot 1993), cellular membranes are often poorly preserved and show disruptions when observed at high magnification without postfixation (Maunsbach and Afzelius 1999). To preserve membranes we needed to use postfixation in osmium. Osmium helps to preserve membrane structure by reacting with unsaturated lipids. Although, osmium also reacts with proteins, changing them structurally and reducing the ability of antibodies to recognize appropriate epitopes, it was shown that both GA and osmium are not as destructive to antigens as was thought in the past (Hayat 1986; Newman and Hobot 1993). Moreover, GA was shown not to destroy an antigen, but only mask it and the mask could be removed (Hayat 1986). Indeed, antigenicity of some proteins (for example hormones) is quite resistant to GA fixation and postfixation in osmium (Newman and Hobot 1993). Thus, the method we developed is well within the range of experience noted by others.
We conclude that our method for isolated ventricular cells is the best we could create based on our own experience and the available literature. We used acrylic resin, we prevented nonspecific staining due to cross-linking of antibodies with GA by incubating the tissue in serum (as recommended by Hayat (1986) or Maunsbach and Afzelius (1999)), and used a high concentration of antibody (Maunsbach and Afzelius 1999).
Our preliminary data and control experiments showed that we found an excellent compromise between ultrastructure and immunolabeling quality. First of all, our control experiments showed the expected distribution of labels for well-known mitochondrial VDAC (Fig. 1B) and cytochrome c (Fig. 1C), and almost no non-specific labeling with secondary antibody (Fig. 1D). Secondly, we could show that the distribution of RyRs in ventricular myocytes for 2 min in 6% GA and 20 min in the same concentration were similar. The difference was only in the density of labeling. Thus, we concluded that: (1) our labeling was specific, (2) some epitopes located far from the sarcolemma (in the middle of sarcomere and within mitochondria) still were available for labeling, and (3) what we really lost with 6% GA were RyRs in the junctional SR. However, our task was to show that RyRs could be distributed between Z-lines. We had expected that strong RyR labeling around the T-tubules might overshadow the relatively weak labeling in other cellular subdomains. Paradoxically, high concentrations of GA allowed us to demonstrate the existence of RyRs between the Z-lines, but not at the junctional SR where the concentration of RyRs is known to be the greatest.
Localization of RyRs with immunogold labeling
We found a very similar distribution for all antibodies regardless of which type of RyR they were supposed to recognize. However, due to low specificity of the antibodies we cannot make any conclusions about the existence of the three types of RyRs and their similar distribution in cardiac cells. In addition the antibodies had different specificity to RyR as a whole. The most specific antibodies were MA3-916 and anti-RyR1. Table 1 shows that the labeling in the sarcoplasm for the antibodies was about 20 times higher than outside the cell and 10 times higher than nonspecific labeling on myofibrils. That is a sufficiently high specificity to conclude that there are RyRs in the sarcoplasm of the ventricular cells at the A-band level and around perinuclear mitochondria, even though we cannot identify the type. These immunogold data on the distribution of RyRs support our earlier data from immunofluorescence and spark imaging (Lukyanenko et al. 2007).
RyRs within mitochondria
Expression of RyR1 has been shown in cardiac mitochondria (Altschafl et al. 2007; Beutner et al. 2005). Lack of specificity even for monoclonal antibodies raised against a specific type of RyR allowed us to compare the distribution of antibodies against RyR1 and RyR2. The most specific antibodies against RyR1 and RyR2 used in our experiments correspondingly were anti-RyR1 (Upstate) and anti-RyR2 (MA3-916). Both of these antibodies labeled the mitochondria in a similar manner and the density of the labeling was very similar to non-specific labeling of the nucleus and the resin itself (Table 1).
We can conclude that we did not find any evidence to support localization of RyRs to the mitochondrial inner membrane as had been suggested previously by Beutner et al. (2001, 2005) and others (Altschafl et al. 2007). There was some labeling inside mitochondria; however, we did not find the labeling to exceed the background labeling of the myofibrils. This was similar for each antibody used (Table 1). Thus, if RyRs were located in the inner mitochondrial membrane, they could be only in the membrane directly facing the OMM. However, when we saw RyRs located within mitochondrial borders but close to OMM (in the zone excluded from calculations), we either (1) saw nearby multiple labeling in the sarcoplasm (Figs. 2B, 3A, 4) or (2) the boundaries of mitochondria were not clear (Fig. 3A, D). Thus, the distribution of RyRs within the mitochondrial borders is very doubtful. Because RyRs could be marked with gold nanoparticles as far as 20 nm from their real location (size of two IgGs), slice transparency, and existence of intimate contacts between SR and OMM (Parfenov et al. 2006), gold labels could be seen inside of mitochondria without the RyR antigens really being within the mitochondria. However, even when tissues were less well preserved than in our experiments, the mitochondria were labeled for RyRs only at the level of background (Jorgensen et al. 1993; Kijima et al. 1993).
Acknowledgments
This work was supported by grants from American Heart Association (AHA 0060088Y to V.L.) the National Institutes of Health (HL36974, HL70709, HL67849 and HL25675 to W.J.L.).
Abbreviations
- GA
Glutaraldehyde
- EM
Electron microscopy
- IMFM
Intermyofibrillar mitochondrion
- JC
Junctional cleft
- jSR
Junctional SR
- nSR
Network SR
- OMM
Outer mitochondrial membrane
- RyR
Ryanodine receptor (SR Ca2+ channel)
- SR
Sarcoplasmic reticulum
- TT
T-tubule
- VDAC
Voltage-dependent anion channel
Contributor Information
V. Salnikov, Medical Biotechnology Center, University of Maryland Biotechnology Institute, 725 W. Lombard St., Baltimore, MD 21201, USA; Kazan Institute of Biochemistry and Biophysics, Kazan Science Center, Russian Academy of Sciences, 2/31 Lobachevskii St., Kazan 420111, Russia
Y. O. Lukyanenko, Department of Biochemistry and Molecular Biology, University of Maryland, School of Medicine, 108 N. Greene St., Baltimore, MD 21201, USA
W. J. Lederer, Medical Biotechnology Center, University of Maryland Biotechnology Institute, 725 W. Lombard St., Baltimore, MD 21201, USA
Valeriy Lukyanenko, Medical Biotechnology Center, University of Maryland Biotechnology Institute, 725 W. Lombard St., Rm S213, Baltimore, MD 21201, USA lukyanen@umbi.umd.edu.
References
- Altschafl BA, Beutner G, Sharma VK, Sheu SS, Valdivia HH. The mitochondrial ryanodine receptor in rat heart: a pharmaco-kinetic profile. Biochim Biophys Acta. 2007;1768:1784–1795. doi: 10.1016/j.bbamem.2007.04.011. [DOI] [PubMed] [Google Scholar]
- Bers DM. Excitation-contraction coupling and cardiac contractile force. Kluwer; Dordrecht: 2001. [Google Scholar]
- Beutner G, Sharma VK, Giovannucci DR, Yule DI, Sheu SS. Identification of a ryanodine receptor in rat heart mitochondria. J Biol Chem. 2001;276:21482–21488. doi: 10.1074/jbc.M101486200. [DOI] [PubMed] [Google Scholar]
- Beutner G, Sharma VK, Lin L, Ryu SY, Dirksen RT, Sheu SS. Type 1 ryanodine receptor in cardiac mitochondria: transducer of excitation-metabolism coupling. Biochim Biophys Acta. 2005;1717:1–10. doi: 10.1016/j.bbamem.2005.09.016. [DOI] [PubMed] [Google Scholar]
- Carl SL, Felix K, Caswell AH, Brandt NR, Ball WJ, Jr, Vaghy PL, Meissner G, Ferguson DG. Immunolocalization of sarcolemmal dihydropyridine receptor and sarcoplasmic reticular triadin and ryanodine receptor in rabbit ventricle and atrium. J Cell Biol. 1995;129:672–682. doi: 10.1083/jcb.129.3.673. [DOI] [PMC free article] [PubMed] [Google Scholar]
- Cheng H, Lederer W, Cannell M. Calcium sparks: elementary events underlying excitation-contraction coupling in heart muscle. Science. 1993;262:740–744. doi: 10.1126/science.8235594. [DOI] [PubMed] [Google Scholar]
- Chen-Izu Y, McCulle SL, Ward CW, Soeller C, Allen BM, Rabang C, Cannell MB, Balke CW, Izu LT. Three-dimensional distribution of ryanodine receptor clusters in cardiac myocytes. Biophys J. 2006;91:1–13. doi: 10.1529/biophysj.105.077180. [DOI] [PMC free article] [PubMed] [Google Scholar]
- Colombini M. VDAC: the channel at the interface between mitochondria and the cytosol. Mol Cell Biochem. 2004;256(257) doi: 10.1023/b:mcbi.0000009862.17396.8d. 1071 15. [DOI] [PubMed] [Google Scholar]
- Dolber PC, Sommer JR. Corbular sarcoplasmic reticulum of rabbit cardiac muscle. J Ultrastruct Res. 1984;87:190–196. doi: 10.1016/s0022-5320(84)80078-7. [DOI] [PubMed] [Google Scholar]
- DuBell WH, Lederer WJ, Rogers TB. K± currents responsible for repolarization in mouse ventricle and their modulation by FK-506 and rapamycin. Am J Physiol Heart Circ Physiol. 2000;278:H886–H897. doi: 10.1152/ajpheart.2000.278.3.H886. [DOI] [PubMed] [Google Scholar]
- Fawcett DW, McNutt NS. The ultrastructure of the cat myocardium. I. Ventricular papillary muscle. J Cell Biol. 1969;42:1–45. doi: 10.1083/jcb.42.1.1. [DOI] [PMC free article] [PubMed] [Google Scholar]
- Franzini-Armstrong C. Studies of the triad. IV. Structure of the junction in frog slow fibers. J Cell Biol. 1973;56:120–128. doi: 10.1083/jcb.56.1.120. [DOI] [PMC free article] [PubMed] [Google Scholar]
- Franzini-Armstrong C, Protasi F, Ramesh V. Shape, size, and distribution of Ca2± release units and couplons in skeletal and cardiac muscles. Biophys J. 1999;77:1528–1539. doi: 10.1016/S0006-3495(99)77000-1. [DOI] [PMC free article] [PubMed] [Google Scholar]
- Franzini-Armstrong C, Protasi F, Tijskens P. The assembly of calcium release units in cardiac muscle. Ann NY Acad Sci. 2005;1047:76–85. doi: 10.1196/annals.1341.007. [DOI] [PubMed] [Google Scholar]
- Hayat MA. Glutaraldehyde: role in electron microscopy. Micron Microscop Acta. 1986;17:115–135. [Google Scholar]
- Jorgensen AO, McGuffee LJ. Immunoelectron microscopic localization of sarcoplasmic reticulum proteins in cryofixed, freeze-dried, and low temperature-embedded tissue. J Histochem Cytochem. 1987;35:723–732. doi: 10.1177/35.7.2953782. [DOI] [PubMed] [Google Scholar]
- Jorgensen AO, Shen AC, Arnold W, McPherson PS, Campbell KP. The Ca2±-release channel/ryanodine receptor is localized in junctional and corbular sarcoplasmic reticulum in cardiac muscle. J Cell Biol. 1993;120:969–980. doi: 10.1083/jcb.120.4.969. [DOI] [PMC free article] [PubMed] [Google Scholar]
- Kijima Y, Saito A, Jetton TL, Magnuson MA, Fleischer S. Different intracellular localization of inositol 1, 4, 5-trisphosphate and ryanodine receptors in cardiomyocytes. J Biol Chem. 1993;268:3499–3506. [PubMed] [Google Scholar]
- Lukyanenko V, Ziman A, Lukyanenko A, Salnikov VV, Lederer WJ. Functional groups of ryanodine receptors in rat ventricular cells. J Physiol. 2007;583:251–269. doi: 10.1113/jphysiol.2007.136549. [DOI] [PMC free article] [PubMed] [Google Scholar]
- Mannella CA. Electron microscopy and image analysis of the mitochondrial outer membrane channel, VDAC. J Bioenerg Biomembr. 1987;19:329–340. doi: 10.1007/BF00768536. [DOI] [PubMed] [Google Scholar]
- Maunsbach AB, Afzelius BA. Biomedical electron microscopy. Academic Press; New York: 1999. [Google Scholar]
- Nasledov GA, Katina IE, Terentyev DA, Tomilin NV, Lukyanenko V. Development of muscle-specific features in cultured frog embryonic skeletal myocytes. J Muscle Res Cell Motil. 1999;20:5 17–527. doi: 10.1023/a:1005506216009. [DOI] [PubMed] [Google Scholar]
- Newman GR, Hobot JA. Resin microscopy and on-section immunocytochemistry. Springer-Verlag; Berlin: 1993. [Google Scholar]
- Nicholls P. Cytochrome c binding to enzymes and membranes. Biochim Biophys Acta. 1974;346:261–310. doi: 10.1016/0304-4173(74)90003-2. [DOI] [PubMed] [Google Scholar]
- Parfenov AS, Salnikov V, Lederer WJ, Lukyanenko V. Aqueous diffusion pathways as a part of the ventricular cell ultrastructure. Biophys J. 2006;90:1107–1119. doi: 10.1529/biophysj.105.071787. [DOI] [PMC free article] [PubMed] [Google Scholar]
- Salnikov V, Lukyanenko YO, Frederick CA, Lederer WJ, Lukyanenko V. Probing the outer mitochondrial membrane in cardiac mitochondria with nanoparticles. Biophys J. 2007;92:1058–1071. doi: 10.1529/biophysj.106.094318. [DOI] [PMC free article] [PubMed] [Google Scholar]
- Subramanian S, Viatchenko-Karpinski S, Lukyanenko V, Györke S, Wiesner TF. The underlying mechanisms of symmetric calcium wave propagation in rat ventricular myocytes. Biophys J. 2001;80:1–11. doi: 10.1016/S0006-3495(01)75991-7. [DOI] [PMC free article] [PubMed] [Google Scholar]
- Temsah RM, Dyck C, Netticadan T, Chapman D, Elimban V, Dhalla NS. Effect of beta-adrenoceptor blockers on sarcoplasmic reticular function and gene expression in the ischemic-reperfused heart. J Pharmacol Exp Ther. 2000;293:15–23. [PubMed] [Google Scholar]
- Tijskens P, Meissner G, Franzini-Armstrong C. Location of ryanodine and dihydropyridine receptors in frog myocardium. Biophys J. 2003;84:1079–1092. doi: 10.1016/S0006-3495(03)74924-8. [DOI] [PMC free article] [PubMed] [Google Scholar]
- Yang Z, Steele DS. Characteristics of prolonged Ca2 release events associated with the nuclei in adult cardiac myocytes. Circ Res. 2005;96:82–90. doi: 10.1161/01.RES.0000151841.63705.01. [DOI] [PubMed] [Google Scholar]