

Abstract
Background/objective
To examine associations of patient characteristics along with treatment quantity delivered by seven clinical disciplines during inpatient spinal cord injury (SCI) rehabilitation with outcomes at rehabilitation discharge and 1-year post-injury.
Methods
Six inpatient SCI rehabilitation centers enrolled 1376 patients during the 5-year SCIRehab study. Clinicians delivering standard care documented details of treatment. Outcome data were derived from SCI Model Systems Form I and II and a project-specific interview conducted at approximately 1-year post-injury. Regression modeling was used to predict outcomes; models were cross-validated by examining relative shrinkage of the original model R2 using 75% of the dataset to the R2 for the same outcome using a validation subsample.
Results
Patient characteristics are strong predictors of outcome; treatment duration adds slightly more predictive power. More time in physical therapy was associated positively with motor Functional Independence Measure at discharge and the 1-year anniversary, CHART Physical Independence, Social Integration, and Mobility dimensions, and smaller likelihood of rehospitalization after discharge and reporting of pressure ulcer at the interview. More time in therapeutic recreation also had multiple similar positive associations. Time spent in other disciplines had fewer and mixed relationships. Seven models validated well, two validated moderately well, and four validated poorly.
Conclusion
Patient characteristics explain a large proportion of variation in multiple outcomes after inpatient rehabilitation. The total amount of treatment received during rehabilitation from each of seven disciplines explains little additional variance. Reasons for this and the phenomenon that sometimes more hours of service predict poorer outcome, need additional study.
Note
This is the first of nine articles in the SCIRehab series.
Keywords: Spinal cord injuries, Tetraplegia, Paraplegia, Rehabilitation, Physical, Social participation, Quality of life, Activities of daily living, Spinal cord injury model system, Practice-based evidence
Introduction
In the 1940s, spinal cord injury (SCI) stopped being an automatic death sentence because of sepsis and other major complications; since then, rehabilitation has become increasingly sophisticated and successful in promoting long-term health and community living. These improvements began in specific locations such as Boston, for selected groups (e.g. World War II veterans of the US military services), and as an addition to acute medical-surgical care. Soon specialized centers that combined acute care and rehabilitation were organized, for example, in Stoke-Mandeville, in the UK. In the 1950s, rehabilitation was increasingly provided in specialized rehabilitation units and freestanding hospitals. Even so, referral to rehabilitation services was not routine, and if provided, was initiated after an extended period at home.1
The experience in the UK as well as the USA, where the National Institute on Disability and Rehabilitation Research established the SCI Model Systems program in the early 1970s, has convinced many that both acute care and rehabilitation for SCI require an integrated program staffed by specialists to achieve the best outcomes. A recent review2 supports this conclusion based on the limited data that are available, and recommends early referral of patients with traumatic SCI to a specialized center of care to decrease overall length of stay (LOS), mortality, and number and severity of complications. This review, however, did not describe the benefits of specialized SCI programs for the outcomes that are of most interest to a rehabilitation practitioner: functional status, community participation, quality of life, and preventable post-discharge complications, especially those resulting in rehospitalization.2
While there are no studies directly comparing patients who do not receive organized rehabilitation with those receiving SCI rehabilitation in specialized centers, and/or with those receiving rehabilitation in a non-specialized unit or facility, there has been much research on the outcomes of SCI rehabilitation. In the 1960s–1980s this work focused on functional gains during inpatient rehabilitation, an effort facilitated by the development of comprehensive measures of functional status such as the Functional Independence Measure (FIM®).3 Subsequent research continued to concentrate on functional gain using improved outcome instruments such as Rasch-transformed FIM measures;4 but in the USA and other countries with mature rehabilitation systems, the focus also incorporated participation, especially when measures of handicap and community integration became available.5 Also more common to be studied were patient-reported outcomes, such as life satisfaction and well-being.
As reported previously,6 reports of SCI rehabilitation outcomes have given minimal attention to the resources required, even though rehabilitation is a labor-intensive enterprise using highly trained medical, nursing, and therapy staff. At best, studies employ LOS as a proxy for resource utilization, and FIM gain per day is used to describe rehabilitation efficiency, with comparison of centers used as the method for establishing relative efficiency. If centers deliver about 3 hours of therapies per day in conformance with Medicare's 3-hour rule, this method provides reasonable results – if the outcome of interest is limited to functional status at discharge, as achieved by a typical rehabilitation program.
However, if one is interested in broader SCI rehabilitation outcomes and in the mix of disciplines and therapy types that are optimal for achieving outcomes of interest, not just at discharge from rehabilitation but also at longer term follow-up points, one needs finer-grained data than those that are typically available for program evaluation and quality assurance purposes.
The SCIRehab study collected extensive data on the process of rehabilitation in order to link rehabilitation service information to outcomes at discharge and at 1-year post-injury. While a few earlier studies had analyzed data on the hours of treatment delivered by each of various rehabilitation disciplines and their links to functional outcomes,7,8 SCIRehab started with the creation of taxonomies of the treatments delivered by seven disciplines: occupational therapy (OT), physical therapy (PT), speech therapy (ST), therapeutic recreation (TR), social work/case management (SW/CM), psychology (PSY), and nursing education and care coordination,9–17 and used these taxonomies to collect detailed information on who delivered what type of treatment to what patient when during the stay. An earlier set of papers in this journal reported on the predictors of therapy hours by discipline6 and hours of major therapy type within each discipline.18–24
Rehabilitation outcomes are multi-determined, and the nature and quantity of therapies may have a limited role in shaping outcomes. An extensive literature has explored the relationship of various outcomes, especially functional status, to level and completeness of injury,25 gender,26 age,27,28 race/ethnic group,29 and co-morbidities.30 In recent years, the circle of predictors has widened with the exploration of the role of family,31 neighborhood,32 and society.31,33 The relevance and strength of these demographic, clinical, and environmental predictors of rehabilitation success vary from one outcome to another and from one time point to another. For example, obesity may be a major determinant of motor function at inpatient rehabilitation discharge, and be irrelevant to life satisfaction 1 year later. The same assertion holds true for rehabilitation treatments: what may be the optimal SCI program for prevention of pressure ulcers may be irrelevant for return to work. Moreover, a package of services that is optimal overall or for specific outcomes for one subgroup may have limited effectiveness for another category of patients. The weak associations between demographical, clinical, and resource utilization factors and various outcomes support the conclusion of multi-causality. Poor conceptualization of relationships, lack of variation in predictors, and suboptimal outcome measures also may play a role in the lack of strong correlations.
As an observational study using practice-based evidence (PBE) methods,34–39 SCIRehab did not manipulate treatments. Instead, it collected data on the process of inpatient rehabilitation in specialized SCI rehabilitation programs. The general reasoning underlying the analysis of these data is reflected in Fig. 1.
Figure 1.
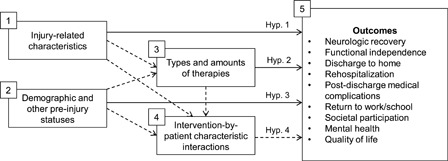
Hypothesis.
Characteristics of the spinal injury (including level and completeness of injury, functional status, and various co-morbidities) affect rehabilitation outcomes (hypothesis 1) as do demographical, social, and psychological characteristics (hypothesis 2). Rehabilitation is a process of selecting the type, timing, and duration of interventions so as to optimize post-discharge functioning (hypothesis 3). However, customization may occur in response to patient needs and preferences. Different treatments applied to patients with different characteristics may be associated with better outcomes (hypothesis 4). Controlling for injury and other characteristics while assessing the relationship between quantity and type of therapy allows us to determine the net effect of interventions across subgroups simultaneously. This report describes the association of the number of hours of major rehabilitation therapies received with outcomes, controlling for salient patient characteristics (blocks 1 and 2 in Fig. 1). While there are other statistical methods such as subgroup analysis and the introduction of explicit interaction terms into multivariate models that can achieve similar results, these methods are complex and difficult to interpret.
In summary, the major question answered in this article is: how strong is the association of specific therapies with which key short-term and medium-term rehabilitation outcomes, after controlling for patients’ status at admission to rehabilitation. Our methodology also allows us to compare the relative impact of therapy hours vs. patient characteristics on outcomes. This paper reports time for all types of therapy combined within each discipline. The articles that follow in this series (will add after review process and other papers are finalized) describe associations of specific activities provided by each discipline for the full sample and for specified subsets of patients, with respect to the outcomes described here and, in some cases, outcomes that are specific to that discipline.
Methods
PBE research methodology34–39 is an observational approach that focuses on the details of the rehabilitation process and relates naturally occurring variation in treatment to outcomes, after controlling for patient demographic and injury characteristics (referred to as patient characteristics). It employs a multi-disciplinary approach to address broad research questions. The research team, which includes frontline clinicians, identifies comprehensive data elements to answer these broad questions and to examine more specific questions. Consistent with the observational nature of PBE, the goal of such studies is to associate components of the routine care process with outcomes, but not to introduce new treatment modalities or alter routine clinical care.6,10,40
Facilities
The SCIRehab study is led by the Rocky Mountain Regional Spinal Injury System at Craig Hospital and involves collaboration with five other specialized rehabilitation programs: Carolinas Rehabilitation, Charlotte, NC; The Mount Sinai Medical Center, New York, NY; MedStar National Rehabilitation Hospital, Washington, DC; Rehabilitation Institute of Chicago, Chicago, IL; and Shepherd Center, Atlanta GA. These hospitals are not a probability sample of the rehabilitation facilities that provide SCI care in the United States, as they were selected based on their willingness to participate, geographic diversity, and expertise in treatment of patients with SCI and in rehabilitation research. They provide variation in setting, care delivery patterns, and clinical and demographic characteristics, all of which may affect outcomes. The number of participants enrolled ranged from 76 to 583 per facility; each facility obtained Institutional Review Board approval before patients were enrolled.
Enrollment criteria
Patients were enrolled who were 12 years of age or older, gave (or their parent/guardian gave and children assented) informed consent, and were admitted to the facility's SCI unit for initial rehabilitation following traumatic injury. Enrollment was not dependent on injury etiology or duration of the acute-hospital stay preceding admission. Patients who required transfer to an acute care unit and then returned to complete their rehabilitation were retained, but their acute care days were not counted as part of the rehabilitation stay. A small number of patients who spent more than 2 weeks in another rehabilitation center prior to admission to the SCIRehab facility were excluded. In addition, patients who spent more than a week of their rehabilitation stay on a non-SCI rehabilitation unit in the participating facility were excluded, because the clinical staff on non-SCI units were not trained in the data collection methods.
Patient demographic and injury data
Patient data were abstracted from medical records, either as part of the SCI Model Systems protocol or in a database designed specifically for this study. The International Standards of Neurological Classification of SCI (ISNCSCI) and its American Spinal Injury Association Impairment Scale (AIS)41,42 were used to describe the neurologic level and completeness of injury; the Functional Independence Measure (FIM) served to describe a patient's functional independence in motor and cognitive tasks at admission.43,44 Other injury characteristics were etiology of injury, ventilator use at rehabilitation admission, number of days that elapsed from date of SCI to rehabilitation admission, and whether the injury was work related. The Comprehensive Severity Index (CSI®), which quantifies patient severity of illness based on over 2100 physical findings related to a patient's disease(s), was used as the measure of medical severity.45 It uses weighting algorithms based on the gravity of symptoms associated with each ICD-9 code (e.g. urinary tract infection, co-occurring brain injury, hypotension, and depression) to calculate a severity score, using data from the entire rehabilitation stay. The CSI has been validated in inpatient, ambulatory, rehabilitation, and long-term care settings.38,45–51 CSI has been used in rehabilitation studies involving post-stroke, orthopedic joint replacement, and is concurrently at the time of this writing being used in a study of traumatic brain injury. Additional patient characteristics included age at the time of rehabilitation admission, gender, marital status, race, employment status at injury, primary payer, primary language, and body mass index (BMI). BMI was categorized as obese (BMI ≥30) and not obese (BMI <30).
Treatment characteristics
Clinician experience index
Each clinician providing care completed a profile about their education and experience in rehabilitation, including the number of years they had worked in SCI rehabilitation. The average clinician experience of those treating each patient was computed by weighting the years of SCI experience of clinicians by the number of hours of treatment each provided.
Time in treatment
Each clinical discipline – PT, OT, RT, ST, PSY, nursing, and SW/CM – used a handheld personal digital assistant to enter data about each patient encounter.10–17,40 At the core of the documentation was the taxonomy of each discipline's most important activities and interventions. Clinicians reported time and other details about the interventions delivered provided in individual or group sessions. Each discipline quantified the dosage of their interventions using number of minutes (in 5 minutes increments), a strategy consistent with approaches used in previous PBE studies.38,52 Site coordinators compared documentation entries with scheduling and billing records to ensure that all sessions were included. If a session had been scheduled or billed but not documented, the coordinator reported this omission to the therapist involved so that it could be added to the record. The training and reliability monitoring used throughout the data collection process have been described in detail in previous articles.6,9,10 Activity minutes were combined to approximate the total number of hours spent during rehabilitation by each clinical discipline.
Outcome data
The SCI Model Systems funded by the National Institute on Disability and Rehabilitation Research collect standardized information from injury through community discharge (Form I) and also on follow-up status using Form II,41 which is completed via (patient or proxy) telephone or in-person interview at approximately 1-year post-injury; it covers the period from rehabilitation discharge to the interview, focusing on outcomes at 1-year post-injury. The SCIRehab facilities collected this model systems information for all patients enrolled in the study regardless of the patient's model system status. In addition to the Form II information that was captured during patient interview, project-specific interview questions were asked. All interviewers were trained in the interview process and had experience conducting telephone interviews with patients with SCI.
Outcomes reported in this paper include:
- At discharge from the rehabilitation center
- Discharge location (home vs. another hospital, nursing home, group living situation, or other location.
- At the 1-year injury anniversary
- Functional Independence Measure (FIM) motor score after Rasch transformation.
- Craig Handicap Assessment and Reporting Technique Short Form (CHART-SF), a measure of societal participation by persons with disabilities.5,53,54 Four CHART-SF dimensions were used: physical independence, social integration, occupation, and mobility. Scores on each dimension range from 0 to 100, with 100 indicating performance at a level expected of the general population. CHART is the most widely used measure of participation in SCI research.
- Diener Satisfaction with Life Scale (SWLS). Life satisfaction is measured based on responses to five questions addressing global life satisfaction. Scores range from 7 to 35 with higher score indicating greater life satisfaction. SWLS questions must be answered by the patient and were not asked if interview was completed by a proxy.55
- Depressive symptoms as measured by the Patient Health Questionnaire – brief version (PHQ-9): This version of the PHQ contains nine questions about the frequency of depression symptoms.56 A higher score indicates greater symptomatology; proxy responses were not allowed.
- Place of residence at the time of the anniversary of injury, coded in the same manner as discharge location.
- Work/school attendance status – the CHART work and school items were dichotomized to reflect working or being in school vs. not.
- Rehospitalization during the period from final rehabilitation discharge to the anniversary interview (dichotomized as none vs. one or more hospitalizations).
- Pressure sore present vs. not at the anniversary interview.
Data processing and analysis
Patient groups were defined using the ISNCSCI. Patients with AIS grade D are grouped together regardless of injury level. Patients with AIS classification A, B, and C are combined and split by motor level to create the remaining three categories: patients with high tetraplegia (cervical level C1–4), low tetraplegia (cervical level C5–8), and paraplegia (T1 and below).
Total time (hours) spent by each rehabilitation discipline over a patient's entire stay is used as the measure of therapy quantity.
The extent to which clinically meaningful subsets of FIM items represent one-dimensional measures was examined and Rasch scaling was used to estimate item difficulties and person abilities along a shared, ordinal-level metric of functioning for subsets of FIM items. For each subset, the procedure reported by Mallinson57 was followed using a random sample of FIM reports at admission, discharge, and 1-year follow-up. From the calibration of 1376 cross-time period records, the items and rating scale steps were anchored and then FIM subscores were computed for each patient at all time points. The resulting measures are algebraically converted to range from 0 (lowest observed score) to 100 (largest observed score). Reported here are a Rasch-scaled FIM 13-item motor score and a 5-item cognition score. The Rasch-transformed FIM scores are interval measures that have better psychometric properties, making them more appropriate for use in regression analyses, although the associated parameter estimates are less interpretable by clinicians familiar with raw FIM scores.
For categorical variables, contingency tables were used to display differences in frequencies, and chi-square tests to examine differences across the four neurological injury groups. For continuous measures, analysis of variance was used to assess the statistical significance of differences in means across injury groups. A two-sided P value less than 0.05 was considered statistically significant.
Least squares stepwise regression models were used to address the primary research question: what treatment variables are significantly associated with outcomes after controlling for patient demographic, injury, and other characteristics? Separate regression models were calculated for each outcome as the dependent measure (linear regression for outcomes that are continuous measures and logistic regression for dichotomized outcomes). Three blocks of independent variables were allowed to enter stepwise regressions sequentially if significant: (1) all of the patient demographic and injury characteristics described in Table 1, (2) treatment variables that included time spent in each clinical discipline and rehabilitation LOS (Table 2), and (3) rehabilitation center (dummy variables). The dummy variables act as surrogates for all characteristics on which the six centers differ that affect the outcomes of interest. When the percent of variance explained by the center dummy variables is large, this is an indication that further exploration of factors explaining outcomes in future studies would be fruitful; when the percent is small, this suggests that the authors were successful in marshaling the key determinants of outcome. For linear regressions, the adjusted R2 reduces the unadjusted R2 to take into account the number of predictors in the model. The (unadjusted or adjusted) R2 value indicates the amount of variation in the outcome explained by the significant independent variables, and thus, the strength of the model. R2 values range from 0.0 (no prediction) to 1.0 (perfect prediction); values that are closer to 1.0 indicate better models. For logistic regression, the Maximum Re-scaled R2 (Max R2, also known as the Nagelkerke Pseudo R2 or Cragg and Uhler's R2), is reported as a measure of the strength of the model. This value is scaled the same as the R2 (0.0–1.0) and reflects the relative strength of the predictive logistic model. In addition, for logistic regression equations discrimination was assessed by using the area under the receiver operator characteristic curve (c) to evaluate how well the model distinguishes patients who did not achieve an outcome from patients who did. Values of c that are closer to 1.0 indicate better discrimination.
Table 1.
Patient and injury characteristics, by injury group
| Neurological injury group |
|||||
|---|---|---|---|---|---|
| Characteristic | C1–4 AIS A, B, C (n = 294) | C5–8 AIS A, B, C (n = 204) | Para AIS A, B, C (n = 373) | AIS D (n = 161) | Total analytic sample (n = 1032)* |
| Admission motor FIM, Rasch-transformed, mean (SD)** | 5.1 (7.8) | 13.1 (9.7) | 27.5 (5.8) | 24.5 (11.4) | 17.8 (12.6) |
| Admission cognitive FIM, Rasch-transformed, mean (SD)** | 66.4 (18.1) | 73.8 (17.2) | 76.6 (17.0) | 79.7 (17.7) | 73.6 (18.1) |
| Comprehensive Severity Index, mean (SD)** | 55.5 (38.3) | 42.7 (29.5) | 34.1 (25.3) | 21.9 (17.7) | 40.0 (31.6) |
| Days from injury to rehabilitation, mean (SD)** | 38.9 (32.2) | 33.0 (28.2) | 30.0 (26.0) | 16.5 (13.0) | 31.0 (27.8) |
| Traumatic etiology (%)** | |||||
| Vehicular | 50 | 48 | 53 | 43 | 49 |
| Violence | 7 | 10 | 18 | 4 | 11 |
| Sports | 15 | 22 | 3 | 8 | 11 |
| Fall or falling object | 27 | 21 | 20 | 38 | 25 |
| Other | 1 | 1 | 6 | 6 | 4 |
| Age at injury-years, mean (SD)** | 40.9 (17.1) | 33.8 (15.8) | 32.7 (13.3) | 48.1 (18.1) | 37.7 (16.7) |
| Gender (%) male | 82 | 81 | 80 | 84 | 81 |
| Marital status = Married (%)** | 43 | 30 | 35 | 42 | 38 |
| Race/ethnicity (%) | |||||
| White | 72 | 77 | 69 | 64 | 71 |
| Black | 20 | 17 | 24 | 26 | 22 |
| Hispanic | 2 | 2 | 4 | 2 | 3 |
| Other | 5 | 4 | 4 | 7 | 5 |
| Employment status before injury (%)** | |||||
| Working | 67 | 65 | 70 | 58 | 66 |
| Student | 13 | 21 | 14 | 12 | 15 |
| Retired | 11 | 3 | 3 | 17 | 8 |
| Unemployed/other | 9 | 11 | 13 | 13 | 11 |
| Injury work related (%) No | 84 | 91 | 84 | 89 | 86 |
| Body mass index at admission (%) less than 30** | 81 | 88 | 80 | 79 | 82 |
| Primary language (%) English primary language | 93 | 97 | 94 | 95 | 94 |
| Payer (%)** | |||||
| Medicare | 9 | 4 | 4 | 17 | 7 |
| Medicaid | 16 | 21 | 22 | 11 | 18 |
| Private insurance/pay | 64 | 67 | 63 | 62 | 64 |
| Worker's compensation | 11 | 8 | 12 | 10 | 11 |
| Education (%)** | |||||
| Less than high-school diploma | 18 | 22 | 21 | 14 | 19 |
| High-school diploma or GED | 51 | 46 | 49 | 42 | 48 |
| More than high-school diploma | 22 | 25 | 22 | 27 | 23 |
| Other/unknown | 9 | 8 | 9 | 18 | 10 |
*Omitting participants in the validation subset (N = 433).
**Statistically significant differences among injury groups: *P < 0.05.
Table 2.
Treatment variables (mean and SD), by injury group
| Neurological injury group |
|||||
|---|---|---|---|---|---|
| C1–4 AIS A, B, C (n = 294) | C5–8 AIS A, B, C (n = 204) | Para AIS A, B, C (n = 373) | AIS D (n = 161) | Total, analytic sample (n = 1032) | |
| Length of rehabilitation stay (days)* | 74.5 (43.0) | 66.5 (37.4) | 44.8 (25.2) | 32.7 (20.5) | 55.7 (36.6) |
| Clinician experience index* | 6.7 (3.3) | 6.2 (2.8) | 6.2 (3.4) | 5.2 (3.2) | 6.2 (3.2) |
| Occupational therapy total hours* | 71.6 (40.3) | 73.8 (40.0) | 37.4 (19.8) | 34.0 (25.3) | 53.8 (36.7) |
| Psychology total hours* | 15.4 (12.5) | 12.8 (10.5) | 8.8 (6.7) | 5.2 (5.6) | 10.9 (10.0) |
| Physical therapy total hours* | 68.0 (37.8) | 68.1 (36.2) | 50.3 (33.0) | 37.2 (25.7) | 56.8 (36.0) |
| Registered nursing total hours* | 47.0 (30.4) | 41.7 (22.3) | 30.1 (17.4) | 20.7 (15.3) | 35.7 (24.4) |
| Speech language pathology total hours* | 9.0 (17.3) | 3.4 (7.1) | 2.7 (7.3) | 2.0 (4.8) | 4.5 (11.2) |
| Social work/case management total hours* | 12.9 (14.0) | 10.2 (9.9) | 7.4 (7.5) | 4.8 (5.4) | 9.1 (10.4) |
| Therapeutic recreation total hours* | 20.0 (15.5) | 24.4 (19.4) | 17.1 (14.7) | 8.5 (10.2) | 18.0 (16.1) |
*Statistically significant differences among injury groups (<0.05).
In each regression, the adjusted R2 (linear regression) or the c statistic and the Max R2 (logistic regression) are reported in the tables, first for the prediction of the outcome with only patient demographic and injury characteristics included as independent variables. Next the same statistics are reported for the combination of treatment variables and patient characteristics. Finally, to determine the added impact of unspecified rehabilitation center effects, a dummy variable indicating the center where a patient was rehabilitated was added to the model and the adjusted R2 or c statistic/Max R2 are reported. The change in the adjusted R2 or c statistic/Max R2 as the treatment variables and then the center variables were added indicates the strength of additional explanation contributed by these components. For all outcome models, parameter estimates (shown for all patient and treatment variables, but not for centers) indicate the direction and strength of the association between each independent variable and the outcome. In the linear regression models, semi-partial Omega2s are reported, which indicate the proportion of explained variance in the dependent variable that is associated uniquely with a predictor variable. In the logistic regressions, odds ratios (OR) are reported to indicate the magnitude of the association of the predictor variable with the outcome. An OR of 2 indicates the odds of an event occurring is twice as likely for each unit increase of the independent variable, and an OR of 0.5 indicates the odds of an event occurring is only half as likely. In all regression models, the P value associated with each significant predictor is also reported.
To address criticisms that PBE analyzes capitalize on chance,58,59 regression analyses were cross-validated. The SCIRehab sample (1376 patients) was divided into two parts: a primary analysis subset with 75% of the cases and a validation subset with the remaining 25%. Random selection was used to assign patients to one of these subsets, using stratification to ensure equal representation by level and completeness of injury, treatment center, and availability of follow-up interview data. There were no significant differences between the primary analysis and validation subsamples on any dependent or independent variables used in the regression models. Once a reduced regression model was created using the primary analysis subset, with only significant predictors remaining, the analysis was repeated with the validation data set. For linear outcomes the relative shrinkage of the original model R2 that included all significant patient and treatment variables as the independent variables was compared to the R2 for the same outcome using the 25% sample and only the significant variables from the original model.60 A relative shrinkage (relative difference in R2) of <0.1 was considered to indicate a well-validated model. Validation was considered to be moderate when the relative shrinkage was between 0.1 and 0.2, and models were considered to be validated poorly if the relative shrinkage was >0.2. For dichotomous outcomes the Hosmer Lemeshow (HL) goodness of fit test P value was calculated both for the original model and for its replication in the validation subgroup. Models validated well if the HL P value was >0.1 for both, which indicates no lack of fit in either model. Models were considered to validate moderately well if the HL P value was 0.05–0.1 for one or both models, indicating some evidence of lack of fit, and to validate poorly if the HL P value was <0.05 for one or both, which indicates a lack of fit in one or both.
Results
A total of 1376 patients with traumatic SCI were enrolled from the fall of 2007 through December 2009. The percent of eligible patients who consented was 91% overall, and varied from 76 to 95% per center. Patient characteristics are presented in Table 1 for the analytic sample and its four injury subgroups as defined by lesion level and AIS.
Amount of treatment received
The mean rehabilitation LOS, excluding interruptions requiring transfer to an acute unit, was 56 days (range 2–267, standard deviation (SD) 37, median 45, interquartile range (IQR) 16–73). There are significant differences between the injury groups.
Patients received a mean of 188.8 hours (range 6.2–776.8 hours, SD 107.1, median 165.4, IQR 112.4–242.0) of therapy from the seven disciplines; there are statistically significant differences between injury groups. The majority of hours were provided by PT (30%) and OT (28%); nursing education and care management activities accounted for 18%, TR activities comprised 10%, PSY activities comprised 8%, and SW/CM comprised 4%. ST, whose interventions primarily focus on communication and swallowing issues for a subgroup of patients with a ventilator or tracheostomy and/or cognitive-communication disorders, provided the remaining 2% of treatment time.
Association of outcomes with patient and treatment variables
Motor FIM scores
Patient characteristics alone are strong predictors of the FIM motor scores at rehabilitation discharge (adjusted R2 = 0.65) and at 1-year post-injury (R2 = 0.51) (Table 3). The addition of treatment variables moderately increased explained variance at discharge to 0.70 and minimally increased the explained R2 at 1 year to 0.52. The strongest predictors of motor FIM at discharge and 1-year post-injury are the level and completeness of injury (patients with AIS A, B, or C have lower scores than patients with AIS D), higher admission motor FIM, injury work relatedness, and more time spent in PT. Older age, obesity, higher admission cognitive FIM, longer rehabilitation LOS, longer time from injury to rehabilitation admission, and more time spent in OT are associated with lower discharge FIM scores. Work relatedness, obesity, LOS, and OT hours are not predictors of motor independence at 1 year, but payer and social work/case management hours are. The addition of rehabilitation center as an independent variable only increased the R2 by 0.02–0.72 and 0.54, respectively.
Table 3.
Predicting motor FIM* at discharge and 1-year post-injury
| Discharge motor FIM |
1-year motor FIM |
|||||
|---|---|---|---|---|---|---|
| # Observations used | 1031 | 859 | ||||
| Step 1: Pt characteristics: adjusted R2 | 0.65 | 0.51 | ||||
| Step 2: Pt characteristics + treatments: adjusted R2 | 0.70 | 0.52 | ||||
| Step 3: Pt characteristics + treatments + center identity: adjusted R2 | 0.72 | 0.53 | ||||
| Independent variables** | Parameter estimate | P Value | Semi- partial Omega2 | Parameter estimate | P Value | Semi- partial Omega2 |
| Patient characteristics | ||||||
| Injury group | – | <0.001 | 0.063 | – | <0.001 | 0.090 |
| C1-4 ABC | −12.890 | <0.001 | – | −27.749 | <0.001 | – |
| C5-8 ABC | −9.872 | <0.001 | – | −22.465 | <0.001 | – |
| Para ABC | −4.765 | <0.001 | – | −17.635 | <0.001 | – |
| All Ds (Reference) | 0.000 | – | – | 0.005 | – | – |
| Admission FIM motor score-Rasch-transformed | 0.439 | <0.001 | 0.072 | 0.612 | <0.001 | 0.041 |
| Admission FIM cognitive score-Rasch-transformed | −0.025 | 0.010 | 0.002 | −0.098 | <0.001 | 0.009 |
| Days from trauma to rehabilitation admission | −0.042 | <0.001 | 0.007 | −0.116 | <0.001 | 0.017 |
| Age at injury | −0.064 | <0.001 | 0.006 | −0.153 | <0.001 | 0.007 |
| Injury is work related | 1.446 | 0.021 | 0.001 | |||
| BMI ≥30 | −1.614 | 0.004 | 0.002 | |||
| Primary payer | – | 0.028 | 0.003 | |||
| Medicare | −2.158 | 0.407 | – | |||
| Medicaid | −3.959 | 0.008 | – | |||
| Worker's compensation | −3.243 | 0.083 | – | |||
| Private insurance/pay (Reference) | 0.000 | – | – | |||
| Treatment variables | ||||||
| Rehabilitation length of stay | −0.046 | 0.004 | 0.002 | |||
| Occupational therapy total hours | −0.037 | 0.003 | 0.002 | |||
| Physical therapy total hours | 0.136 | <0.001 | 0.041 | 0.092 | <0.001 | 0.011 |
| Social work/case management total hours | −0.144 | 0.047 | 0.002 | |||
*Motor FIM was Rasch-transformed.
**All patient and treatment variables listed in Tables 1 and 2 were allowed to enter the models. Only significant predictors are reported here; a missing variable name means that variable did not predict any of the outcomes; a blank cell means that the variable was not a significant predictor for the outcome examined.
Residence
Most patients were discharged home; 11% were discharged to other locations (Table 4). Patient characteristics explain most of this variation (c statistic = 0.78, Max R2 = 0.21), while the addition of discipline-specific treatment time increases the c statistic to 0.81 and the Max R2 to 0.26. Rehabilitation center adds limited additional predictive power (c statistic = 0.83, Max R2 = 0.31). The strongest predictors of discharge to home include being married (OR 2.04), higher admission motor FIM, treatment by clinicians with more experience in SCI rehabilitation, and more time spent by registered nurses providing bedside education and care management. On the other hand, a high CSI, minority status, and greater age at injury predicted discharge to a location other than a private residence.
Table 4.
Prediction of discharge location, place of residence at 1-year anniversary, and likeliness of working or being in school at 1-year anniversary
| Outcome: | Discharged to home |
Reside at home at 1-year anniversary |
Work/School at 1-year anniversary |
||||||
|---|---|---|---|---|---|---|---|---|---|
| # Observations used | 1031: Yes = 917: No = 114 | 878: Yes = 828: No = 50 | 856: Yes = 236: No = 620 | ||||||
| Step 1: Pt characteristics: c/Max R2 | 0.78/0.21 | 0.68/0.07 | 0.81/0.32 | ||||||
| Step 2: Pt characteristics + treatments: c/Max R2 | 0.81/0.26 | 0.74/0.13 | 0.82/0.35 | ||||||
| Step 3: Pt characteristics + treatments + center identity: c/Max R2 | 0.83/0.31 | 0.75/0.14 | 0.82/0.36 | ||||||
| Independent Variables* | Parameter estimate | Odds ratio estimate | P Value | Parameter estimate | Odds ratio estimate | P Value | Parameter estimate | Odds ratio estimate | P Value |
| Injury group | – | – | <0.001 | ||||||
| C1-4 ABC | −2.003 | 0.135 | <0.001 | ||||||
| C5-8 ABC | −1.169 | 0.311 | <0.001 | ||||||
| Para ABC | −0.364 | 0.695 | 0.181 | ||||||
| All Ds (reference) | 0.000 | – | – | ||||||
| Admission FIM motor score-Rasch-transcribed | 0.053 | 1.054 | <0.001 | ||||||
| Comprehensive severity index | −0.012 | 0.988 | 0.001 | ||||||
| Days from trauma to rehabilitation admission | −0.009 | 0.991 | 0.020 | ||||||
| Traumatic etiology | – | – | 0.036 | ||||||
| Medical/surgical/other | −0.291 | 0.748 | 0.575 | ||||||
| Violence | 0.108 | 1.114 | 0.744 | ||||||
| Sports | 0.940 | 2.560 | 0.002 | ||||||
| Fall | 0.082 | 1.085 | 0.745 | ||||||
| Vehicular (reference) | 0.000 | – | – | ||||||
| Age at injury | −0.040 | 0.961 | <0.001 | −0.025 | 0.976 | 0.014 | −0.021 | 0.980 | 0.020 |
| Marital status = married | 0.714 | 2.043 | 0.005 | 1.040 | 2.829 | 0.005 | |||
| Race | 0.001 | ||||||||
| All other minorities | −0.807 | 0.446 | 0.067 | ||||||
| Black | −0.760 | 0.468 | 0.003 | ||||||
| Hispanic | −1.411 | 0.244 | 0.004 | ||||||
| White (reference) | 0.000 | – | – | ||||||
| Employment status at injury | . | . | <0.001 | ||||||
| Unemployed/other | −0.716 | 0.489 | 0.060 | ||||||
| Student | 1.444 | 4.236 | <0.001 | ||||||
| Retired | −0.629 | 0.533 | 0.269 | ||||||
| Working (reference) | 0.000 | – | –. | ||||||
| Highest education achieved | – | – | <0.001 | ||||||
| High school | 0.249 | 1.283 | 0.372 | ||||||
| College | 1.155 | 3.173 | <0.001 | ||||||
| <12 years/other/unknown (reference) | 0.000 | – | – | ||||||
| Primary language is English | 1.049 | 2.855 | 0.027 | ||||||
| Primary payer | – | – | <0.001 | ||||||
| Medicare | −0.998 | 0.369 | 0.107 | ||||||
| Medicaid | −0.839 | 0.432 | 0.002 | ||||||
| Worker's compensation | −1.008 | 0.365 | 0.006 | ||||||
| Private insurance/pay (reference) | 0.000 | – | – | ||||||
| Clinician experience index | 0.229 | 1.257 | <0.001 | −0.105 | 0.900 | 0.022 | 0.095 | 1.100 | 0.001 |
| Occupational therapy total hours | −0.011 | 0.990 | 0.003 | ||||||
| Psychology total hours | −0.031 | 0.970 | 0.017 | ||||||
| Registered nursing total hours | 0.013 | 1.013 | 0.015 | ||||||
| Therapeutic recreation total hours | 0.043 | 1.043 | 0.002 | 0.014 | 1.014 | 0.015 | |||
* All patient and treatment variables listed in Tables 1 and 2 were allowed to enter the models. Only significant predictors are reported here; a missing variable name means that variable did not predict any of the outcomes; a blank cell means that the variable was not a significant predictor for the outcome examined.
Of those contacted at their injury anniversary, 94% resided at home. Patient characteristics explained some of this variation (c statistic = 0.68, Max re-scaled R2 = 0.07), while the addition of discipline-specific treatment time increased the c statistic moderately (to 0.74 and the Max R2 to 0.13) (Table 4). Rehabilitation center added little additional predictive power (c statistic = 0.75, Max R2 = 0.14). Significant positive predictors included more time spent in TR during rehabilitation, speaking English as one's primary language, and being married. Negative predictors were older age, more time from trauma to rehabilitation admission, more time spent in OT, and treatment by clinicians with less experience in SCI rehabilitation.
Work/school status
Most of the variation in occupational status was explained by patient characteristics (c statistic = 0.81, Max R2 = 0.32); little additional variance was explained by treatment (c statistic = 0.82, Max R2 = 0.35) or center characteristics (c statistic = 0.82, Max R2 = 0.36). Patients with tetraplegia A, B, or C were less likely to be working or in school (Table 4). Patients who were younger, college-educated, injured in a sports-related activity, and who were employed or students before injury were more likely to be working or at school after injury. More time spent in TR and treatments by clinicians with more SCI rehabilitation experience also were associated with working or being in school. More time spent in psychology intervention was associated with less likelihood of working or being in school, as were patients with Workers’ compensation and Medicaid as payers of care.
Societal participation
Table 5 reports regression models predicting the four dimensions of the CHART: Physical Independence (R2 = 0.43 for patient and treatment variables combined), Social Integration (R2 = 0.14), Occupation (R2 = 0.26), and Mobility (R2 = 0.29). Various patient variables were significant predictors of one or more dimensions. Older age was associated with lower scores in all dimensions; higher admission motor FIM and college education were associated with higher scores, as was being married, except for the Physical Independence dimension. High tetraplegia AIS A, B, or C injuries were associated with lower Physical Independence, Occupation, and Mobility scores compared to AIS D injuries. Low tetraplegia AIS A, B, or C injuries were associated with lower Physical Independence and Mobility scores, and paraplegia A, B, or C injuries were associated with lower Occupation and Mobility scores compared to the AIS D group. Insurance payer played a significant role: Workers Compensation was associated with lower Physical Independence scores and Medicaid was associated with lower Social Integration, and Mobility subscores than private insurance. Being unemployed before injury was associated with lower Social Integration scores and being retired was associated with higher scores. Student status was associated with higher Occupation and Mobility scores. More time (total hours) spent in TR was associated with higher Social Integration, Occupation, and Mobility scores and more time in PT was associated with higher Physical Independence, Social Integration, and Mobility scores. More hours in psychology predicted lower physical independence. The addition of rehabilitation center to the models increased the value of c and R2 only slightly.
Table 5.
Prediction of social participation
| Outcome: | CHART: Physical independence |
CHART: Social integration |
CHART: Occupation |
CHART: Mobility |
||||||||
|---|---|---|---|---|---|---|---|---|---|---|---|---|
| # Observations used | 856 | 830 | 845 | 843 | ||||||||
| Step 1: Pt characteristics: adjusted R2 | 0.41 | 0.12 | 0.24 | 0.27 | ||||||||
| Step 2: Pt characteristics + treatments: adjusted R2 | 0.43 | 0.14 | 0.26 | 0.29 | ||||||||
| Step 3: Pt characteristics + treatments + center identity: adjusted R2 | 0.45 | 0.14 | 0.27 | 0.29 | ||||||||
| Independent variables* | Parameter estimate | P Value | Semi- partial Omega2 | Parameter estimate | P Value | Semi- partial Omega2 | Parameter estimate | P Value | Semi- partial Omega2 | Parameter estimate | P Value | Semi- partial Omega2 |
| Injury group | – | <0.001 | 0.025 | – | 0.007 | 0.008 | – | <0.001 | 0.014 | |||
| C1-4 ABC | −25.552 | <0.001 | – | −16.095 | 0.001 | – | −12.906 | <0.001 | – | |||
| C5-8 ABC | −12.913 | 0.001 | – | −8.662 | 0.056 | – | −8.501 | 0.003 | – | |||
| Para ABC | −5.912 | 0.068 | – | −7.233 | 0.049 | – | −7.675 | 0.001 | – | |||
| All Ds (Reference) | 0.000 | – | – | 0.000 | – | – | 0.000 | – | – | |||
| Admission FIM motor score-Rasch-transformed | 0.953 | <0.001 | 0.035 | 0.222 | <0.001 | 0.014 | 0.853 | <0.001 | 0.031 | 0.354 | <0.001 | 0.011 |
| Admission FIM cognitive score-Rasch-transformed | 0.108 | 0.006 | 0.007 | |||||||||
| Comprehensive severity index | −0.101 | 0.013 | 0.003 | |||||||||
| Days from trauma to rehabilitation admission | −0.246 | <0.001 | 0.030 | −0.120 | 0.004 | 0.006 | −0.110 | <0.001 | 0.014 | |||
| Traumatic etiology | – | 0.002 | 0.009 | – | 0.033 | 0.006 | ||||||
| Medical/surgical/other | −11.458 | 0.034 | – | −9.734 | 0.118 | – | ||||||
| Violence | −3.031 | 0.425 | – | −9.222 | 0.023 | – | ||||||
| Sports | −12.474 | <0.001 | – | 1.810 | 0.650 | – | ||||||
| Fall | −2.068 | 0.437 | – | −6.294 | 0.036 | – | ||||||
| Vehicular (reference) | 0.000 | – | – | 0.000 | – | – | ||||||
| Age at injury | −0.293 | <0.001 | 0.008 | −0.283 | <0.001 | 0.021 | −0.384 | <0.001 | 0.010 | −0.435 | <0.001 | 0.032 |
| Gender is male | −9.083 | 0.002 | 0.007 | |||||||||
| Marital status = married | 8.790 | <0.001 | 0.030 | 7.739 | 0.005 | 0.006 | 4.756 | 0.007 | 0.005 | |||
| Race | – | 0.021 | 0.005 | – | 0.010 | 0.007 | ||||||
| All other minorities | −9.857 | 0.040 | – | −4.168 | 0.236 | – | ||||||
| Black | −6.799 | 0.014 | – | −4.168 | 0.236 | – | ||||||
| Hispanic | 2.280 | 0.712 | – | −0.328 | 0.947 | – | ||||||
| White (reference) | 0.000 | – | – | 0.000 | – | – | ||||||
| Employment status at injury | – | <0.001 | 0.021 | – | 0.037 | 0.005 | – | 0.030 | 0.005 | |||
| Unemployed/other | −6.037 | 0.011 | – | −0.656 | 0.867 | – | −3.259 | 0.197 | – | |||
| Student | 1.185 | 0.614 | – | 9.929 | 0.012 | – | 5.417 | 0.033 | – | |||
| Retired | 11.281 | 0.001 | – | −8.413 | 0.101 | – | 2.574 | 0.462 | – | |||
| Working (Reference) | 0.000 | – | – | 0.000 | – | – | 0.000 | – | – | |||
| Highest education achieved | – | 0.001 | 0.008 | – | 0.007 | 0.008 | – | 0.000 | 0.020 | – | <0.001 | 0.017 |
| High school | 7.344 | 0.007 | – | 1.610 | 0.395 | – | 4.311 | 0.184 | – | 2.760 | 0.179 | – |
| College | 11.943 | <0.001 | – | 6.132 | 0.006 | – | 16.233 | 0.000 | – | 9.962 | <0.001 | – |
| <12 Years/other/unknown (reference) | 0.000 | – | – | 0.000 | – | – | 0.000 | – | – | 0.000 | – | – |
| Primary language is English | 13.227 | 0.011 | 0.005 | 13.593 | <0.001 | 0.011 | ||||||
| Primary payer | – | 0.016 | 0.005 | – | 0.004 | 0.011 | – | 0.011 | 0.007 | |||
| Medicare | −6.594 | 0.152 | – | −5.702 | 0.085 | – | 1.160 | 0.749 | – | |||
| Medicaid | −0.632 | 0.820 | – | −6.416 | 0.001 | – | −6.714 | 0.001 | – | |||
| Worker's compensation | −10.650 | 0.002 | – | −2.165 | 0.350 | – | 0.093 | 0.971 | – | |||
| Private insurance/pay (reference) | 0.000 | – | – | 0.000 | 0.000 | – | – | |||||
| Rehabilitation length of stay | −0.121 | 0.002 | 0.007 | |||||||||
| Psychology total hours | −0.401 | 0.002 | 0.006 | |||||||||
| Physical therapy total hours | 0.184 | <0.001 | 0.016 | 0.053 | 0.015 | 0.005 | 0.141 | <0.001 | 0.011 | |||
| Therapeutic recreation total hours | 0.121 | 0.006 | 0.007 | 0.291 | 0.000 | 0.013 | 0.164 | 0.001 | 0.009 | |||
* All patient and treatment variables listed in Tables 1 and 2 were allowed to enter the models. Only significant predictors are reported here; a missing variable name means that variable did not predict any of the outcomes; a blank cell means that the variable was not a significant predictor for the outcome examined.
Mood state and life satisfaction
PHQ-9 interview questions were completed by 78% of patients. PHQ-9 scores range from 0 to24. The mean score was 4.5 and IQR was 1–7; 23% of responses were 0 (floor) and 0.25% were 24 (ceiling). Patient characteristics and treatment time by specific-rehabilitation disciplines were weak predictors of depressive symptomatology, as measured by the PHQ-9 (R2 = 0.07) (data not shown). Longer time from injury to rehabilitation admission, being unemployed prior to injury, having a work-related injury, and more time spent in ST were associated with higher PHQ-9 scores; male gender and obesity (BMI ≥30) were associated with lower scores. The addition of rehabilitation center to the model increased the R2 only slightly, to 0.08.
SWLS scores range from 5 (no satisfaction) to 35 (completely satisfied). The mean SWLS score was 20.8, IQR 15–26. Three percent were at level 5 (floor) and 2% at level 35 (ceiling). Models predicting SWLS also were weak; the adjusted R2 for patient and treatment time variables is 0.10 (data not shown). Variables associated with less satisfaction included: older age, high tetraplegia, and paraplegia (vs. AIS D injuries), being unemployed prior to injury, Medicaid or workers compensation as payer (private insurance is reference), and more time spent in psychology interventions. Treatment by clinicians with more SCI rehabilitation experience and more time spent in TR were associated with higher life satisfaction. Again, rehabilitation center added only 0.01 to the explanatory power.
Rehospitalization
Patients with AIS A, B, or C injuries were more likely to be rehospitalized than patients with AIS D injuries (Table 6). Older age, greater medical severity, more time from injury to rehabilitation admission, and Medicaid as payer also were associated with higher likelihood of rehospitalization, as was more time spent by registered nurses providing education and care management. Higher admission motor FIM and more time in PT and TR were associated with lower risk of rehospitalization (c statistic = 0.72, Max R2 = 0.19). Adding rehabilitation center as a predictor variable did not enhance prediction.
Table 6.
Prediction of rehospitalization and pressure sore at 1-year anniversary
| Outcomes: | Rehospitalized between discharge and 1-year anniversary |
Pressure sore at 1-year anniversary |
||||
|---|---|---|---|---|---|---|
| # Observations used | 949: Yes = 343: No = 606 | 935: Yes = 128: No = 807 | ||||
| Step 1: Pt characteristics: c/Max R2 | 0.66/0.10 | 0.67/0.08 | ||||
| Step 2: Pt characteristics + treatments: c/Max R2 | 0.72/0.19 | 0.74/0.14 | ||||
| Step 3: Pt characteristics + treatments + center identity: c/Max R2 | 0.72/0.19 | 0.74/0.15 | ||||
| Independent variables* | Parameter estimate | Odds ratio estimate | P Value | Parameter estimate | Odds ratio estimate | P Value |
| Injury group | – | – | 0.005 | – | – | 0.002 |
| C1-4 ABC | 0.786 | 2.195 | 0.017 | 0.536 | 1.709 | 0.308 |
| C5-8 ABC | 0.881 | 2.414 | 0.005 | 1.009 | 2.743 | 0.048 |
| Para ABC | 0.913 | 2.492 | <0.001 | 1.591 | 4.908 | <0.001 |
| All Ds (Reference) | 0.000 | – | – | 0.000 | – | – |
| Admission FIM motor score-Rasch-transformed | −0.022 | 0.979 | 0.028 | −0.042 | 0.958 | 0.003 |
| Comprehensive severity index | 0.011 | 1.011 | 0.000 | 0.013 | 1.013 | 0.001 |
| Days from trauma to rehabilitation admission | 0.006 | 1.006 | 0.020 | 0.008 | 1.008 | 0.009 |
| Age at injury | 0.013 | 1.013 | 0.018 | |||
| Primary payer | – | – | 0.003 | |||
| Medicare | 0.415 | 1.515 | 0.195 | |||
| Medicaid | 0.638 | 1.893 | <0.001 | |||
| Worker's compensation | 0.471 | 1.602 | 0.063 | |||
| Private insurance/pay (reference) | 0.000 | – | – | |||
| Occupational therapy total hours | 0.011 | 1.011 | 0.026 | |||
| Physical therapy total hours | −0.020 | 0.980 | <0.001 | −0.019 | 0.981 | 0.001 |
| Registered nursing total hours | 0.008 | 1.008 | 0.037 | |||
| Speech language pathology total hours | −0.030 | 0.971 | 0.017 | |||
| Therapeutic recreation total hours | −0.015 | 0.986 | 0.010 | −0.018 | 0.982 | 0.023 |
*All patient and treatment variables listed in Tables 1 and 2 were allowed to enter the models. Only significant predictors are reported here; a missing variable name means that variable did not predict any of the outcomes; a blank cell means that the variable was not a significant predictor for the outcome examined.
Pressure ulcer at 1 year
Patients with paraplegia were five times as likely to report a pressure ulcer at the injury anniversary, as were patients with AIS D injuries (Table 6). Low tetraplegia, lower admission motor FIM scores, higher medical severity, and longer time from injury to rehabilitation admission also were associated with greater likelihood of reporting a pressure ulcer. More total hours of PT, TR, and ST were associated with a reduced likelihood of a pressure ulcer at the anniversary, and more hours of OT were associated with an increased likelihood (c statistic = 0.74, Max R2 = 0.14). The addition of rehabilitation center did not increase the c statistic; the Max R2 increased to only 0.15.
Model validation
Linear regression models that validated well (relative shrinkage <0.1) included: motor FIM score at discharge and 1-year anniversary and CHART Physical Independence score. Models for CHART Social Integration and Occupation validated moderately well (relative shrinkage 0.1–0.2). Several models validated poorly with relative shrinkage greater than 0.2: CHART Mobility, PHQ-9, and Life Satisfaction. For dichotomous outcomes all models validated well (HL P value >0.1 for both), except for discharge location, which showed some lack of fit (HL P value <0.05 for one or both models).
Discussion
This article, which serves as an introduction to the discipline-specific articles that follow, reports a large number of associations between injury-related, demographic, and rehabilitation discipline treatment time (predictor variables) of a variety of outcomes: functional status and residence at discharge and the 1-year anniversary, participation, life satisfaction, depressive symptoms, rehospitalization, and presence of pressure sore at the anniversary. The authors emphasize that these are correlational data and do not imply causality, as in the finding that more PSY time is associated with a lower likelihood of working or being in school at the 1-year injury anniversary and that more OT hours is associated with increased likelihood of pressure sores.
Patient (demographic and injury) characteristics are strong predictors of functional status at discharge and 1-year anniversary. Neurological category is relevant to motor FIM at discharge and 1 year, and to three CHART components: mobility, occupation, and physical independence. It also predicts rehospitalization and the presence of pressure ulcers, but somewhat surprisingly not residence on discharge or at 1 year. The neurological grouping as used here (high and low tetraplegia, paraplegia, and motor functional ASIA score at any level) is rather crude, and it is not surprising that functional status on rehabilitation admission as reflected in the FIM Motor score also predicts functional status, participation, and health outcomes, in the direction expected. It is a predictor for residence upon discharge, but not at the first anniversary of injury. The cognitive-communicative component of the FIM plays a minor role, presumably because there is limited variation in cognitive ability in an SCI sample. A higher admission cognitive FIM score predicts a lower FIM motor score on discharge and at one year, presumably reflecting that persons with tetraplegia are more likely to have incurred a concomitant brain injury.61 In addition, the admission cognitive FIM is a predictor of social integration at the time of the year one interview.
Older age is consistently predictive of poorer outcomes (except for the presence of pressure ulcers). This presumably reflects the generally poorer health status of older people and their more limited physical and cognitive reserves. One might have thought that the FIM functional status and CSI co-morbidity variables would reflect those components of age, but that is not entirely the case. In the presence of the various other patient-level variables used as predictors, the CSI score only predicts residence on discharge, physical independence, and the two health outcomes, rehospitalization and pressure ulcer development. The number of days that elapsed between injury and rehabilitation admission is a predictor more often than CSI is and also can be assumed to reflect (acute) morbidity: those with a longer span between injury and admission to rehabilitation have poorer outcomes for most of the factors considered here. BMI, yet another health factor, only predicts FIM motor score at discharge; dichotomization of this continuous variable into obese vs. non-obese may have obscured the role that weight plays after SCI.
Social issues also are important predictors. Being married (rather than single) is predictive of good outcomes in terms of residence and most CHART dimensions. Where race and ethnicity emerge as predictors, minorities have poorer outcomes than non-Hispanic whites. Gender is a relevant factor only once, with males scoring lower on CHART Occupation than females.
Pre-injury primary occupational status predicts only aspects of participation, with those who were unemployed doing poorer and students doing better than persons who were employed. Education level only plays a role in predicting participation outcomes, with those with at least a college education doing better than the reference group of individuals who did not complete high school. Those who are fluent in English are likely to score higher on Mobility and Occupation than individuals who speak no English or a limited amount. Language also is a predictor of residence at first anniversary, with those who are fluent in English more likely to reside in a private home.
Finally, insurance coverage is a predictor for many of the outcomes of interest; Medicare, Medicaid, and Workers Compensation all predict poorer outcomes than private insurance. The fact that most of the outcomes in question are either at 1 year or are part of the participation cluster suggests that it is not the coverage per se, but social and other circumstances associated with insurance coverage that affect overall functioning.
These individual-level variables together explain a portion of the variance that differs from one outcome to the next, with the percentage varying more or less with distance from the rehabilitation phase (discharge status is predicted better than status at 1 year or occurrences in the period intervening) and social vs. medical nature of the outcome (functional status is predicted better than working/going to school or social integration). Adding treatment variables to the set of predictors generally improves the variance that is explained, but on a limited basis. Plus, in many instances the findings are counterintuitive.
Length of the rehabilitation stay is only a factor twice: a longer stay predicts a lower discharge FIM motor score and a lower score on CHART mobility. Unless one believes that more rehabilitation makes people's situation worse (and for some reason only in these two areas) the explanation must be that, with many aspects of pre-injury and post-injury status being controlled, LOS here is more a marker of need for rehabilitation than an indicator of resources consumed by the person. The same is true in a few instances of the total hours of treatment received. While generally, more treatment time by the various disciplines is predictive of better outcomes, there are notable exceptions. PT hours predict good outcomes almost across the range, but where OT hours are significant, they have a negative role: more hours of OT across the stay predict lower FIM motor score on discharge, institutional residence at 1 year, and more chance of a pressure ulcer. A possible explanation is that receipt of many OT treatment hours means special needs (not reflected in other predictors used here such as functional status or co-morbidities). Given that there is still quite some variation in terms of functional status and potential within the neurological categories used here, the idea that OT hours function as a marker of need rather than an indicator of need satisfaction is a possibility. Alternatively, given the fact that more than 3 hours of therapy per day is more than patients can handle or programs can effectively deliver, time spent giving OT therapy cannot be used to deliver another, potentially more necessary therapy (a so-called opportunity cost).
The only other disciplines with a similar phenomenon are psychology and social work/case management. The more hours of psychology treatment, the less physical independence, and the less likelihood of being in school or employed. The more hours of time the social worker and case manager spent with and for the patient, the lower the FIM motor score at 1 year. Again, hours of therapy received may be a need indicator, with those who had greater emotional distress during rehabilitation being least prepared to resume participating in household, community, and society afterwards, and those patients with least physical abilities needing the most intense efforts for successful placement and arrangement of services.
What is noticeable is that treatment efforts do not play a strong role in all outcomes of interest, and that treatment time adds relatively little variance over and above what the “patient-level” predictors contribute. One possible explanation is that it is not the hours of treatment that make a difference, but the contents of those therapy hours. The discipline-specific analyses published in this issue give some idea as to the benefits of specific therapies for identified outcomes. It is also possible that, because disciplines overlap to some degree in their therapy offerings, differences resulting from the shortage or surplus of one particular discipline are blunted.
The clinician experience measure, an indicator of the expertise rehabilitation teams have available, played a limited role in predicting outcomes, and in doing so did not show consistency: those patients whose team had more experience were more likely to be discharged to a private residence, but less likely to live there at the anniversary of injury. Clinician experience also was associated with work/school at 1 year, but not with more proximal or broader outcomes. It is unclear whether the explanation is that there is limited patient-to-patient variation in average team experience, or that years delivering SCI treatment is not a good indicator of expertise, or that expertise is of limited importance compared to the hours of treatment one receives, overall or from specific disciplines.
If generally the treatment variables considered here added little explanatory power to the individual-level variables, the same holds true for center identity. The six SCIRehab centers differ in a number of aspects – government reimbursement status (inpatient rehabilitation facility vs. long-term acute care hospital), number of patients with SCI seen yearly, affiliation or link with an acute-care hospital, organization of rehabilitation teams, etc. The fact that facility identity makes little difference means that the SCIRehab investigators selected the crucial individual and therapy predictors, or that additional predictors at the program level are not arranged in such a way to coincide with identity – for instance, the hospital with the very effective admissions department does not also have the best selection of up-to-date equipment, etc.
Study limitations
A number of issues should be kept in mind in evaluating the findings of this report. The participating facilities varied in terms of setting, care delivery patterns, and patient clinical and demographic characteristics; they were selected based on their willingness to participate, geographic diversity, and expertise in treatment of patients with SCI. However, they are not a probability sample of the rehabilitation facilities that provide care for patients with SCI in the United States. Thus, generalizability to all rehabilitation centers is uncertain and it should be noted that the extent of bias resulting from unique referral patterns and from the fact that 9% of the eligible patients refused enrollment is unknown.
No data were collected for the hours of treatment delivered by respiratory care, chaplaincy, and rehabilitation engineering; these disciplines tend to deliver small and less easily quantifiable amounts of care. Therapies that provide few services still may have a major impact on patient outcomes, as may the activities of the attending and consulting physicians. While most of the work of rehabilitation physicians involves patient assessment and ordering of therapies, the counseling of patient and family that physicians perform was not documented. A large component of nursing care, including the time spent in bathing/hygiene activities, wound care, medication administration, bladder and bowel management, and other activities is not included in the data reported here. Only patient teaching and care management by rehabilitation nurses with at least RN preparation were recorded in the supplemental documentation.
Treatment time reported may have been in error through omissions, duplicate reports, and documentation errors within reported sessions. We sought to minimize these errors by comparing therapist reports with billing and other information to identify missed sessions retroactively. Reporting the demographic and injury information, neurological classification, and the Comprehensive Severity Index relied on abstracting of the medical record. As is common, these records sometimes had missing or ambiguous information, which could not always be supplemented from other documents or clinician memory. The payer reported is the one responsible for the inpatient rehabilitation program, but post-rehabilitation services, which may be of more relevance to the 1-year outcomes reported here, may have been the responsibility of another entity. The outcome measures used, including the Rasch-transformed FIM, have their own weaknesses. While the Rasch-transformed FIM improves the psychometric properties of FIM, it does not changes the items measured, which may not be ideal for SCI. Alternative systems such as the Spinal Cord Independence Measure (SCIM) have been developed because the FIM is not optimal to reflect the functioning of individuals with SCI. Findings might have been somewhat different for other significant outcomes of rehabilitation, such as positive mental health and various secondary conditions other than pressure ulcers, for example, spasticity. While regression analyses were validated on a 25% sample to reduce the likelihood of spurious findings being reported, this does eliminate that possibility. Lastly, the treatment variables were limited to that what was done during inpatient rehabilitation; it is known that many post-SCI therapies are being shifted to the outpatient setting, especially OT and PT,62 and the influence of the outpatient treatments the SCIRehab patients received after discharge is not considered here at all.
Conclusion
Various outcomes of SCI rehabilitation, at discharge and 1 year after injury, were explained by patient characteristics, whether pre-injury or injury related. The amount of treatment received during inpatient rehabilitation from various disciplines appears to explain limited or even little additional variance. The reasons for this, and the phenomenon that sometimes more hours of service predict poorer outcome, need additional study. The following seven papers in this SCIRehab series analyze specific treatments provided by each discipline and shed considerable light on relationships of therapeutic interventions with outcomes.
Acknowledgements
The contents of this paper were developed under grants from the National Institute on Disability and Rehabilitation Research, Office of Rehabilitative Services, US Department of Education, to Craig Hospital (grant numbers H133A060103 and H133N060005) and to The Mount Sinai School of Medicine (grant number H133N060027), and Rehabilitation Institute of Chicago (grant number H133N060014). The opinions contained in this publication are those of the grantees and do not necessarily reflect those of the US Department of Education.
Special thanks to Craig Hospital: Daniel P. Lammertse, MD, Susan Charlifue, PhD, William Scelza, MD; Mount Sinai Medical Center: Jeanne Zanca, PhD; MedStar National Rehabilitation Center: Gerben DeJong, PhD, Ching-Hui Hsieh, PhD, Pamela Ballard, MD; Shepherd Center: David Apple, MD, Deborah Backus PhD; Rehabilitation Institute of Chicago: David Chen, MD; Indiana University, Flora Hammond, MD.
References
- 1.Berns S, Lowman E, Rusk H, Covalt D. (eds.) Spinal cord injury. Rehabilitation costs and results in 31 successive cases including a follow-up study. New York: The Institute of Physical Medicine and Rehabilitation, New York University-Bellevue Medical Center; 1957. Rehabilitation Monograph XIII [Google Scholar]
- 2.Parent S, Barchi S, LeBreton M, Casha S, Fehlings M. The impact of specialized centers of care for spinal cord injury on length of stay, complications, and mortality: a systematic review of the literature. J Neurotrauma 2011;28(8):1363–70 [DOI] [PMC free article] [PubMed] [Google Scholar]
- 3.Keith R, Granger C, Hamilton B, Sherwin F. The functional independence measure: a new tool for rehabilitation. Adv Clin Rehabil 1987;1:6–18 [PubMed] [Google Scholar]
- 4.Granger C, Hamilton B, Linacre J, Heinemann A, Wright B. Performance profiles of the functional independence measure. Am J Phys Med Rehabil 1993;72(2):84–9 [DOI] [PubMed] [Google Scholar]
- 5.Whiteneck G, Brooks C, Charlifue S, Gerhart K, Mellick D, Overholser D, et al. (eds.) Guide for use of CHART: Craig Handicap Assessment and Reporting Technique. Englewood, CO: Craig Hospital; 1992 [Google Scholar]
- 6.Whiteneck G, Gassaway J, Dijkers M, Charlifue S, Backus D, Chen D, et al. Inpatient treatment time across disciplines in spinal cord injury rehabilitation. J Spinal Cord Med 2011;34(11):133–48 [DOI] [PMC free article] [PubMed] [Google Scholar]
- 7.Heinemann A, Hamilton B, Linacre J, Wright B, Granger C. Functional status and therapeutic intensity during inpatient rehabilitation. Am J Phys Med Rehabil 1995;74(4):315–26 [DOI] [PubMed] [Google Scholar]
- 8.Heinemann AW, Kirk P, Hastie BA, Semik P, Hamilton BB, Linacre JM, et al. Relationships between disability measures and nursing effort during medical rehabilitation for patients with traumatic brain and spinal cord injury. Arch Phys Med Rehabil 1997;78(2):143–9 [DOI] [PubMed] [Google Scholar]
- 9.Whiteneck G, Gassaway J, Dijkers M, Jha A. New approach to study the contents and outcomes of spinal cord injury rehabilitation: the SCIRehab Project. J Spinal Cord Med 2009;32(3):251–9 [DOI] [PMC free article] [PubMed] [Google Scholar]
- 10.Gassaway J, Whiteneck G, Dijkers M. Clinical taxonomy development and application in spinal cord injury research: the SCIRehab Project. J Spinal Cord Med 2009;32(3):260–9 [DOI] [PMC free article] [PubMed] [Google Scholar]
- 11.Abeyta N, Freeman E, Primack D, Harmon A, Dragon C, Hammond F, et al. SCIRehab: the social work/case management taxonomy. J Spinal Cord Med 2009;32(3):335–41 [DOI] [PMC free article] [PubMed] [Google Scholar]
- 12.Cahow C, Skolnick S, Joyce J, Jug J, Dragon C, Gassaway J. SCIRehab: the therapeutic recreation taxonomy. J Spinal Cord Med 2009;32(3):297–305 [DOI] [PMC free article] [PubMed] [Google Scholar]
- 13.Natale A, Taylor S, LaBarbera J, Mumma S, Bensimon L, McDowell S, et al. SCIRehab: the physical therapy taxonomy. J Spinal Cord Med 2009;32(3):270–82 [DOI] [PMC free article] [PubMed] [Google Scholar]
- 14.Johnson K, Bailey J, Rundquist J, Dimond P, McDonald C, Reyes I, et al. SCIRehab: the supplemental nursing taxonomy. J Spinal Cord Med 2009;32(3):328–34 [DOI] [PMC free article] [PubMed] [Google Scholar]
- 15.Ozelie R, Sipple C, Foy T, Cantoni K, Kellogg K, Lookingbill J, et al. SCIRehab: the occupational therapy taxonomy. J Spinal Cord Med 2009;32(3):283–96 [DOI] [PMC free article] [PubMed] [Google Scholar]
- 16.Wilson C, Huston T, Koval J, Gordon S, Schwebel A, Gassaway J. SCIRehab: the psychology taxonomy. J Spinal Cord Med 2009;32(3):318–27 [DOI] [PMC free article] [PubMed] [Google Scholar]
- 17.Gordan W, Dale B, Brougham R, Spivack-David D, Georgeadis A, Adornato V, et al. SCIRehab: the speech language pathology taxonomy. J Spinal Cord Med 2009;32(3):306–17 [DOI] [PMC free article] [PubMed] [Google Scholar]
- 18.Hammond F, Gassaway J, Abeyta N, Freeman E, Primack D. Social work and case management treatment time during inpatient spinal cord injury rehabilitation. J Spinal Cord Med 2011;34(2):216–26 [DOI] [PMC free article] [PubMed] [Google Scholar]
- 19.Taylor-Schroeder S, LaBarbera J, McDowell S, Zanca J, Natale A, Mumma S, et al. Physical therapy treatment time during inpatient spinal cord injury rehabilitation. J Spinal Cord Med 2011;34(2):149–61 [DOI] [PMC free article] [PubMed] [Google Scholar]
- 20.Gassaway J, Dijkers M, Rider C, Edens K, Cahow C, Joyce J. Therapeutic recreation treatment time during inpatient spinal cord injury rehabilitation. J Spinal Cord Med 2011;34(2):176–85 [DOI] [PMC free article] [PubMed] [Google Scholar]
- 21.Huston T, Gassaway J, Wilson C, Gordon C, Koval J, Schwebel A. Psychology treatment time during inpatient spinal cord injury rehabilitation. J Spinal Cord Med 2011;2011(2):196–204 [DOI] [PMC free article] [PubMed] [Google Scholar]
- 22.Rundquist J, Gassaway J, Bailey J, Lingefelt P, Reyes I, Thomas J. Nursing bedside education and care management time during inpatient spinal cord rehabilitation. J Spinal Cord Med 2011;34(2):205–15 [DOI] [PMC free article] [PubMed] [Google Scholar]
- 23.Foy T, Perritt G, Thimmaiah D, Heisler L, Offutt J, Cantoni K, et al. Occupational therapy treatment time during inpatient spinal cord injury rehabilitation. J Spinal Cord Med 2011;34(2):162–75 [DOI] [PMC free article] [PubMed] [Google Scholar]
- 24.Brougham R, Spivack-David D, Adornato V, Gordan W, Dale B, Geordeadis A, et al. SCIRehab: speech language pathology therapy treatment time during inpatient spinal cord injury rehabilitation: the SCIRehab project. J Spinal Cord Med 2011;34(2):186–96 [DOI] [PMC free article] [PubMed] [Google Scholar]
- 25.Marino R, Ditunno JJ, Donovan W, Maynard F. Neurologic recovery after traumatic spinal cord injury: data from the model spinal cord injury systems. Arch Phys Med Rehabil 1999;80(11):1391–96 [DOI] [PubMed] [Google Scholar]
- 26.Sipski M, Jackson A, Gomez-Marin O, Estores I, Stein A. Effects of gender on neurologic and functional recovery after spinal cord injury. Arch Phys Med Rehabil 2004;85(11):1826–36 [DOI] [PubMed] [Google Scholar]
- 27.Cifu D, Seel R, Kreutzer J, McKinley W. A multicenter investigation of age-related differences in lengths of stay, hospitalization charges, and outcomes for a matched tetraplegia sample. Arch Phys Med Rehabil 1999;80(7):733–40 [DOI] [PubMed] [Google Scholar]
- 28.Seel R, Huang M, Cifu D, Kolakowsky-Hayner S, McKinley W. Age-related differences in length of stays, hospitalization costs, and outcomes for an injury-matched sample of adults with paraplegia. J Spinal Cord Med 2001;24(4):241–50 [DOI] [PubMed] [Google Scholar]
- 29.Burnett D, Kolakowsky-Hayner S, White J, Cifu D. Impact of minority status following traumatic spinal cord injury. NeuroRehabilitation 2002;17(3):187–94 [PubMed] [Google Scholar]
- 30.Nair K, Taly A, Maheshwarappa B, Kumar J, Murali T, Rao S. Nontraumatic spinal cord lesions: a prospective study of medical complications during in-patient rehabilitation. Spinal Cord 2005;43(9):558–64 [DOI] [PubMed] [Google Scholar]
- 31.Kalpakjian C, Houlihan B, Meade M, Karana-Zebari D, Heinemann A, Dijkers M, et al. Marital status, marital transitions, well-being, and spinal cord injury: an examination of the effects of sex and time. Arch Phys Med Rehabil 2011;92(3):433–40 [DOI] [PMC free article] [PubMed] [Google Scholar]
- 32.Roach M. Community social structure as an indicator of social integration and its effect on quality of life for persons with a spinal cord injury. Top Spinal Cord Inj Rehabil 2002;7(3):101–11 [Google Scholar]
- 33.Dijkers M, Yavuzer G, Ergin S, Weitzenkamp D, Whiteneck G. A tale of two countries: environmental impacts on social participation after spinal cord injury. Spinal Cord 2002;40(7):351–62 [DOI] [PubMed] [Google Scholar]
- 34.Horn S. Clinical practice improvement: improving quality and decreasing cost in managed care. Med Interface 1995;8(7):60–64,70 [PubMed] [Google Scholar]
- 35.Horn S. Clinical practice improvement: a new methodology for outcomes research. Nutrition 1996;12(5):384–5 [DOI] [PubMed] [Google Scholar]
- 36.Horn S, Gassaway J. Practice based evidence: incorporating clinical heterogeneity and patient-reported outcomes for comparative effectiveness research. Med Care 2010;48(6):17–22 [DOI] [PubMed] [Google Scholar]
- 37.Horn S, Gassaway J. Practice-based evidence study design for comparative effectiveness research. Med Care 2007;4510 Supplement 2:S50–7 [DOI] [PubMed] [Google Scholar]
- 38.Gassaway J, Horn S, DeJong G, Smout R, Clark C, James R. Applying the clinical practice improvement approach to stroke rehabilitation: methods used and baseline results. Arch Phys Med Rehabil 2005;8612 Supplement 2:S16–33 [DOI] [PubMed] [Google Scholar]
- 39.Horn S, DeJong G, Ryser D, Veazie P, Teraoka J. Another look at observational studies in rehabilitation research: going beyond the holy grail of the randomized controlled trial. Arch Phys Med Rehabil 2005;8612 Supplement 2:S8–15 [DOI] [PubMed] [Google Scholar]
- 40.Whiteneck G, Dijkers M, Gassaway J, Lammertse D. Classifications and quantification of spinal cord injury rehabilitation treatments. J Spinal Cord Med 2009;32(3):249–50 [PMC free article] [PubMed] [Google Scholar]
- 41.National Spinal Cord Injury Statistical Center. Data collection syllabus for the national spinal cord injury database: 2006–2011 project period. Birmingham, AL: University of Alabama; 2011.
- 42.Marino R. (ed.) Reference manual for the International Standards for Neurological Classification of spinal cord injury. Chicago, IL: American Spinal Injury Association; 2003 [DOI] [PubMed] [Google Scholar]
- 43.Fiedler R, Granger C, Russell C. UDS(MR)SM: follow-up data on patients discharged in 1994–1996. Am J Phys Med Rehabil 2000;79(2):184–92 [DOI] [PubMed] [Google Scholar]
- 44.Fiedler R, Granger C. Functional Independence Measure: a measurement of disability and medical rehabilitation. In: Chino N, Melvin J. (eds.) Functional evaluation of stroke patients. Tokyo: Springer-Verlag; 1996. p. 75–92 [Google Scholar]
- 45.Horn S, Sharkey P, Buckle J, Backofen J, Averill R, Horn R. The relationship between severity of illness and hospital length of stay and mortality. Med Care 1991;29(4):305–17 [DOI] [PubMed] [Google Scholar]
- 46.Horn S. (ed.) Clinical practice improvement: implementation and evaluation. New York, NY: Faulkner and Gray; 1997 [Google Scholar]
- 47.Ryser D, Egger M, Horn S, Handrahan D, Ghandi P, Bigler E. Measuring medical complexity during inpatient rehabilitation following traumatic brain injury. Arch Phys Med Rehabil 2005;86:1108–17 [DOI] [PubMed] [Google Scholar]
- 48.Averill R, McGuire T, Manning B, Fowler D, Horn S, Dickson P, et al. A study of the relationship between severity of illness and hospital cost in New Jersey hospitals. Health Serv Res 1992;27(5):587–617 [PMC free article] [PubMed] [Google Scholar]
- 49.Clemmer T, Spuhler V, Oniki T, Horn S. Results of a collaborative quality improvement program on outcomes and costs in a tertiary critical care unit. Crit Care Med 1999;27(9):1768–74 [DOI] [PubMed] [Google Scholar]
- 50.Horn S, Torres AJ, Willson D, Dean J, Gassaway J, Smout R. Development of a pediatric age- and disease-specific severity measure. J Pediatrics 2002;141(4):496–503 [DOI] [PubMed] [Google Scholar]
- 51.Willson D, Horn S, Smout R, Gassaway J, Torres A. Severity assessment in children hospitalized with bronchiolitis using the pediatric component of the Comprehensive Severity Index (CSI®). Pediatr Crit Care Med 2000;1(2):127–32 [DOI] [PubMed] [Google Scholar]
- 52.DeJong G, Hsieh C, Gassaway J, Horn S, Smout R, Putman K, et al. Characterizing rehabilitation services for patients with knee and hip replacement in skilled nursing and inpatient rehabilitation facilities. Arch Phys Med Rehabil 2009;90(8):1284–96 [DOI] [PubMed] [Google Scholar]
- 53.Hall J, Dijkers M, Whiteneck G, Brooks C, Krause J. The Craig Handicap Assessment and Reporting Technique (CHART): Metric properties and scoring. Top Spinal Cord Inj Rehabil 1998;4(1):16–30 [Google Scholar]
- 54.Mellick D, Walker N, Brooks C, Whiteneck G. Incorporating the cognitive independence domain into CHART. J Rehabil Outcomes Meas 1999;3(3):12–21 [Google Scholar]
- 55.Diener E, Emmons R, Larsen J, Griffin S. The satisfaction with life scale. J Pers Assess 1985;49(1):71–5 [DOI] [PubMed] [Google Scholar]
- 56.Spitzer R, Kroenke K, Williams J. Validation and utility of a self-report version of PRIME-MD: the PHQ primary care study. Primary care evaluation of mental disorders. Patient health questionnaire. JAMA 1999;282(18):1737–44 [DOI] [PubMed] [Google Scholar]
- 57.Mallinson T. Rasch analysis of repeated measures. Rasch Meas Trans 2011;25(1), 1317 [accessed 2012 Jan 10]. Available from: http://www.rasch.org/rmt/rmt251b.htm [Google Scholar]
- 58.Ottenbacher K. Commentary. The post-stroke rehabilitation outcomes project. Arch Phys Med Rehabil 2005;86(12):121–3 [DOI] [PubMed] [Google Scholar]
- 59.Jette A. Commentary. The post-stroke rehabilitation outcomes project. Arch Phys Med Rehabil 2005;86(12):124–5 [DOI] [PubMed] [Google Scholar]
- 60.Nizam A, Kleinbaum D, Muller K, Kupper L. Applied regression analysis and other multivariable methods. 3rd ed Pacific Grove, CA: Duxbury Pr; 1998 [Google Scholar]
- 61.Macciocchi S, Seel R, Thompson N, Byams R, Bowman B. Spinal cord injury and co-occurring traumatic brain injury: assessment and incidence. Arch Phys Med Rehabil 2008;89(7):1350–7 [DOI] [PubMed] [Google Scholar]
- 62.Whiteneck G, Gassaway J, Dijkers M, Lammertse D, Hammond F, Heinemann A, et al. Inpatient and post-discharge rehabilitation services provided in the first year after spinal cord injury: findings from the SCIRehab study. Arch Phys Med Rehabil 2010;92(3):361–8 [DOI] [PubMed] [Google Scholar]