

Abstract
Functional magnetic resonance imaging (fMRI) studies of early sensory cortex often measure stimulus-driven increases in the blood oxygenation level-dependent (BOLD) signal. However, these positive responses are frequently accompanied by reductions in the BOLD signal in adjacent regions of cortex. Although this negative BOLD response (NBR) is thought to result from neuronal suppression, the precise relationship between local activity, suppression, and perception remains unknown. By measuring BOLD signals in human primary visual cortex while varying the baseline contrast levels in the region affected by the NBR, we tested three physiologically plausible computational models of neuronal modulation that could explain this phenomenon: a subtractive model, a response gain model, and a contrast gain model. We also measured the ability of isoluminant contrast to generate an NBR. We show that the NBR can be modeled as a pathway-specific contrast gain modulation that is strongest outside the fovea. We found a similar spatial bias in a psychophysical study using identical stimuli, although these data indicated a response gain rather than a contrast gain mechanism. We reconcile these findings by proposing (1) that the NBR is associated with a long-range suppressive mechanism that hyperpolarizes a subset of magnocellularly driven neurons at the input to V1, (2) that this suppression is broadly tuned to match the spatial features of the mask region, and (3) that increasing the baseline contrast in the suppressed region drives all neurons in the input layer, reducing the relative contribution of the suppressing subpopulation in the fMRI signal.
Introduction
Researchers using functional magnetic resonance imaging (fMRI) often observe a stimulus-driven reduction in the fMRI in the blood oxygenation [blood oxygenation level-dependent (BOLD)] signal in response to a visual stimulus. This “negative BOLD response” (NBR) occurs within retinotopic sensory cortex at some distance from the directly stimulated region (Tootell et al., 1998a; Harel et al., 2002; Shmuel et al., 2002; Smith et al., 2004). The NBR is time-locked to the onset of the stimulus and has a similar time course to the positive BOLD response (PBR) (Shmuel et al., 2002, 2006). Although hemodynamic effects may explain a small part of the NBR (Harel et al., 2002; Boas et al., 2008), two observations suggest that the effect is mostly driven by active neuronal mechanisms. First, the NBR can be found in the opposite cerebral hemisphere to the PBR (Smith et al., 2004). Because there is no spatially specific vascular coupling between the two halves of primate visual cortex, no hemodynamic mechanism could generate a response of this type. Second, and more directly, it has been shown that the NBR is temporally and spatially correlated with a decrease in membrane potential corresponding to an active suppressive mechanism (Shmuel et al., 2006; Devor et al., 2007). In primate visual cortex (Shmuel et al., 2006), this leads to a measurable reduction in the baseline neural spiking rate (Shmuel et al., 2006).
The NBR therefore appears to reflect suppression of neural activity at a population level. Here, we describe how we were able to test three standard computational models of neural suppression by measuring the size of the NBR as a function of ongoing activity in an annular subregion of the parafovea.
Our experiments contained stimuli in which the annulus itself had a high, near-saturating contrast while the central “inducer” region was blank. We expected these conditions to generate an NBR in the foveal representation of primary visual cortex, yet none was observed. We hypothesized that this asymmetry reflected the change in the density of magnocellular cells across the visual field. We tested this by performing a final set of fMRI experiments in which the NBR was generated either by isoluminant red–green stimuli, which should generate very little activity in the magnocellular pathway, or by achromatic luminance stimuli, which should generate a lot. We found that these stimuli generated equally strong responses in the fovea but very different levels of NBR in the parafovea. Isoluminant red–green inducers generated relatively little NBR, suggesting that this phenomenon is driven primarily by the magnocellular pathway.
Finally, we conducted a series of psychophysical experiments to examine the relationship between the NBR and perception. Consistent with the fMRI data (and previous psychophysical studies), we found little evidence of perceptual suppression in the fovea but strong suppression in the parafovea.
Materials and Methods
fMRI methods
Subjects.
Nine subjects (six males) with ages between 23 and 68 participated in our fMRI experiments. All subjects had normal or corrected-to-normal acuity and normal color vision and were experienced psychophysical observers. Seven of the subjects were naive to the purpose of the experiment. Subjects were screened and consented in accordance with human subject protocols at both University of California, San Francisco (UCSF), and Smith–Kettlewell Eye Research Institute (SKERI).
Data collection and processing.
fMRI data were collected on a Siemens 3T Tim Trio system at the UCSF Neuroscience Imaging Center using a standard Siemens EPI Gradient Echo sequence and 30 functional imaging planes with resolution of 1.7 × 1.7 × 2 mm collected each repetition time (TR) (2 s). Each run contained 184 TRs and a session consisted of at least six functional runs. Additional “in-plane” anatomical scans (T1-weighted two-dimensional spoiled gradient-recalled acquisition in a steady state) were acquired with the same slice prescription as the T2* data to facilitate post hoc alignment to a high-resolution anatomical dataset collected on a separate occasion.
Anatomical segmentation.
High-resolution whole-head anatomical volumes were acquired on each subject to provide a canonical reference frame for subsequent functional datasets and to enable the restriction of functional data to the cortical sheet. Anatomical datasets were acquired using a T1-weighted magnetization-prepared rapid-acquisition gradient echo sequence at an initial resolution of 0.9 × 0.9 × 0.9 mm. After correcting the high-resolution T1 anatomical datasets for low-spatial-frequency intensity variations and downsampling to 1 × 1 × 1 mm, we used SPM5 (http://www.fil.ion.ucl.ac.uk/spm/) to align and average several complete three-dimensional volumes to improve the signal-to-noise ratio. Initial segmentation of the white and gray matter was performed using the Freesurfer 4 “autorecon” script (http://surfer.nmr.mgh.harvard.edu/), and the results were then passed to the Stanford “VISTA” toolbox (http://white.stanford.edu/software/) application “mrGray,” in which a human expert corrected small errors in the topology of the white matter to finalize both gray and white matter classifications. The resulting gray and white matter volumes were used to generate cortical surface meshes for data visualization (Teo et al., 1997).
Functional data preprocessing.
T2* data were postprocessed to remove intrarun and interrun motion artifacts using the rigid body alignment routine “spm_coreg” from SPM5. Reconstructed, motion-corrected time series were imported into the Stanford VISTA package and aligned to the high-resolution anatomy by registering the inplane anatomy scans with the high-resolution anatomy and applying the resulting affine transform to the motion-corrected functional datasets. Automated alignment estimates were checked visually by human experts. BOLD signal changes were computed as percentage variations around the mean. Functional data were convolved spatially with a 2 × 2 × 2 mm (full width at half-maximum) Gaussian filter and underwent a second-order polynomial detrending before the computation of the general linear model (GLM).
Stimulus presentation.
All visual stimuli were presented on a flat-panel liquid crystal display (LCD) screen (LTV32W1; Westinghouse Electric) contained within an electromagnetically shielded box and viewed at the rear of the scanner bore via a mirror mounted on the headcoil. The gamma lookup tables and spectra for each color channel were calibrated using a photoradiometer (USB2000; Ocean Optics) to ensure output linearity (Brainard, 1989). Stimuli were generated using an in-house stimulus display package (PowerDiva) running on a G4 Mac Powerbook (Apple). The Powerdiva package was originally designed for quantitative measurements of EEG response functions and provides millisecond-resolution control over stimulus timing.
The LCD screen subtended a visual angle of 7° of visual angle horizontally. In most experiments, subjects performed a free-running, rapid letter discrimination task in the central half degree of the visual field, responding via a magnet-safe button box connected to a fiber-optic response pad (FORP FIU-005; Current Designs) that converted button presses to signals on the Powerbook USB port. The letter discrimination task was based on one used by Schira et al. (2004) in an fMRI study of contour processing. Sequences of randomly rotated letters were presented in the order F,(L or T),F. The subject's task was to indicate as soon as possible whether the central portion of the sequence contained a “T” or not. The timing of the attentional control task was independent of the onsets and offsets of the stimulus gratings. Performance on the letter discrimination task was monitored by the display program, and the rate of letter presentation was adjusted continuously to maintain a discrimination accuracy of 75% for all subjects. Typical letter presentation times were ∼300 ms. To control for the effect of spatial attention location, three subjects also participated in experiments in which the annulus plus mask NBR stimuli were identical with those described below, but the free-running letter discrimination task was presented to the left and right of fixation within the annular surround. In this configuration, letters were presented in pairs and scaled to maintain the same discrimination accuracy measured for foveal presentations. Otherwise, the task was identical.
Stimulus configuration.
Initially, we measured the contrast dependency of the NBR using stimuli that contained only achromatic luminance contrast. The central inducer region measured 1.5° in diameter and was either set to zero contrast (uniform field of 35 cd/m2) or contained a 1 cpd contrast-reversing sine-wave grating with a Michelson contrast of 90% and a temporal frequency of 4 Hz. The surround region contained a contrast-reversing sine wave grating similar to that used in the central region except that its spatial phase was inverted and its Michelson contrast was set to one of four different levels: 0% (uniform mean field), 5, 20, or 45%. To eliminate border contrast effects and top–down influences attributable to segmentation state, a 0.25° annulus between the central inducer and the surrounding probe region was always set to a uniform mean gray (see Fig. 2a). The lowest nonzero probe contrast of 5% was above perceptual detection threshold when presented in isolation.
Figure 2.

Example of stimulus configuration and typical responses. a, Stimuli used in the fMRI scans, showing both the central inducer and the surround region with contrast-reversing sine-wave gratings. The central region could be set to either 90 or 0% contrast, and the surround region was set to Cs levels of either 0, 5, 20, or 45% contrast. “F” marks the location of the foveal letter discrimination task. b, Map showing typical response amplitudes to a high-resolution central region with 0% surround contrast rendered on a single inflated hemisphere. The location of area V1 is outlined in red. Positive responses are rendered in red and are found at the occipital pole. Some responses are not visible as they extend onto the lateral surface. A large swath of visual cortex also demonstrates a negative BOLD response (blue) extending well into the periphery. c, Response time courses measured from disks over peripheral (blue) and foveal (red) locations in b. Error bars are 1SEM.
In a second set of experiments examining the chromatic tuning of the NBR, we used an identical spatial stimulus configuration and event-related paradigm for the central mask region but altered its chromaticity. Specifically, we ran two stimulus conditions in addition to a blank in which the central contrast was defined by excursions along the (L+M+S) and (L−M)-cone directions in MacLeod–Boynton space (MacLeod and Boynton, 1979) at RMS cone contrasts of 45 and 6%, respectively. The first of these conditions was similar to the zero-surround-contrast condition in our first dataset. The second condition drove the central region with a grating that was highly salient but nominally isoluminant. No peripheral grating was present in these experiments. Cone isolating stimuli were computed using a “silent substitution” technique (Estévez and Spekreijse, 1982) based on the measured spectra of the display device and published measurements of the human cone photoreceptor absorption spectra in the central retina (Stockman et al., 1993).
Experimental design.
Stimuli were presented in a jittered event-related paradigm (Burock et al., 1998) with a 2 s stimulus duration, a 9 s mean interstimulus interval with a random jitter drawn from a uniform distribution spanning ±6 s. Each fMRI run lasted 368 s including a 6 s scanner “warm-up” period during which no stimulus was present and an additional 6 s lead period to avoid measuring the attentional correlates of the initial stimulus onset transients. Eight different stimulus conditions were presented within this period representing all the combinations of the four probe contrasts (0, 5, 20, and 45% contrast), and the two central inducer contrasts (0 and 90% contrast). Each condition appeared four times per run, and each subject completed a minimum of seven runs.
Localizer stimuli.
Before running the event-related experiments, we performed a series of block design experiments using high-contrast stimuli with a spatial structure identical with those in the event-related paradigm to identify the borders of the foveal and parafoveal regions. The regions of interest defined by these experiments [defined as regions that were significantly active at p < 0.0001 in a correlation analysis (Bandettini et al., 1993)] were automatically eroded by one voxel to avoid locations close to the borders where induced contrast effects may have been present (Cornelissen et al., 2006). In addition, on a third occasion, we ran standard retinotopic mapping experiments to identify the boundaries of early visual areas (Sereno et al., 1995; DeYoe et al., 1996). These localizer experiments were conducted at least 1 week before the event-related measurements. The data shown here are all from area V1 averaged across hemispheres in each subject.
Analysis methods.
Event-related analyses, including application of general linear models and hypothesis tests to generate contrast maps, were performed as described by Frackowiak et al. (2003) and Dale and Buckner (1997). These analysis routines are part of the VISTA package and provide essentially identical results to the equivalent routines in SPM5 (Sayres and Grill-Spector, 2006). Predictor time series estimates were generated by applying a canonical SPM5 “difference of gammas” hemodynamic response function to the stimulus onset times. No other regressors (for example, estimates of motion-induced noise) were incorporated in the analysis. In this study, we estimate the BOLD response amplitudes as being proportional to the fitted GLM β values. Other measures of BOLD amplitude (for example, mean peak height at some lag after stimulus onset) were found to yield similar but slightly less robust estimates of BOLD response. Curve fitting and statistical analysis of the population response amplitudes were performed in Matlab (The MathWorks) using the statistical analysis toolbox and optimization toolboxes. We used a version of the Matlab “fminsearch” unconstrained multidimensional minimization algorithm to find solutions to our parameter fits that were optimal in a weighted least-squares sense. Because this algorithm can find minima that are locally but not globally optimal, we repeated each search at least 100 times with different start values to find a stable solution.
Psychophysical methods
Subjects.
Five subjects (three males) with ages between 30 and 38 (mean, 35) participated in our psychophysical experiments. All subjects had normal or corrected-to-normal acuity and normal color vision and were experienced psychophysical observers. Three of the subjects were naive to the purpose of the experiment. Subjects were screened and consented in accordance with human subject protocols at both UCSF and SKERI. Three of the psychophysical subjects were also subjects in the fMRI experiments.
Stimulus presentation.
Stimuli were presented on a Sony Multiscan 200 cathode ray tube monitor (mean luminance, 34 cd/m2; 100 Hz refresh rate; 1024 × 768). Subjects viewed the stimuli binocularly at a distance of 70 cm in a darkened room and responded to the two-alternative forced-choice psychophysical tests by pressing one of two keys on the stimulus computer keyboard. The screen was calibrated and linearized with the same photoradiometer used in the fMRI experiments (USB2000; Ocean Optics).
Stimulus configuration.
The stimulus parameters were matched as closely as possible with those used in the fMRI experiments, and in particular the spatial configurations of the stimuli in the two experiments were identical: a central disk surrounded by an annulus with a mean-luminance gap between them. Subjects were instructed to perform two-temporal-interval, two-alternative forced-choice contrast modulation detection decisions in all experiments. In one-half of the experiments, the judgments were made on the contrast of the central disk. In the other one-half of the experiments, judgments were made on the contrast of the annulus. In both conditions, a staircase routine (Watson and Pelli, 1983) was used to determine the 78% contrast modulation detection threshold in the target location. By varying the pedestal contrast of both regions from session to session, we were able to collect threshold versus contrast (TVC) curves for each subject. In total, we collected four such TVC curves for each subject corresponding to each of the two target locations presented with, and without the other half of the stimulus (disk alone, disk plus high-contrast annulus, annulus alone, annulus plus high-contrast disk). Contrast detection thresholds can be related to neural responses by assuming that the responses they generate correspond to signal changes equal to either a constant, or Poisson neural noise level (Foley, 1994; Boynton et al., 1999; Itti et al., 2000; Dayan and Abbott, 2001). We were therefore able to compute the effects of central and parafoveal maskers on the neural activity underlying the contrast discrimination judgments.
Results
fMRI
Long-range neural suppression in the visual system is a well studied phenomenon and there are several candidate models of this process that have plausible physiological explanations. On first inspection, the NBR would appear to be related to a phenomenon known as “surround suppression.” Surround suppression refers to a cascade of normalization processes in the early visual system that cause neuronal firing rates and psychophysical detection and appearance measurements to be modulated by contrast presented outside the classical receptive field (Blakemore and Tobin, 1972; Allman et al., 1985; Cavanaugh et al., 2002a,b). The link between psychophysical surround suppression and electrophysiological measurements of extraclassical receptive field modulation is still a subject of investigation. However, there is convergent evidence from several studies indicating that surround suppression consists of at least two components: an early, broadly tuned suppressive mechanism acting at or before the input layer of V1, and a later, more tightly tuned cortical mechanism that may involve feedback from extrastriate visual areas (Webb et al., 2005; Angelucci and Bressloff, 2006; Petrov and McKee, 2009).
Recent multimodal experiments in primary somatosensory cortex have made the link between neural suppression and the NBR more concrete. In particular, in an elegant series of studies, Devor et al. (2007) showed that the NBR around a stimulated location is associated with arteriovascular constriction and a decrease in membrane potential (a hyperpolarization) in the surround (Derdikman et al., 2003; Devor et al., 2005). Interestingly, this hyperpolarization did not appear to be associated with a significant reduction in multiunit spike activity in the same location, nor was it associated with a change in local glucose uptake, which reflects the local metabolic rate (Devor et al., 2008).
The mean membrane hyperpolarization measured by Devor et al. using voltage-sensitive dye is relatively small (∼0.1% of the mean), but modulations of this magnitude have been reported in correlated cell populations in which the individual units demonstrate hyperpolarization effects of 10% or more (Grinvald et al., 2001). The effects seen by Devor et al. could therefore be comparable, at a single-unit level, to other well known suppressive mechanisms associated with membrane hyperpolarization—contrast adaptation being the most obvious example (Carandini and Ferster, 1997).
How does the nature of the suppression induced by the high-contrast center vary as a function of baseline activity? This question is the key to understanding the link between neural suppression, the NBR, and perception. We examined this relationship by manipulating the ongoing activity in a probe region, and then modulating the BOLD response generated in that location by presenting a high-contrast central masker. The change in the parafoveal BOLD response reflects the amount of neural modulation generated by the masker at each contrast level Cs presented to the probe region. By comparing the “response versus contrast” (RVC) functions in the suppressed and unsuppressed conditions, we were able to determine how suppression depends on ongoing activity at a population level. We tested three common models of neuronal gain control. Following convention, we term these “subtractive,” “contrast gain,” and “response gain” mechanisms (Fig. 1).
Figure 1.

Candidate models of NBR-related neural suppression. The black curves represent neural responses without suppression, and the light gray curves represent neural responses after suppression under the assumptions of each model. The differences (Δ) between the suppressed and unsuppressed curves are shown in the small plots above each model. a, The subtractive mechanism model predicts that the difference is independent of contrast. b, The response gain model predicts that the difference grows with increasing contrast. c, The contrast gain model predicts that the difference is non-monotonic, depending on the form of the contrast response function and approaching zero at high contrast. Contrast scale is 0–1, and responses are in arbitrary units.
In a subtractive or “baseline shift” model (Fig. 1a), the response of the suppressed region is changed by a constant amount. Subtractive mechanisms are a fundamental part of early visual system contrast processing (Movshon et al., 1978; Palmer and Davis, 1981; Ferster, 1988) and this type of response modulation has also been shown to be a good (Buracas and Boynton, 2007) or partial (Li et al., 2008) fit for BOLD modulation attributable to spatial attention in primary visual cortex.
The response gain model (Fig. 1b) predicts that suppression scales with ongoing probe activity—causing monotonically increasing absolute levels of suppression with increasing Cs. Response gain models have been used to explain response changes measured in single units in response to contrast or size changes (Solomon et al., 2002), shifts in spatial attention (Williford and Maunsell, 2006), or adaptation (Ling et al., 2009).
The third candidate model, the contrast gain model (Fig. 1c), predicts that the inducer scales the effective input contrast in the probe region. In this case, we find a suppression function that can be non-monotonic and depends on the precise form of the underlying contrast response function. This type of gain control is ubiquitous in the visual system (Heeger, 1992) and is frequently proposed as a candidate for long-range suppressive interactions (Cavanaugh et al., 2002a,b) as well as other, higher-level effect such as attentional modulation (Treue and Martínez Trujillo, 1999; Boynton, 2009; Reynolds and Heeger, 2009).
To study the computational nature of the NBR in primary visual cortex, we used fMRI to measure contrast versus response functions (CRFs) in an annulus surrounding the fovea. These CRFs were measured both with and without a central, circular, high-contrast inducer. The regions of interest (ROIs) used to extract signals from visual cortex were defined using independent localizer scans and restricted to retinotopically defined striate cortex (see Materials and Methods).
Our event-related design measured the effect of the NBR at four different levels of contrast (Cs) in the annular probe region (0, 5, 20, 45%) and two levels of foveal inducer contrast (0 and 90%). Therefore, we measured a total of eight conditions allowing us to fit CRFs in the probe region with and without the high-contrast suppressor. The spatial stimulus configuration used in all experiments was similar to that shown in Figure 2.
Figure 3 shows the mean BOLD response amplitudes in the inducer (Fig. 3a,c) and probe regions (Fig. 3b,d) computed from a general linear model fit of the fMRI time series data in each ROI at all combinations of inducer and probe contrast levels. Results from all subjects are shown in Figure 3, a and b, average results with cross-subject SEMs are shown in Figure 3, c and d. The patterns of individual results were similar in all subjects, as reflected by the SEM error bars for the group average BOLD amplitudes.
Figure 3.

Raw BOLD responses in the fovea (a) and surround (b). The response amplitudes for each level of surround contrast are plotted for both conditions with and without the presence of the central high-contrast inducer. The different colored bars represent BOLD amplitudes for each individual subject. Error bars are between-trial SEMs. Average data for the foveal and parafoveal ROIs are shown in c and d, respectively. The blue data points represent conditions without the inducer (0% center contrast), and the red data points represent conditions with the inducer (90% center contrast). The data points in e represent the difference in surround BOLD response between identical surround contrast conditions with and without the presence of the inducer. Error bars are 1SEM computed across subjects.
We defined the NBR to be the change in BOLD signal attributable to the presence of the high-contrast central region. This value was calculated as the difference of BOLD response amplitudes in the probe ROI between corresponding conditions with and without the inducer. The NBR associated with each background contrast is shown in Figure 3e.
The most striking aspect of the data shown in Figure 3 is that the amplitude of the NBR falls rapidly with increasing probe contrast and is maximal at 0% probe contrast (corresponding to a uniform mean field in the parafovea). Clearly, the NBR is not independent of the probe contrast level. This finding strongly rules against the subtractive response model because this predicts approximate independence between the NBR and Cs. Fitting a pure subtractive model yields an R2 (percentage of variance explained, computed as 1 − [var(residuals)/var(data)]) of zero. The response gain model can be rejected even more conclusively since it predicts that the NBR should increase monotonically with probe contrast. Again, the best fit of this model has a zero R2, meaning that it explains no significant amount of the variance. Intuitively, neither the subtractive model nor the response gain model can fit the data better than a flat line.
A contrast gain model, however, fits the data well. Specifically, we fit a hyperbolic ratio of the form
 |
to the data (Albrecht and Hamilton, 1982). This type of saturating nonlinearity has often been used to fit both neural (Albrecht and Hamilton, 1982; DeAngelis et al., 1994; Cavanaugh et al., 2002a; Durand et al., 2007) and fMRI (Boynton et al., 1999; Wade and Wandell, 2002) response data. We fit all eight data points simultaneously by minimizing a single function that computed the suppressed and unsuppressed responses at each contrast level. We fixed two parameters (the exponent m and a multiplicative contrast gain control scalar s, set to 1 for the unsuppressed condition and 0.62 in the suppressed condition, that alters the effective input contrast). We allowed four parameters to vary: k (response gain), σ (semisaturation constant), A (an offset at zero contrast), and C0 (an estimate of baseline neural input). The exponent m was fixed at the value of 2 commonly used in the literature to model population responses (Boynton et al., 1999; Chirimuuta and Tolhurst, 2005) and the multiplicative suppression factor s of 0.62 was based on population data from Cavanaugh et al. (2002a) and equivalent to their mean measured suppression index (Rmax − Rmin)/Rmax of 0.38. Our results do not depend critically on these values. For example, changing the exponent to the value of 1.8 derived from experimental data by Boynton et al. (1999) had little qualitative effect on our results. All eight data points contributed to the fit. For the additive and response gain models, we did not have existing population estimates of neural suppression and so we allowed this value to vary as an additional parameter, adjusting our χ2 estimates later to account for the additional degree of freedom.
The fitted parameters and the associated curve fits are shown in Figure 4. Although the fit slightly underestimates the NBR at low probe contrast and may overestimate it at high contrast, they explain a significant amount of the variance in our data (R2 = 0.87) and the parameters are physiologically plausible and lie well within their maximum and minimum bounds.
Figure 4.

a, b, Fits of a hyperbolic ratio function to contrast responses measured in the probe region. Unsuppressed data are shown in black, and suppressed data are shown in gray. The same function is used to fit both curves—the only difference being a multiplicative (×0.62) scaling on the input contrast in the presence of a central inducer. c, Negative BOLD amplitudes in the probe region with modeled NBR curve overlaid. The model captures both qualitative and quantitative features of the data. The fitted parameters are as follows: k = 1.71, σ = 6.8%, C0 = 9.36%, A = −1.14. Error bars are 1SEM.
To compare the three models in a more quantitative manner, we computed F statistics on the reduced χ2 values for each fit type, taking into account the number of degrees of freedom in each model. The contrast gain model provided the best fit of the three model types and was superior to the response gain model (p > 0.98). The comparison between the contrast gain model and the subtractive (constant difference) model also achieved statistical significance (p > 0.95) in this relatively rigorous test. The failure of the subtractive model to explain any fraction of the variance (R2 = 0) leads us to reject it even more conclusively as a possible mechanism.
Although the suppressive response can, in principle, be attributable to a combination of several mechanisms [for a thorough treatment of this type of mixed model, see Li et al. (2008)], the very low magnitude of the NBR at moderately high Cs, and the lack of any NBR at near-saturating 45% contrast, argues strongly against either a subtractive or a response gain component and we did not consider these potential mechanisms further.
In addition to making clear distinctions between the three potential suppressive mechanisms, these results also have two other important features.
First, we discovered that the negative BOLD response may be as large in magnitude as a strongly elicited positive BOLD response. For example, the maximum NBR in the probe (Fig. 3c, first data point) is comparable in absolute magnitude to the PBR in the same location elicited by a near saturating 45% contrast grating (Fig. 3d, Cs = 45%). This suggests that the resting-state BOLD signal in the presence of a completely blank mean-gray screen in parafoveal V1, is at least one-half of the maximum possible response in that region. In other words, although it is normally considered to be a baseline signal, the BOLD level associated with blank screen of constant luminance is well above absolute zero in peripheral striate cortex.
Second, although a strong NBR is elicited by the foveal inducer in the surround (Fig. 3d), there is no detectable NBR in the foveal region in response to a high-contrast parafoveal stimulus. Figure 3c shows the response in the inducer region as a function of surround contrast. The bottom row of data points are measures of BOLD amplitude at 0% inducer contrast and the right-most point in this series indicates the BOLD amplitude in the presence of a high-contrast (45%) surround. The amplitude for this condition is not statistically different from zero, or from the amplitudes at other surround contrasts. In other words, the contrast gain control mechanism responsible for the parafoveal NBR appears to be much weaker in the fovea.
As noted above, the NBR appears to reflect the average degree of membrane hyperpolarization in the surround rather than the direct neural spike rate (Devor et al., 2007) or energy consumption (Devor et al., 2008). Although neuronal spiking clearly depends on membrane potential in any particular neuron, the relationship may be obscured by threshold effects (Priebe et al., 2004; Priebe and Ferster, 2008) and the fact that only some of the neurons in the probe actually experience suppression (Solomon et al., 2002). Equation 1 may therefore predict qualitative changes in the membrane polarization and the spike rate of a small subpopulation of cortical neurons in the suppressed region.
Because all the experiments described above used an attentional control task presented in the fovea, we were concerned that the lack of NBR in the fovea might simply be attributable to a high baseline activation level in this location (Heinemann et al., 2009). To control for this, we ran additional control experiments on a subset of our subjects. First, we ran a version of the experiment that was identical with that described above except that the attentional control task was presented in the annular probe. The results of this experiment are shown in Figure 5. As before, we measured a strong NBR in the parafovea and no NBR in the fovea for any condition. As a second control, we ran a block design version of the experiment with no attentional control at all. Results from this experiment likewise showed a parafoveal NBR but no foveal NBR (see supplemental Fig. S1, available at www.jneurosci.org as supplemental material). Based on the results from these attentional controls, we believe that the relative weakness of the foveal NBR is a fundamental property of the human visual system.
Figure 5.

Center ROI response amplitudes, averaged for three subjects, with both no contrast and with 90% high contrast center. All measurements were taken while subjects performed a demanding parafoveal attention task. For both levels of central contrast, the addition of a 45% contrast surround (dark bars) produces no effect of suppression, consistent with results from the same experiment with a foveal attention task. This suggests that attentional demands do not drive the results we see for the central region. Error bars are 1SEM.
The weakness of the NBR in the fovea led us to hypothesize that it may be generated in only a subset of cortical or subcortical neurons—a subset that may be relatively sparse in the fovea. A natural candidate was the magnocellular pathway. Single-unit studies have demonstrated that extraclassical, suppressive receptive fields are far stronger in the magnocellular pathway than in the parvocellular pathway (Barlow et al., 1977; Solomon et al., 2004, 2006). Although the fovea is dominated by parvocellular input, the ratio of parvocellular to magnocellular cells falls rapidly with increasing eccentricity (Connolly and Van Essen, 1984; Azzopardi et al., 1999). We propose that it is this ratio (rather than the absolute number of foveal magnocellular neurons) that is critical to the amplitude of the NBR. Devor and colleagues model the NBR as the result of a linear combination of a positive response and a negative response. It is clear from many fMRI studies of chromatic responses in V1, including one shown later in this paper, that both the parvocellular and magnocellular pathways are capable of generating a positive BOLD response, but it is possible that the negative response, at least in this stimulus configuration, is generated only by the magnocellular cells.
If the NBR was predominantly associated with magnocellular neurons in the early visual pathways, we would expect to find little or no NBR generated by isoluminant stimuli since there is relatively little isoluminant input to the magnocellular pathway (Lee and Sun, 2009). To test this hypothesis, we conducted a set of experiments in which we compared the amount of NBR generated in the parafovea by (1) achromatic luminance and (2) isoluminant red–green gratings in the fovea. We analyzed these data using the same data-processing pipeline that we used for the event-related luminance contrast datasets in Figures 3 and 4. We then compared the levels of positive and negative BOLD signals in the foveal, stimulated regions and the parafoveal, unstimulated regions. The results are shown in Figure 6.
Figure 6.

Isoluminant stimuli generate a weaker NBR. Renderings of BOLD response amplitudes from a single subject's right hemisphere showing responses to high-contrast, foveal luminance (a) and opponent (L−M)-cone stimuli (b). Both stimulus types generate a strong positive response in the foveal region of area V1 (outlined in red). Only the luminance contrast also generates a strong NBR (coded as blue). c, Average amplitudes of positive and negative BOLD response averaged across four subjects. Mean cone contrasts were chosen to generate approximately equal responses in the directly stimulated locations. Error bars are 1SEM. See also supplemental Figure S2 (available at www.jneurosci.org as supplemental material).
In all subjects, both the luminance contrast and isoluminant stimuli generated strong, positive, central responses. The responses attributable to the achromatic (45%) and isoluminant (6%) gratings were approximately equal, meaning that the isoluminant cone stimuli were slightly less than eight times more effective per unit cone contrast at driving BOLD signals in V1—a result that is consistent with many other fMRI studies of chromatic responsivity (Kleinschmidt et al., 1996; Engel et al., 1997a; Wandell et al., 1999; Liu and Wandell, 2005). The contrasts for the (L+M+S)-cone and (L−M)-cone stimuli were selected to equalize the resulting BOLD responses, but this compensation was not perfect and our foveal (L−M)-cone driven responses were, on average, slightly larger than the (L+M+S)-cone signals. Since the magnitude of the NBR is proportional to the contrast of the inducer (Shmuel et al., 2006), we might expect these isoluminant stimuli to generate an equally robust NBR. Strikingly, however, we found that whereas the foveal luminance stimuli generated a powerful NBR in the parafovea, the isoluminant (L−M)-cone stimuli generated a far-weaker suppressive effect. This statistically significant (p < 0.01, one-sided t test) reduction in the amplitude of the NBR for the parvocellular pathway was particularly striking when the NBR was expressed as a fraction of the positive response (PBR) elicited by these stimuli in the fovea. On average, the ratio of positive to negative responses for the luminance contrast stimuli was 0.61. For the isoluminant stimuli, it was 0.37. We note that the contrast levels used for this stimulus were potentially high enough to cause saturation of both the luminance- and isoluminant contrast-driven responses that would, in turn, diminish the strength of the effect we measured. In addition, our chromatic stimuli were generated based solely on computed cone absorption values rather than individually set isoluminant points and were presented on an eight-bit display device. Consequently, there may have been some luminance artifact in our nominally (L−M)-cone isolating gratings, although this artifact must have been relatively small given the low absolute cone contrasts in this condition. In supplemental Figure S2 (available at www.jneurosci.org as supplemental material), we show additional data that we derived from a reanalysis of the dataset of Liu and Wandell (2005), which measured responses to attentionally controlled chromatic stimuli very similar to our own in which spatial dithering was used to improve the apparent color bit depth. The analysis procedures were identical with those described above, and the average contrast of the stimuli was approximately one-half that of those shown in Figure 6. The reduction in the relative amplitude of the isoluminant (L−M)-cone-driven NBR is even more prominent in these data.
Psychophysics
The fMRI results above indicate a clear pattern of BOLD signal suppression in the parafovea attributable to a central, high-contrast target, whereas high-contrast parafoveal targets do not appear to generate significant suppression in the fovea. If these suppressive effects have a neural origin, they might have perceptual correlates that could be detected using behavioral psychophysics.
To examine this, we ran a series of psychophysical experiments to measure the neural response functions underlying contrast detection and discrimination in the fovea and parafovea with and without high-contrast, spatially remote mask regions. The stimuli were chosen to match those used in the fMRI experiments. We used a two-interval, two-alternative forced-choice paradigm to measure contrast discrimination threshold versus pedestal contrast (TVC) functions in both foveal and parafoveal locations. We then computed RVC functions by assuming that discrimination thresholds corresponded to neural response differences that were larger than some criterion noise level (Foley, 1994; Dayan and Abbott, 2001). The data in Figure 7 were computed by assuming a Poisson-distributed noise model (Itti et al., 2000; Dayan and Abbott, 2001) plus a small baseline component at zero contrast. In a separate analysis, we also computed RVC curves using an alternative detection algorithm with a constant noise level, corresponding to a limit at some more central decision stage (Shadlen et al., 1996) and the results were qualitatively similar. Figure 7 shows the raw TVC curves obtained in the fovea (a) and parafovea (b). Data points measured using isolated, unmasked probes are shown in black; data points measured in the presence of a high-contrast, spatially remote suppressive field are shown in gray. Three aspects of the data are worth noting. First, there is little or no effect on foveal contrast discrimination thresholds of adding a high-contrast annular surround. This result extends a finding by Petrov et al. (2005), which found no evidence for surround suppression in a foveal target using a contrast detection paradigm. In their study, Petrov et al. measured suppression using contrast detection thresholds at zero pedestal contrast. We confirm this original result using very similar stimuli and show that it extends across a wide range of pedestal contrasts. Similar, although less pronounced peripheral bias effects have also been noted in contrast appearance measurements (Xing and Heeger, 2000, 2001).
Figure 7.
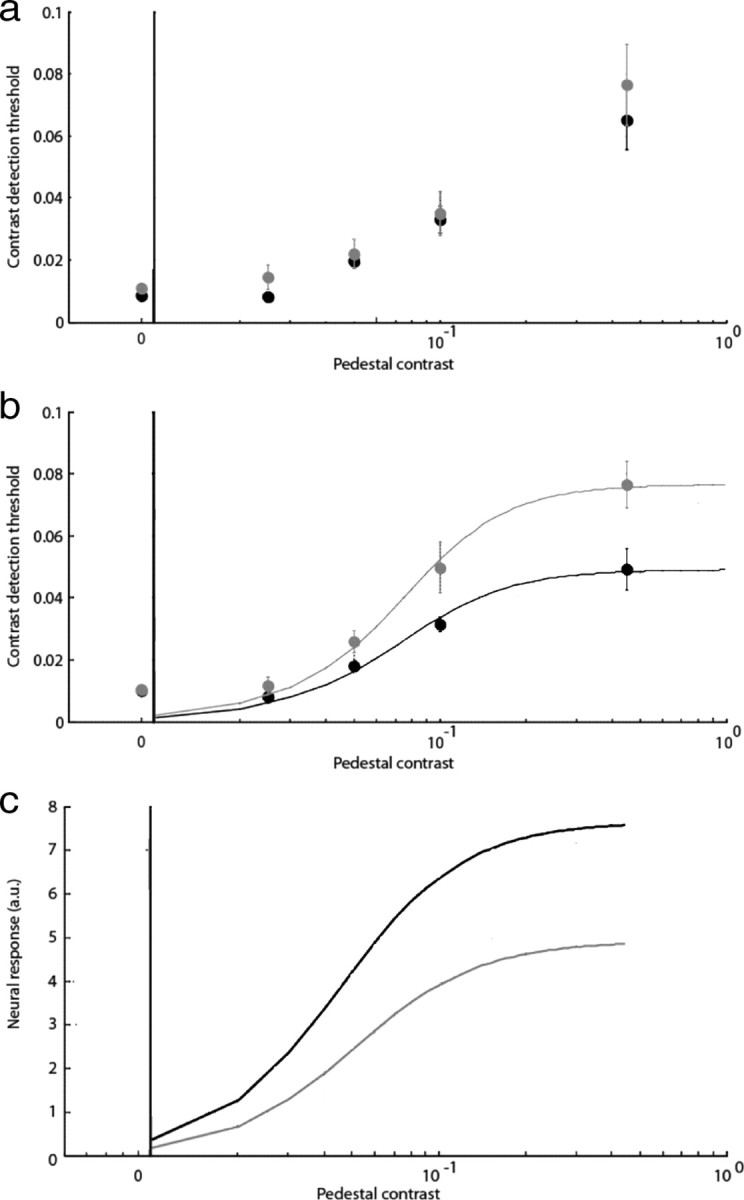
a, b, Average threshold-versus-contrast data for five subjects. Thresholds measured in the presence of a mask are shown in gray, and thresholds measured in isolation are shown in black. Contrast scale is 0–1. a, Foveal target. b, Parafoveal target. The foveal target shows no statistically significant evidence of suppression attributable to the remote, high-contrast annulus. In comparison, thresholds in the parafoveal, annular target are elevated significantly by the high-contrast foveal disk. The fits in b were made by assuming that thresholds are determined by the Fischer information of the neural responses at each contrast level with the underlying neural response function being given by a hyperbolic ratio function of the form shown in Equation 1. Error bars are 1SEM. c, Estimated neural contrast response functions for unsuppressed (black) and suppressed (gray) parafoveal target conditions based on psychophysical contrast discrimination thresholds. The fitted parameters in both b and c are the same: k (response gain) and σ (semisaturation constant). Suppressed: k = 8, σ = 0.05; unsuppressed: k = 5, σ = 0.05. The primary effect of suppression is to change the parameter k, consistent with a response gain mechanism.
Second, we do find evidence of threshold changes in the parafoveal annulus in response to the presence of high-contrast foveal mask. Since this configuration essentially replicates the conditions used in our fMRI experiment, the psychophysical data parallel the fovea/parafovea bias that we observe in the NBR.
Finally, the computational nature of the suppression that gives rise to the increase in psychophysical detection thresholds is different than that seen in the NBR data. Specifically, the increase in contrast discrimination thresholds at high pedestal levels indicates the presence of a response gain rather than a contrast gain control mechanism. This is illustrated in Figure 7c in which the underlying neural contrast response functions for the suppressed and unsuppressed parafoveal probes are computed. The fitted curves are hyperbolic ratio functions with two free parameters: k and σ. The same parameters were used to generate the fits in Figure 7b.
How can the response gain that we observe psychophysically be reconciled with the contrast gain control that we observe in the fMRI BOLD signal?
We believe that there are at least three possible explanations.
First, this may be an early effect limited to a relatively small population of magnocellular neurons that saturate at low contrast. At higher contrasts, response gain may occur in a different set of neurons, possibly a parvocellular-dominated population.
Second, the type of modulation may depend on the amount of tuning present in the suppressive mechanism. It is becoming clear that psychophysical surround suppression is an umbrella term describing the cumulative result of at least two physiological processes. Long-range suppressive effects are found in the lateral geniculate nucleus (Bonin et al., 2005) and even in the retina (Solomon et al., 2006), but these mechanisms are relatively untuned for spatial features such as frequency and orientation. Additional suppressive and occasional facilitatory interactions are found in cortex and most likely result from a combination of untuned suppression at the input layers and rapid, highly tuned feedback interactions from extrastriate cortex (Webb et al., 2005; Smith et al., 2006; Ichida et al., 2007). Surround suppression as it is usually measured psychophysically has a significant tuned component indicating a strong contribution from cortical neurons (Petrov et al., 2005), although the early and late mechanisms can be dissociated to some degree by manipulating stimulus timing (Petrov and McKee, 2009).
Electrophysiological studies of surround suppression indicate that it is implemented as a multiplicative contrast gain control change at the level of individual neurons (Webb et al., 2005). However, its ultimate effect on perception depends on the way in which signals in individual neurons are combined and normalized before the decision stage. Visual signals are subject to a cascade of contrast normalization processes that act to adapt neuronal responses to the mean local contrast level (Heeger, 1992; Carandini et al., 2005; Petrov et al., 2005). These normalization stages are often described by a divisive computation similar to that shown in Equation 1 in which the output from each neuron is divided by the pooled response from its neighbors (Heeger, 1992; Carandini et al., 1997). When suppression is spatially untuned, the contrast in both the numerator and the divisor are reduced and the overall result can be described by a change in the semisaturation constant or, equivalently, a multiplicative change in input contrast. By comparison, if the suppression is highly tuned so that it affects only the numerator, the result can be modeled as a multiplicative change in output, or a “response-type” gain change. This observation has been proposed recently to explain the wide variation in gain mechanisms observed in experiments studying attentional modulation (Reynolds and Heeger, 2009). However, its general logic applies to any modulatory neural mechanism: suppression that is highly tuned, either for features or spatial location, will manifest as response gain after a divisive normalization stage, whereas broadly tuned suppression resembles a contrast gain mechanisms. The response-type gain in our behavioral measurements may reflect the presence of a highly tuned cortical feedback mechanism operating after the neural generator of the NBR. Consistent with this hypothesis, we found that psychophysical suppression of a high-contrast parafoveal probe attributable to a foveal mask was abolished if the orientation of the gratings in the mask and the probe were orthogonal. It is also worth noting that similar experiments using slightly different stimulus configurations report a suppressive modulation more consistent with a contrast gain control mechanism (Xing and Heeger, 2001). It is possible that these differences reflect subtle differences in spatial features, such as size and frequency, of individual stimulus components as well as the psychophysical task.
Third, it may be that the NBR simply does not have a straightforward relationship to perception. Spikes are the only way to propagate information about the magnitude of visual attributes. A phenomenon that does not have a direct effect on spiking rate (Devor et al., 2007) may, therefore, perform some role that is not easily detected in our psychophysical measures of contrast versus neural response. One candidate may be a relatively automatic deallocation of hemodynamic resources in the parafovea in anticipation of a long-term reduction in activity there (Sirotin and Das, 2009).
Discussion
We have shown that the NBR in a region of primary visual cortex representing the parafovea (1.5–3°) can be modeled as a multiplicative gain control mechanism with a large zero-contrast response offset. The NBR in the parafoveal region is greatest at zero probe contrast (in which the modeled contrast response function is steep) and reduced at higher probe contrast because of a combination of response saturation and, possibly, the increased contribution of a population of neurons that have more linear response functions and that do not undergo long-range suppression to the same degree. Intriguingly, we found little evidence of a similar type of NBR in the fovea and we also found that isoluminant chromatic contrast generates relatively little NBR.
We found that the NBR is induced at parafoveal cortical locations during foveal stimulation but that, at the resolution of our measurement and under conditions of zero foveal contrast, more peripheral stimulation generates little or no NBR in the foveal representation of V1. In other words, the neural suppression has a well defined spatial direction on cortex. This asymmetry is evident in our own raw amplitude response maps of primary visual cortex and in other published studies. A striking example can be seen in the study by Duncan and Boynton (2003), their Figure 2 (see also supplemental material Fig. S3, available at www.jneurosci.org as supplemental material), in which the negative BOLD response to various high-contrast ring stimuli is always on the side farthest from the fovea.
Why do we not measure an NBR in the fovea similar to the one found in the parafovea? One reason might be the differential sensitivity of parvocellular and magnocellular cells to suppression from outside their classical receptive fields. It has been shown that parvocellular cells (which dominate the fovea) (Azzopardi et al., 1999) exhibit far less extraclassical inhibition than magnocellular cells (Krüger, 1977; Solomon et al., 2002). The amplitude of the NBR in any location must depend on the ratio of suppressed to unsuppressed neurons, and this, coupled with the steeply varying ratio of parvocellular to magnocellular cells across the visual field, would predict its relative reduction in the fovea. Intriguingly, human behavioral studies (including our own) have shown that surround suppression is either reduced (Xing and Heeger, 2000) or absent (Petrov et al., 2005) when the probe region is presented in the fovea.
Recent work suggests that at least two mechanisms are involved in this surround suppression: an “early” mechanism that is relatively untuned for spatial frequency and that may act at the first synapse of V1 and a later mechanism that has sharper spatial frequency tuning and that may involve an extrastriate feedback loop (Angelucci et al., 2002; Bair et al., 2003; Webb et al., 2005). We believe that the NBR is most likely to reflect the action of the early suppressive mechanism, which may also drive the type of long-range, perceptual suppression measured using short-duration, low-contrast probes in the periphery (Petrov et al., 2005).
The spatial bias is also intriguing for another reason. One high-level manifestation of long-range spatial interactions is the phenomenon of “crowding”: a decrement in letter or orientation discrimination in the presence of adjacent contrast that may be related to surround suppression, although perhaps not identical with it (Petrov et al., 2007). Crowding, like the NBR and surround suppression, is present in the periphery but not the fovea of normal observers. When measured in the periphery, it has an inward bias (Petrov et al., 2007) meaning suppression from more eccentric masks tend to be more effective. The direction of this local bias appears to be the opposite of that seen in the NBR, but the situation may be complicated by computational considerations relating to the effect of contrast gain control on different tasks.
The BOLD contrast response function in the parafovea has a large offset at zero contrast. The magnitude of the NBR measured to date in other studies confirms this high “resting-state” BOLD level since all these studies measure a robust NBR on a blank mean field (Shmuel et al., 2002, 2006; Smith et al., 2004). In our experiments, it is especially striking that, when an NBR is induced in a zero-contrast parafoveal location, the magnitude of the BOLD response decrease is comparable with that of the positive response elicited by a near-saturating 45% contrast grating. It is important to note that this high baseline BOLD offset is not an artifact of any of our models or fitting procedures. It is required by the observation that the magnitude of the NBR on a blank background is relatively large. This large underlying baseline signal cannot be explained by a linear relationship with neural spiking activity since spontaneous spike rates in V1 neurons are typically no more than 10% of the maximum (Albrecht and Hamilton, 1982).
If, as has been suggested, the BOLD activity reflected presynaptic mechanisms such as DC offsets in membrane potential (Logothetis and Wandell, 2004; Devor et al., 2007), the range of variation could be much greater. Moreover, the large NBR that is measured at zero contrast does not imply an equally large change in local energy consumption. Devor et al. (2008) have shown that in rat somatosensory cortex, arteriovascular constriction associated with decreases in membrane potential are not associated with a reduction in glucose uptake. Although the relationship between energy use and membrane potential may be stronger in regions with higher baseline firing rates (for example, primate V1), this result suggests that changes in the local, mean membrane potential may alter blood flow and oxygenation without significantly affecting population firing rates. This observation in itself hints that the NBR may not be directly related to perception and similar effects may underlie recent reports of hemodynamic changes in the absence of a visual stimulus (Sirotin and Das, 2009).
One alternative hypothesis is that the baseline BOLD response in the parafovea may be driven by the constant mean-gray background. It is possible, for example, that responses are driven by the “luxotonic” class of cells reported by Kayama et al. (1979), although these cells appear to be relatively rare and there is no evidence that they are restricted to a particular eccentricity. Another explanation is that the parafovea may be more sensitive to the rapid flicker of our fluorescent monitor backlight. Although some cells in macaque visual cortex can follow flicker up to a frequency of 100 Hz (Williams et al., 2004; Logothetis et al., 2009) and the periphery is certainly more sensitive to high-frequency flicker than the fovea (McKee and Taylor, 1984; Tyler and Hamer, 1990, 1993; Horiguchi et al., 2009), the degree of entrainment is far higher when spatial contrast is present. Using a photocell and oscilloscope, we measured almost zero flicker in our LCD display below 100 Hz during a mean field and we believe that it is unlikely that the small neural population that may be entrained (although not necessarily driven to spike more) above this frequency could drive the large offsets in BOLD signal that we observe.
The effect we measure is not attributable to an attentional mechanism. It is known that attention can modulate the BOLD signal in visual cortex by a significant amount (Tootell et al., 1998b; Kastner et al., 1999; Ress et al., 2000; Buracas and Boynton, 2007; Sirotin and Das, 2009), and it is conceivable that the NBR also reflects allocation of attentional resources (Heinemann et al., 2009). However, we controlled for the effect of attention in these experiments by forcing the subjects to perform a demanding letter discrimination task that was adjusted throughout the experimental session to maintain a 75% detection rate. Our result did not depend on the location of the attentional task. When we compared the effect of using foveal versus parafoveal attentional controls, we found no difference between the two conditions. Finally, our data are qualitatively similar to those obtained by other researchers (Shmuel et al., 2002, 2006; Devor et al., 2007) in anesthetized animals in which the effects of attention are absent.
These previously unreported features of the NBR may have important consequences for the way we interpret fMRI data in early visual cortex. For example, the spatial asymmetry in the NBR may have important consequences for experiments that aim to relate the positions of stimuli presented in visual space to the locations of the corresponding BOLD responses in cortex. Such measurements often attempt to fit a symmetric Gaussian function to the instantaneous BOLD response, or fit a cosine function to the BOLD response time course generated by a “traveling wave” of activity passing across cortex (Sereno et al., 1995; Engel et al., 1997b). Because the signals near the fovea are combinations of spatially symmetric positive activations and spatially asymmetric negative responses, these fitting procedures will slightly, but systematically underestimate the eccentricity of peripheral stimuli in cortical space. These effects will be particularly important when generating and comparing models of cortical magnification functions derived from fMRI (Baseler et al., 2002; Duncan and Boynton, 2003; Schira et al., 2007).
Footnotes
This work was supported by National Institutes of Health Grants R01 EY013157 and R01 EY017071 and National Science Foundation Grant BCS0719973. We thank Matteo Carandini, Suzanne McKee, Anthony Norcia, Yury Petrov, and Justin Ales for helpful discussions in the writing of this paper. Junjie Liu and Brian Wandell contributed the datasets for supplemental Figure S2 (available at www.jneurosci.org as supplemental material). Supplemental Figure S3 (available at www.jneurosci.org as supplemental material) was reproduced with permission from the authors.
References
- Albrecht DG, Hamilton DB. Striate cortex of monkey and cat: contrast response function. J Neurophysiol. 1982;48:217–237. doi: 10.1152/jn.1982.48.1.217. [DOI] [PubMed] [Google Scholar]
- Allman J, Miezin F, McGuinness E. Stimulus specific responses from beyond the classical receptive field: neurophysiological mechanisms for local-global comparisons in visual neurons. Annu Rev Neurosci. 1985;8:407–430. doi: 10.1146/annurev.ne.08.030185.002203. [DOI] [PubMed] [Google Scholar]
- Angelucci A, Bressloff PC. Contribution of feedforward, lateral and feedback connections to the classical receptive field center and extra-classical receptive field surround of primate V1 neurons. Prog Brain Res. 2006;154:93–120. doi: 10.1016/S0079-6123(06)54005-1. [DOI] [PubMed] [Google Scholar]
- Angelucci A, Levitt JB, Lund JS. Anatomical origins of the classical receptive field and modulatory surround field of single neurons in macaque visual cortical area V1. Prog Brain Res. 2002;136:373–388. doi: 10.1016/s0079-6123(02)36031-x. [DOI] [PubMed] [Google Scholar]
- Azzopardi P, Jones KE, Cowey A. Uneven mapping of magnocellular and parvocellular projections from the lateral geniculate nucleus to the striate cortex in the macaque monkey. Vision Res. 1999;39:2179–2189. doi: 10.1016/s0042-6989(98)00319-8. [DOI] [PubMed] [Google Scholar]
- Bair W, Cavanaugh JR, Movshon JA. Time course and time-distance relationships for surround suppression in macaque V1 neurons. J Neurosci. 2003;23:7690–7701. doi: 10.1523/JNEUROSCI.23-20-07690.2003. [DOI] [PMC free article] [PubMed] [Google Scholar]
- Bandettini PA, Jesmanowicz A, Wong EC, Hyde JS. Processing strategies for time-course data sets in functional MRI of the human brain. Magn Reson Med. 1993;30:161–173. doi: 10.1002/mrm.1910300204. [DOI] [PubMed] [Google Scholar]
- Barlow HB, Derrington AM, Harris LR, Lennie P. The effects of remote retinal stimulation on the responses of cat retinal ganglion cells. J Physiol. 1977;269:177–194. doi: 10.1113/jphysiol.1977.sp011898. [DOI] [PMC free article] [PubMed] [Google Scholar]
- Baseler HA, Brewer AA, Sharpe LT, Morland AB, Jägle H, Wandell BA. Reorganization of human cortical maps caused by inherited photoreceptor abnormalities. Nat Neurosci. 2002;5:364–370. doi: 10.1038/nn817. [DOI] [PubMed] [Google Scholar]
- Blakemore C, Tobin EA. Lateral inhibition between orientation detectors in the cat's visual cortex. Exp Brain Res. 1972;15:439–440. doi: 10.1007/BF00234129. [DOI] [PubMed] [Google Scholar]
- Boas DA, Jones SR, Devor A, Huppert TJ, Dale AM. A vascular anatomical network model of the spatio-temporal response to brain activation. Neuroimage. 2008;40:1116–1129. doi: 10.1016/j.neuroimage.2007.12.061. [DOI] [PMC free article] [PubMed] [Google Scholar]
- Bonin V, Mante V, Carandini M. The suppressive field of neurons in lateral geniculate nucleus. J Neurosci. 2005;25:10844–10856. doi: 10.1523/JNEUROSCI.3562-05.2005. [DOI] [PMC free article] [PubMed] [Google Scholar]
- Boynton GM. A framework for describing the effects of attention on visual responses. Vision Res. 2009;49:1129–1143. doi: 10.1016/j.visres.2008.11.001. [DOI] [PMC free article] [PubMed] [Google Scholar]
- Boynton GM, Demb JB, Glover GH, Heeger DJ. Neuronal basis of contrast discrimination. Vision Res. 1999;39:257–269. doi: 10.1016/s0042-6989(98)00113-8. [DOI] [PubMed] [Google Scholar]
- Brainard DH. Calibration of a computer controlled color monitor. Color Res Appl. 1989;14:23–34. [Google Scholar]
- Buracas GT, Boynton GM. The effect of spatial attention on contrast response functions in human visual cortex. J Neurosci. 2007;27:93–97. doi: 10.1523/JNEUROSCI.3162-06.2007. [DOI] [PMC free article] [PubMed] [Google Scholar]
- Burock MA, Buckner RL, Woldorff MG, Rosen BR, Dale AM. Randomized event-related experimental designs allow for extremely rapid presentation rates using functional MRI. Neuroreport. 1998;9:3735–3739. doi: 10.1097/00001756-199811160-00030. [DOI] [PubMed] [Google Scholar]
- Carandini M, Ferster D. A tonic hyperpolarization underlying contrast adaptation in cat visual cortex. Science. 1997;276:949–952. doi: 10.1126/science.276.5314.949. [DOI] [PubMed] [Google Scholar]
- Carandini M, Heeger DJ, Movshon JA. Linearity and normalization in simple cells of the macaque primary visual cortex. J Neurosci. 1997;17:8621–8644. doi: 10.1523/JNEUROSCI.17-21-08621.1997. [DOI] [PMC free article] [PubMed] [Google Scholar]
- Carandini M, Demb JB, Mante V, Tolhurst DJ, Dan Y, Olshausen BA, Gallant JL, Rust NC. Do we know what the early visual system does? J Neurosci. 2005;25:10577–10597. doi: 10.1523/JNEUROSCI.3726-05.2005. [DOI] [PMC free article] [PubMed] [Google Scholar]
- Cavanaugh JR, Bair W, Movshon JA. Nature and interaction of signals from the receptive field center and surround in macaque V1 neurons. J Neurophysiol. 2002a;88:2530–2546. doi: 10.1152/jn.00692.2001. [DOI] [PubMed] [Google Scholar]
- Cavanaugh JR, Bair W, Movshon JA. Selectivity and spatial distribution of signals from the receptive field surround in macaque V1 neurons. J Neurophysiol. 2002b;88:2547–2556. doi: 10.1152/jn.00693.2001. [DOI] [PubMed] [Google Scholar]
- Chirimuuta M, Tolhurst DJ. Does a Bayesian model of V1 contrast coding offer a neurophysiological account of human contrast discrimination? Vision Res. 2005;45:2943–2959. doi: 10.1016/j.visres.2005.06.022. [DOI] [PubMed] [Google Scholar]
- Connolly M, Van Essen D. The representation of the visual field in parvicellular and magnocellular layers of the lateral geniculate nucleus in the macaque monkey. J Comp Neurol. 1984;226:544–564. doi: 10.1002/cne.902260408. [DOI] [PubMed] [Google Scholar]
- Cornelissen FW, Wade AR, Vladusich T, Dougherty RF, Wandell BA. No functional magnetic resonance imaging evidence for brightness and color filling-in in early human visual cortex. J Neurosci. 2006;26:3634–3641. doi: 10.1523/JNEUROSCI.4382-05.2006. [DOI] [PMC free article] [PubMed] [Google Scholar]
- Dale AM, Buckner RL. Selective averaging of rapidly presented individual trials using fMRI. Hum Brain Mapp. 1997;5:329–340. doi: 10.1002/(SICI)1097-0193(1997)5:5<329::AID-HBM1>3.0.CO;2-5. [DOI] [PubMed] [Google Scholar]
- Dayan P, Abbott LF. Theoretical neuroscience: computational and mathematical modeling of neural systems. Cambridge, MA: Massachusetts Institute of Technology; 2001. [Google Scholar]
- DeAngelis GC, Freeman RD, Ohzawa I. Length and width tuning of neurons in the cat's primary visual cortex. J Neurophysiol. 1994;71:347–374. doi: 10.1152/jn.1994.71.1.347. [DOI] [PubMed] [Google Scholar]
- Derdikman D, Hildesheim R, Ahissar E, Arieli A, Grinvald A. Imaging spatiotemporal dynamics of surround inhibition in the barrels somatosensory cortex. J Neurosci. 2003;23:3100–3105. doi: 10.1523/JNEUROSCI.23-08-03100.2003. [DOI] [PMC free article] [PubMed] [Google Scholar]
- Devor A, Ulbert I, Dunn AK, Narayanan SN, Jones SR, Andermann ML, Boas DA, Dale AM. Coupling of the cortical hemodynamic response to cortical and thalamic neuronal activity. Proc Natl Acad Sci U S A. 2005;102:3822–3827. doi: 10.1073/pnas.0407789102. [DOI] [PMC free article] [PubMed] [Google Scholar]
- Devor A, Tian P, Nishimura N, Teng IC, Hillman EM, Narayanan SN, Ulbert I, Boas DA, Kleinfeld D, Dale AM. Suppressed neuronal activity and concurrent arteriolar vasoconstriction may explain negative blood oxygenation level-dependent signal. J Neurosci. 2007;27:4452–4459. doi: 10.1523/JNEUROSCI.0134-07.2007. [DOI] [PMC free article] [PubMed] [Google Scholar]
- Devor A, Hillman EM, Tian P, Waeber C, Teng IC, Ruvinskaya L, Shalinsky MH, Zhu H, Haslinger RH, Narayanan SN, Ulbert I, Dunn AK, Lo EH, Rosen BR, Dale AM, Kleinfeld D, Boas DA. Stimulus-induced changes in blood flow and 2-deoxyglucose uptake dissociate in ipsilateral somatosensory cortex. J Neurosci. 2008;28:14347–14357. doi: 10.1523/JNEUROSCI.4307-08.2008. [DOI] [PMC free article] [PubMed] [Google Scholar]
- DeYoe EA, Carman GJ, Bandettini P, Glickman S, Wieser J, Cox R, Miller D, Neitz J. Mapping striate and extrastriate visual areas in human cerebral cortex. Proc Natl Acad Sci U S A. 1996;93:2382–2386. doi: 10.1073/pnas.93.6.2382. [DOI] [PMC free article] [PubMed] [Google Scholar]
- Duncan RO, Boynton GM. Cortical magnification within human primary visual cortex correlates with acuity thresholds. Neuron. 2003;38:659–671. doi: 10.1016/s0896-6273(03)00265-4. [DOI] [PubMed] [Google Scholar]
- Durand S, Freeman TC, Carandini M. Temporal properties of surround suppression in cat primary visual cortex. Vis Neurosci. 2007;24:679–690. doi: 10.1017/S0952523807070563. [DOI] [PubMed] [Google Scholar]
- Engel S, Zhang X, Wandell B. Colour tuning in human visual cortex measured with functional magnetic resonance imaging. Nature. 1997a;388:68–71. doi: 10.1038/40398. [DOI] [PubMed] [Google Scholar]
- Engel SA, Glover GH, Wandell BA. Retinotopic organization in human visual cortex and the spatial precision of functional MRI. Cereb Cortex. 1997b;7:181–192. doi: 10.1093/cercor/7.2.181. [DOI] [PubMed] [Google Scholar]
- Estévez O, Spekreijse H. The “silent substitution” method in visual research. Vision Res. 1982;22:681–691. doi: 10.1016/0042-6989(82)90104-3. [DOI] [PubMed] [Google Scholar]
- Ferster D. Spatially opponent excitation and inhibition in simple cells of the cat visual cortex. J Neurosci. 1988;8:1172–1180. doi: 10.1523/JNEUROSCI.08-04-01172.1988. [DOI] [PMC free article] [PubMed] [Google Scholar]
- Foley JM. Human luminance pattern-vision mechanisms: masking experiments require a new model. J Opt Soc Am A Opt Image Sci Vis. 1994;11:1710–1719. doi: 10.1364/josaa.11.001710. [DOI] [PubMed] [Google Scholar]
- Frackowiak RSJ, Friston KJ, Frith CD, Dolan M, Price C, Zeki K, Ashburner J, Penny WD. Human brain function. Ed 2. New York: Academic; 2003. [Google Scholar]
- Grinvald A, Shoham D, Shmuel A, Glaser D, Vanzetta I, Shtoyerman H, Slovin A, Skerkin C, Hildesheim R, Arieli A. Grodetsky Center for Research of Higher Brain Functions: Technical Report. Rehovot, Israel: Weizmann Institute; 2001. In vivo optical imaging of cortical architecture and dynamics. [Google Scholar]
- Harel N, Lee SP, Nagaoka T, Kim DS, Kim SG. Origin of negative blood oxygenation level-dependent fMRI signals. J Cereb Blood Flow Metab. 2002;22:908–917. doi: 10.1097/00004647-200208000-00002. [DOI] [PubMed] [Google Scholar]
- Heeger DJ. Normalization of cell responses in cat striate cortex. Vis Neurosci. 1992;9:181–197. doi: 10.1017/s0952523800009640. [DOI] [PubMed] [Google Scholar]
- Heinemann L, Kleinschmidt A, Müller NG. Exploring BOLD changes during spatial attention in non-stimulated visual cortex. PLoS One. 2009;4:e5560. doi: 10.1371/journal.pone.0005560. [DOI] [PMC free article] [PubMed] [Google Scholar]
- Horiguchi H, Nakadomari S, Misaki M, Wandell BA. Two temporal channels in human V1 identified using fMRI. Neuroimage. 2009;47:273–280. doi: 10.1016/j.neuroimage.2009.03.078. [DOI] [PMC free article] [PubMed] [Google Scholar]
- Ichida JM, Schwabe L, Bressloff PC, Angelucci A. Response facilitation from the “suppressive” receptive field surround of macaque V1 neurons. J Neurophysiol. 2007;98:2168–2181. doi: 10.1152/jn.00298.2007. [DOI] [PubMed] [Google Scholar]
- Itti L, Koch C, Braun J. Revisiting spatial vision: toward a unifying model. J Opt Soc Am A Opt Image Sci Vis. 2000;17:1899–1917. doi: 10.1364/josaa.17.001899. [DOI] [PubMed] [Google Scholar]
- Kastner S, Pinsk MA, De Weerd P, Desimone R, Ungerleider LG. Increased activity in human visual cortex during directed attention in the absence of visual stimulation. Neuron. 1999;22:751–761. doi: 10.1016/s0896-6273(00)80734-5. [DOI] [PubMed] [Google Scholar]
- Kayama Y, Riso RR, Bartlett JR, Doty RW. Luxotonic responses of units in macaque striate cortex. J Neurophysiol. 1979;42:1495–1517. doi: 10.1152/jn.1979.42.6.1495. [DOI] [PubMed] [Google Scholar]
- Kleinschmidt A, Lee BB, Requardt M, Frahm J. Functional mapping of color processing by magnetic resonance imaging of responses to selective P- and M-pathway stimulation. Exp Brain Res. 1996;110:279–288. doi: 10.1007/BF00228558. [DOI] [PubMed] [Google Scholar]
- Krüger J. The shift-effect in the lateral geniculate body of the rhesus monkey. Exp Brain Res. 1977;29:387–392. doi: 10.1007/BF00236177. [DOI] [PubMed] [Google Scholar]
- Lee BB, Sun H. The chromatic input to cells of the magnocellular pathway of primates. J Vis. 2009;9(15):11–18. doi: 10.1167/9.2.15. [DOI] [PMC free article] [PubMed] [Google Scholar]
- Li X, Lu ZL, Tjan BS, Dosher BA, Chu W. Blood oxygenation level-dependent contrast response functions identify mechanisms of covert attention in early visual areas. Proc Natl Acad Sci U S A. 2008;105:6202–6207. doi: 10.1073/pnas.0801390105. [DOI] [PMC free article] [PubMed] [Google Scholar]
- Ling S, Liu T, Carrasco M. How spatial and feature-based attention affect the gain and tuning of population responses. Vision Res. 2009;49:1194–1204. doi: 10.1016/j.visres.2008.05.025. [DOI] [PMC free article] [PubMed] [Google Scholar]
- Liu J, Wandell BA. Specializations for chromatic and temporal signals in human visual cortex. J Neurosci. 2005;25:3459–3468. doi: 10.1523/JNEUROSCI.4206-04.2005. [DOI] [PMC free article] [PubMed] [Google Scholar]
- Logothetis NK, Wandell BA. Interpreting the BOLD signal. Annu Rev Physiol. 2004;66:735–769. doi: 10.1146/annurev.physiol.66.082602.092845. [DOI] [PubMed] [Google Scholar]
- Logothetis NK, Murayama Y, Augath M, Steffen T, Werner J, Oeltermann A. How not to study spontaneous activity. Neuroimage. 2009;45:1080–1089. doi: 10.1016/j.neuroimage.2009.01.010. [DOI] [PubMed] [Google Scholar]
- MacLeod DI, Boynton RM. Chromaticity diagram showing cone excitation by stimuli of equal luminance. J Opt Soc Am. 1979;69:1183–1186. doi: 10.1364/josa.69.001183. [DOI] [PubMed] [Google Scholar]
- McKee SP, Taylor DG. Discrimination of time: comparison of foveal and peripheral sensitivity. J Opt Soc Am A. 1984;1:620–627. doi: 10.1364/josaa.1.000620. [DOI] [PubMed] [Google Scholar]
- Movshon JA, Thompson ID, Tolhurst DJ. Spatial summation in the receptive fields of simple cells in the cat's striate cortex. J Physiol. 1978;283:53–77. doi: 10.1113/jphysiol.1978.sp012488. [DOI] [PMC free article] [PubMed] [Google Scholar]
- Palmer LA, Davis TL. Receptive-field structure in cat striate cortex. J Neurophysiol. 1981;46:260–276. doi: 10.1152/jn.1981.46.2.260. [DOI] [PubMed] [Google Scholar]
- Petrov Y, McKee SP. The time course of contrast masking reveals two distinct mechanisms of human surround suppression. J Vis. 2009;9:21.1–11. doi: 10.1167/9.1.21. [DOI] [PMC free article] [PubMed] [Google Scholar]
- Petrov Y, Carandini M, McKee S. Two distinct mechanisms of suppression in human vision. J Neurosci. 2005;25:8704–8707. doi: 10.1523/JNEUROSCI.2871-05.2005. [DOI] [PMC free article] [PubMed] [Google Scholar]
- Petrov Y, Popple AV, McKee SP. Crowding and surround suppression: not to be confused. J Vis. 2007;7:12.1–9. doi: 10.1167/7.2.12. [DOI] [PMC free article] [PubMed] [Google Scholar]
- Priebe NJ, Ferster D. Inhibition, spike threshold, and stimulus selectivity in primary visual cortex. Neuron. 2008;57:482–497. doi: 10.1016/j.neuron.2008.02.005. [DOI] [PubMed] [Google Scholar]
- Priebe NJ, Mechler F, Carandini M, Ferster D. The contribution of spike threshold to the dichotomy of cortical simple and complex cells. Nat Neurosci. 2004;7:1113–1122. doi: 10.1038/nn1310. [DOI] [PMC free article] [PubMed] [Google Scholar]
- Ress D, Backus BT, Heeger DJ. Activity in primary visual cortex predicts performance in a visual detection task. Nat Neurosci. 2000;3:940–945. doi: 10.1038/78856. [DOI] [PubMed] [Google Scholar]
- Reynolds JH, Heeger DJ. The normalization model of attention. Neuron. 2009;61:168–185. doi: 10.1016/j.neuron.2009.01.002. [DOI] [PMC free article] [PubMed] [Google Scholar]
- Sayres R, Grill-Spector K. Object-selective cortex exhibits performance-independent repetition suppression. J Neurophysiol. 2006;95:995–1007. doi: 10.1152/jn.00500.2005. [DOI] [PubMed] [Google Scholar]
- Schira MM, Fahle M, Donner TH, Kraft A, Brandt SA. Differential contribution of early visual areas to the perceptual process of contour processing. J Neurophysiol. 2004;91:1716–1721. doi: 10.1152/jn.00380.2003. [DOI] [PubMed] [Google Scholar]
- Schira MM, Wade AR, Tyler CW. Two-dimensional mapping of the central and parafoveal visual field to human visual cortex. J Neurophysiol. 2007;97:4284–4295. doi: 10.1152/jn.00972.2006. [DOI] [PubMed] [Google Scholar]
- Sereno MI, Dale AM, Reppas JB, Kwong KK, Belliveau JW, Brady TJ, Rosen BR, Tootell RB. Borders of multiple visual areas in humans revealed by functional magnetic resonance imaging. Science. 1995;268:889–893. doi: 10.1126/science.7754376. [DOI] [PubMed] [Google Scholar]
- Shadlen MN, Britten KH, Newsome WT, Movshon JA. A computational analysis of the relationship between neuronal and behavioral responses to visual motion. J Neurosci. 1996;16:1486–1510. doi: 10.1523/JNEUROSCI.16-04-01486.1996. [DOI] [PMC free article] [PubMed] [Google Scholar]
- Shmuel A, Yacoub E, Pfeuffer J, Van de Moortele PF, Adriany G, Hu X, Ugurbil K. Sustained negative BOLD, blood flow and oxygen consumption response and its coupling to the positive response in the human brain. Neuron. 2002;36:1195–1210. doi: 10.1016/s0896-6273(02)01061-9. [DOI] [PubMed] [Google Scholar]
- Shmuel A, Augath M, Oeltermann A, Logothetis NK. Negative functional MRI response correlates with decreases in neuronal activity in monkey visual area V1. Nat Neurosci. 2006;9:569–577. doi: 10.1038/nn1675. [DOI] [PubMed] [Google Scholar]
- Sirotin YB, Das A. Anticipatory haemodynamic signals in sensory cortex not predicted by local neuronal activity. Nature. 2009;457:475–479. doi: 10.1038/nature07664. [DOI] [PMC free article] [PubMed] [Google Scholar]
- Smith AT, Williams AL, Singh KD. Negative BOLD in the visual cortex: evidence against blood stealing. Hum Brain Mapp. 2004;21:213–220. doi: 10.1002/hbm.20017. [DOI] [PMC free article] [PubMed] [Google Scholar]
- Smith MA, Bair W, Movshon JA. Dynamics of suppression in macaque primary visual cortex. J Neurosci. 2006;26:4826–4834. doi: 10.1523/JNEUROSCI.5542-06.2006. [DOI] [PMC free article] [PubMed] [Google Scholar]
- Solomon SG, White AJ, Martin PR. Extraclassical receptive field properties of parvocellular, magnocellular, and koniocellular cells in the primate lateral geniculate nucleus. J Neurosci. 2002;22:338–349. doi: 10.1523/JNEUROSCI.22-01-00338.2002. [DOI] [PMC free article] [PubMed] [Google Scholar]
- Solomon SG, Peirce JW, Lennie P. The impact of suppressive surrounds on chromatic properties of cortical neurons. J Neurosci. 2004;24:148–160. doi: 10.1523/JNEUROSCI.3036-03.2004. [DOI] [PMC free article] [PubMed] [Google Scholar]
- Solomon SG, Lee BB, Sun H. Suppressive surrounds and contrast gain in magnocellular-pathway retinal ganglion cells of macaque. J Neurosci. 2006;26:8715–8726. doi: 10.1523/JNEUROSCI.0821-06.2006. [DOI] [PMC free article] [PubMed] [Google Scholar]
- Stockman A, MacLeod DI, Johnson NE. Spectral sensitivities of the human cones. J Opt Soc Am A Opt Image Sci Vis. 1993;10:2491–2521. doi: 10.1364/josaa.10.002491. [DOI] [PubMed] [Google Scholar]
- Teo PC, Sapiro G, Wandell BA. Creating connected representations of cortical gray matter for functional MRI visualization. IEEE Trans Med Imaging. 1997;16:852–863. doi: 10.1109/42.650881. [DOI] [PubMed] [Google Scholar]
- Tootell RB, Mendola JD, Hadjikhani NK, Liu AK, Dale AM. The representation of the ipsilateral visual field in human cerebral cortex. Proc Natl Acad Sci U S A. 1998a;95:818–824. doi: 10.1073/pnas.95.3.818. [DOI] [PMC free article] [PubMed] [Google Scholar]
- Tootell RB, Hadjikhani N, Hall EK, Marrett S, Vanduffel W, Vaughan JT, Dale AM. The retinotopy of visual spatial attention. Neuron. 1998b;21:1409–1422. doi: 10.1016/s0896-6273(00)80659-5. [DOI] [PubMed] [Google Scholar]
- Treue S, Martínez Trujillo JC. Feature-based attention influences motion processing gain in macaque visual cortex. Nature. 1999;399:575–579. doi: 10.1038/21176. [DOI] [PubMed] [Google Scholar]
- Tyler CW, Hamer RD. Analysis of visual modulation sensitivity. IV. Validity of the Ferry-Porter law. J Opt Soc Am A. 1990;7:743–758. doi: 10.1364/josaa.7.000743. [DOI] [PubMed] [Google Scholar]
- Tyler CW, Hamer RD. Eccentricity and the Ferry-Porter law. J Opt Soc Am A Opt Image Sci Vis. 1993;10:2084–2087. doi: 10.1364/josaa.10.002084. [DOI] [PubMed] [Google Scholar]
- Wade AR, Wandell BA. Chromatic light adaptation measured using functional magnetic resonance imaging. J Neurosci. 2002;22:8148–8157. doi: 10.1523/JNEUROSCI.22-18-08148.2002. [DOI] [PMC free article] [PubMed] [Google Scholar]
- Wandell BA, Poirson AB, Newsome WT, Baseler HA, Boynton GM, Huk A, Gandhi S, Sharpe LT. Color signals in human motion-selective cortex. Neuron. 1999;24:901–909. doi: 10.1016/s0896-6273(00)81037-5. [DOI] [PubMed] [Google Scholar]
- Watson AB, Pelli DG. QUEST: a Bayesian adaptive psychometric method. Percept Psychophys. 1983;33:113–120. doi: 10.3758/bf03202828. [DOI] [PubMed] [Google Scholar]
- Webb BS, Dhruv NT, Solomon SG, Tailby C, Lennie P. Early and late mechanisms of surround suppression in striate cortex of macaque. J Neurosci. 2005;25:11666–11675. doi: 10.1523/JNEUROSCI.3414-05.2005. [DOI] [PMC free article] [PubMed] [Google Scholar]
- Williams PE, Mechler F, Gordon J, Shapley R, Hawken MJ. Entrainment to video displays in primary visual cortex of macaque and humans. J Neurosci. 2004;24:8278–8288. doi: 10.1523/JNEUROSCI.2716-04.2004. [DOI] [PMC free article] [PubMed] [Google Scholar]
- Williford T, Maunsell JH. Effects of spatial attention on contrast response functions in macaque area V4. J Neurophysiol. 2006;96:40–54. doi: 10.1152/jn.01207.2005. [DOI] [PubMed] [Google Scholar]
- Xing J, Heeger DJ. Center-surround interactions in foveal and peripheral vision. Vision Res. 2000;40:3065–3072. doi: 10.1016/s0042-6989(00)00152-8. [DOI] [PubMed] [Google Scholar]
- Xing J, Heeger DJ. Measurement and modeling of center-surround suppression and enhancement. Vision Res. 2001;41:571–583. doi: 10.1016/s0042-6989(00)00270-4. [DOI] [PubMed] [Google Scholar]