Abstract
Acervuli are calcified concretions in the pineal gland (PG). Particularly interesting are their incidence and size, which are believed to affect neurological disorders and many physiological functions of PG such as regulating circadian rhythm. Despite long investigations for a century, detailed growth mechanism of acervuli has yet to be studied. Here we study the growth morphology of acervuli in human PGs by a direct visualization in 3-dimension (3-D) using a synchrotron X-ray imaging method. For an entire PG, non-aggregated acervuli show Gaussian distribution in size with 47±28 µm. The 3-D volume rendered images of acervuli reveal that the bumpy surfaces developed by lamination result in the mulberry-like structure. In addition, coalescence of multiple acervuli leads to large-scale lamination on the whole aggregate. We suggest a novel hypothesis on the growth patterns of acervuli by their nucleation density (Nd): i) mulberry-like structure at low Nd, and ii) large-scale lamination on an aggregate at high Nd.
Pineal acervuli (concretions, corpora arenacea or brain sand), known as a normal physiologic phenomenon in pineal gland (PG)1,2,3,4, have long been studied because of their association with aging5,6,7,8, melatonin production9,10,11 or neurological disorders12,13,14,15,16. The relevance of acervuli to aging is still arguable; in general views the incidence and amount of acervuli are believed to increase with age5,8,17,18 despite several irrelevant cases6,7,19,20. The degree of pineal calcification is associated not only with melatonin secretion9,10,11,21, but also with many neurodegenerative disorders, such as Alzheimer's disease13, multiple sclerosis16, epilepsy12, and Schizophrenia15,22.
For a century, acervuli have been investigated using various imaging techniques such as conventional skull radiography23,24,25,26, X-ray computer-assisted tomography (CT)5,27, light microscopy (LM)28,29, transmission electron microscopy (TEM)1,30, and scanning electron microscopy (SEM)4,30,31. However, systematic morphological analyses of acervuli in entire human PGs are not reported yet due to the limitations of such visualization systems.
Here we present an alternate strategy of synchrotron X-ray imaging, which can visualize the morphologies of acervuli in 3-dimension (3-D) over entire human PGs and give access to quantitative analysis. Phase contrast based on strongly collimated synchrotron hard X-rays32,33 produces images of excellent quality due to strong edge enhancement between different regions34,35. Furthermore thick specimens can be examined with high resolution as required here, thanks to high-penetration power of hard X-rays36,37.
Results
Micro-architectures of acervuli
To set up the control basis for synchrotron X-ray approach, acervular micro-architectures in the human PGs were acquired using LM, TEM, and SEM, as demonstrated in Fig 1. Typical concentric ring structure of an acervulus, surrounded by connective tissue, is shown in histology (Fig. 1a). TEM shows an example of many concentric laminations (Fig. 1b). Mulberry-like structure with lobes is also observed by SEM (Fig. 1c).
Figure 1. Microscopic images of acervuli in human.
The acervular images with LM (a), TEM (b), and SEM (c). (a) Typical concentric ring structure of an acervulus, surrounded by connective tissue. (b) Acervulus with many concentric laminations. (c) Mulberry-like structure with lobes.
Distributions of acervular size and volume in an entire human PG
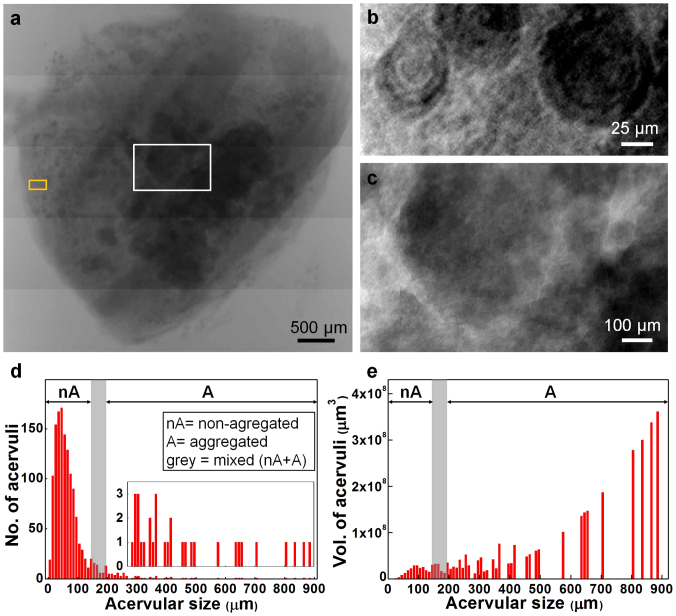
We performed microradiography of an entire human PG using the synchrotron X-ray microscopy, as presented by patched microradiographs with high resolution (Fig. 2a). Acervuli (dark regions in the image) could be easily resolved in the entire PG by the edge-enhanced phase contrast as well as by the absorption contrast that is coming from their main components: calcium and phosphate38. The acervuli in the periphery are small in size with concentric ring structures, as clearly illustrated in Fig. 2b (yellow box in Fig. 2a). In contrast, the acervuli in the center are large, mostly due to coalescence into aggregates (Fig. 2c; white box in Fig. 2a).
Figure 2. Distributions of acervular size and volume from a microradiograph of an entire human PG.
(a) Patched image of an entire PG without physical sectioning (male; age 80). (b) Magnified image of the yellow box region in (a). (c) Magnified image of the white box region in (a). (d) Size distribution of the acervuli measured from the microradiograph of Fig.2a. (inset) Expanded scale. nA, non-aggregared region; A, aggregated region; grey box, mixed region (nA+A). (e) Volume distribution of the acervuli estimated from Fig. 2d assuming a spherical shape.
The acervular size was quantitatively measured from the microradiograph of the entire human PG (Fig. 2a). Most of acervuli spread out over small sizes less than 200 μm, as demonstrated in Fig. 2d. We note that acervuli smaller than 150 μm are non-aggregared (nA) while those larger than 200 μm are aggregated (A); mixed between 150 and 200 μm (grey box). For non-aggregated acervuli, the size follows a Gaussian distribution with a value of 47 ± 28 μm (mean ± SD; R2 = 0.89). Once aggregated, the number of acervuli significantly drops while the size greatly increases up to ~ 900 μm. In particular, there exists single event for the aggregates larger than 450 μm (inset in Fig. 2d). Actually the number fraction of the aggregated acervuli (A region) is very small as 4.6%. However, their volume fraction is very large as 88.5%. Here the acervular volume was estimated from Fig. 2d assuming a spherical shape, as plotted in Fig. 2e.
Microtomographic images of non-aggregated acervuli
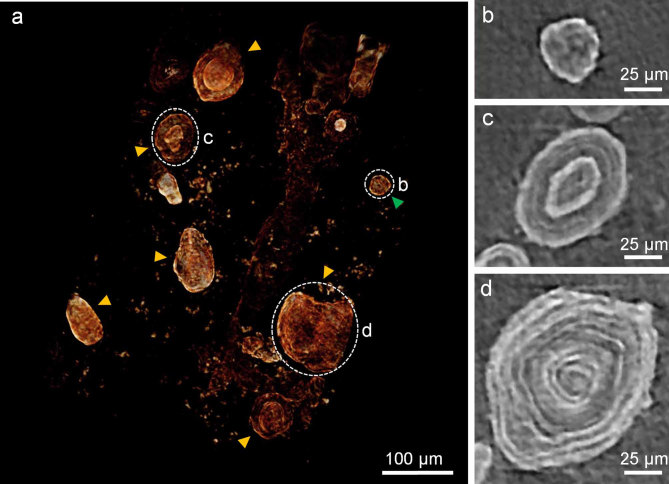
In addition to the projection images, we obtained microtomographs of acervuli in another human PG. Figure 3a demonstrates a 3-D volume rendered image of non-aggregated acervuli in periphery (supplemental video 1). Both globular (green arrow heads in Fig. 3a) and concentric ring (yellow arrow heads) structures can be seen in 3-D geometry. The slice images of Fig. 3b, c, and d (corresponding to white dashed circles of Fig. 3a, respectively) clearly show the internal structures of the acervuli. As the size advances, the number of concentric rings increases (ring numbers b = 0; c = 3; d = 8 in Fig. 3b, c, and d). We note that the ring surface becomes bumpy by acervular growth, as shown in Fig. 3d.
Figure 3. 3-D microtomograph with slices of non-aggregated acervuli.
(a) 3-D volume rendered image of non-aggregated acervuli in periphery (supplemental video 1). green arrow head, globular structure; yellow arrow heads, concentric ring structures. (b), (c), and (d) Slice images of the corresponding regions (white dashed circles) in Fig. 3a.
Microtomographic images of aggregates
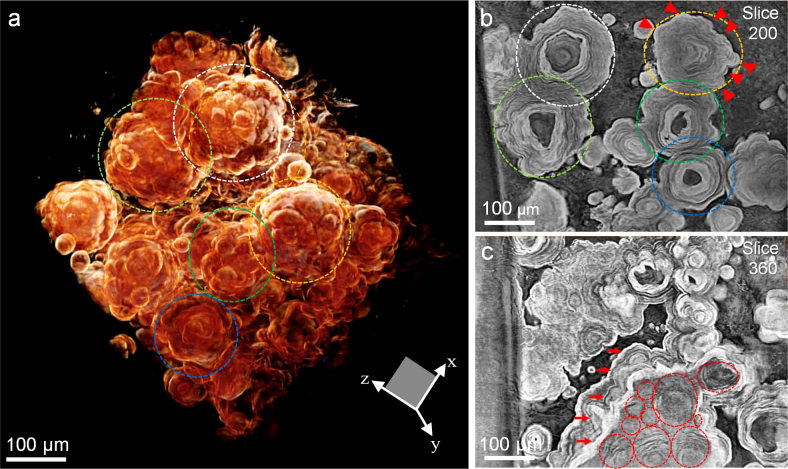
3-D volume rendered image with slices of aggregated acervuli, taken in center of the other human PG, is shown in Figure 4 (supplemental video 2). We observe typical mulberry-like structure, as shown in the dashed circles in Fig. 4a. Remarkably this structure is originated from single acervulus, as confirmed by the corresponding slice images in the dashed circles of Fig. 4b (slice 200 in the x-z plane). Specifically, the development of bumpy structures (for instance, arrow heads in Fig. 4b) by lamination results in the formation of various numbers of lobes in the mulberry-like structure (shown in the dashed circles in Fig. 4a).
Figure 4. 3-D microtomograph with slices of aggregated acervuli.
(a) 3-D volume rendered image of aggregated acervuli in center (supplemental video 2). Here, x-z defines the sliced plane of fig. 4b, c. (b) Image of slice 200 in the x-z plane. The regions of yellow, white, light green, blue, and green dashed circles are corresponding to those of the circles in Fig. 4a, respectively. Red arrow heads indicate bumpy structures. (c) Image of slice 360 in the x-z plane. Red dashed circles show multiple acervuli that are coalesced with each other. Red arrows indicate large-scale laminae.
In addition, we observe coalescence of multiple acervuli (red dashed circles in Fig. 4c) in the slice image of Fig. 4c (slice 360 in the x-z plane). Notably the coalescence leads to large-scale lamination on the whole aggregate, as illustrated by the lamination layers (arrows in Fig. 4c). The edge-enhancement by phase contrast enabled us to clearly resolve detailed structure such as multiple acervuli and laminae.
Discussion
This study investigates the growth morphology of acervuli in human PGs by a direct visualization in 3-D using a synchrotron X-ray imaging method. Phase contrast radiography based on strongly collimated synchrotron hard X-rays is well suited to the imaging of soft tissue and of very small features in biological samples, comparing to absorption based radiography32,33,36. Deposits in brain system with complex microscopic geometry could profit from the performance of this approach. This specifically applied to the studies of Lewy bodies39 and amyloid plaques40 in human brains. The current study on acervuli, another type of deposits in brain system, is promising as well.
To quantify detailed microstructure over a whole organ could provide a useful map of anatomical structure with the potential to provide functional insight37,41,42. By analyzing a large number of acervuli (n = 1,378) over an entire human PG (Fig. 2), we were able to quantify their size and volume distribution patterns, which are possibly associated with PG functions43,44,45 and neurological disorders13,15,46. For numerous non-aggregated acervuli, the size shows a normal Gaussian distribution with a value of 47 ± 28 μm (mean ± SD), as naturally observed in many biological measurement situations. This normality, however, vanishes for the aggregates above 200 μm by the significant reduction in their number (4.6% in the number fraction). In particular, there exist single event for the aggregates larger than 450 μm (inset in Fig. 2d). Despite their small number fraction (4.6%), the volume fraction is very large as 88.5%. This implies that acervuli-related PG functions may be significantly affected by a small number of such large aggregates, not by a large number of non-aggregates.
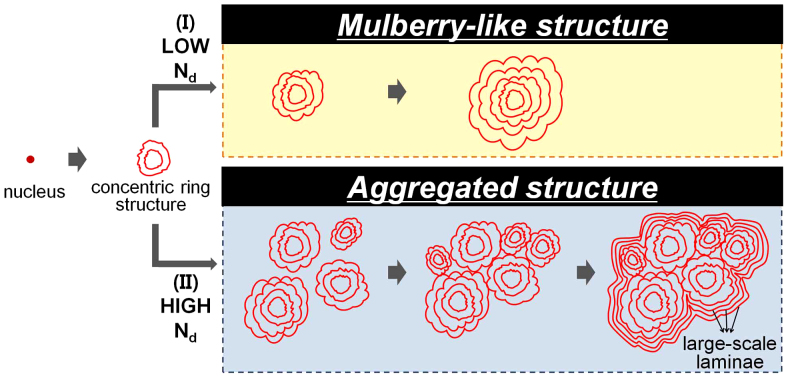
Based on the direct visualization in 3-D, we propose the growth patterns of acervuli in human PG (Fig. 5). Specifically we suggest that their nucleation density (Nd) plays an important role on acervular morphology. After the formation of concentric ring structure on a nucleus, the acervular morphology may follow one of the two ways depending on Nd: (I) mulberry-like structure at low Nd or (II) large scale lamination on a whole aggregate at high Nd.
Figure 5. Hypothesis of acervuli growth patterns.
See text for details. Nd, nucleation density.
We first discuss on the acervular growth pattern at low Nd (yellow box in Fig. 5). Once nucleated, globular and concentric ring structures develop, as observed in the non-aggregated acervuli of the periphery in Fig. 3. As the acervulus continues to grow, bumpy structures are developed by lamination, resulting in the mulberry-like structure (Fig. 4a). Actually it is important that the mulberry-like structure in this study is originated from single acervulus (Fig. 4), not from an aggregation of multiple acervuli. This was not clear by observing only the surface morphology of the mulberry-like structure in Fig. 4a. The corresponding slice image in Fig. 4b clearly explains the origination from single acervulus. Adjunctively we point out that a wrong conclusion could be drawn on the structural information if 2-D image only used. In another slice image (slice 120; SFig. 1) of Fig. 4a, for instance, the structure in the white dashed circle looks like an aggregate of multiple acervuli, possibly leading to a misinterpretation that mulberry-like structure would be formed by an aggregation.
Now we move to the discussion on the acervular growth pattern at high Nd (blue box in Fig. 5). Acervuli with concentric rings would be easily coalesced with neighboring ones at high Nd as the growth advances. The whole aggregate is laminated in large-scale as the growth continues to proceed (see Fig. 4c). This suggests that the large-scale lamination on the whole aggregate is one of the formation processes of extremely large aggregate.
The direct visualization in 3-D using a synchrotron X-ray imaging method enabled us to study the growth patterns of acervuli in human PG and suggest their growth process. Our accurate, quantitative results could provide insights into pathology for acervuli-related neurological disorders.
Methods
Dissection of human PGs
PGs were collected from 8 human cadavers (age 62–80, 5 males, 3 females) in the department of anatomy college of medicine, Korea University. Any subjects related with PG diseases were excluded from the death cause of each cadaver. We removed brains from formalin fixed cadavers and dissected PGs at their stalks. The PGs were further fixed in 4% paraformaldehyde fixative and stored in refrigerator.
Sample preparations for four imaging methods
Light Microscopy
After standard dehydration in ethanol series, paraffin embedded PG blocks were sectioned at a 4μm thickness. The slides were stained with hematoxyline and eosin47. Histological evaluation was performed with LM (Carl Zeiss Axio Imager A1, Germany).
Scanning Electron Microscopy
The PGs were postfixed with 1% osmium tetroxide for 1 hour at 4°C. After standard dehydration in ethanol series, the samples were dried by freezing dryer (Hitachi ES-2030, Tokyo, Japan) and coated with platinum in ion coater (Eiko IB-5, Tokyo, Japan) for the observation by SEM (Hitachi S-4700, Tokyo, Japan).
Transmission Electron Microscopy
The PGs were postfixed with 1% osmium tetroxide for 1 hour at 4°C. After standard dehydration in ethanol series, the samples were embedded in Epon 812 (epon 812 kit: EMS, Hatfield, PA, USA). Ultrathin sections were stained with uranyl acetate & lead citrate and examined under a Hitachi H-7500 TEM at 75 kV (Hitachi, Tokyo, Japan).
Synchrotron X-ray Imaging
After standard dehydration in ethanol series, the samples were embedded in Epon 812 for the observation by synchrotron X-ray imaging.
Synchrotron X-ray microradiography
The microradiographic experiments were performed at 7B2 X-ray microscopy beamline (10–60 keV energy range; PLS, Korea: 2.5 GeV)48. In order to block or control the X-ray flux, a mechanical shutter with a Pt-Ir blade or Si attenuators was used respectively. Sample was mounted on a high precision motor-controlled stage with rotational, tilting, and translational resolutions of 0.002°, 0.0009°, and 250 nm, respectively. After passing through the sample, the transmitted X-rays were converted to visible image using a scintillator (CdWO4: Nihon Kessho Koogaku Co. Ltd., Hinata Tatebayashi-City Gunma, Japan). After reflected by a mirror and magnified by an optical lens, the image was captured by a CCD camera.
Synchrotron X-ray microtomography
The microtomographic experiments for the visualization in 3-D were carried out by taking 1000 microradiographs at every 0.18° rotation step, calibrated with background images. The projected image set was reconstructed by four parallel computers equipped with the standard filter-back projection reconstruction algorithm. Reconstructed slices consisted of 1600 × 1600 pixels in the horizontal and vertical directions. Volume-rendered 3-D images were obtained from the vertically stacked 2-D slices using the Amira5.2 software (Visage Imaging, San Diego, CA, USA).
Author Contributions
J.K., I.J.R. and J.H.J. designed the research, J.K., H.W.K., S.C., J.W.K., I.J.R. and J.H.J. conducted the research, J.K. analyzed the data, J.K., I.J.R. and J.H.J. wrote the paper, J.K., I.J.R. and J.H.J. edited the paper.
Supplementary Material
Supplementary figures
Supplemental video 1
Supplemental video 2
Acknowledgments
This work was supported by the Creative Research Initiatives (Functional X-ray Imaging) of MEST/NRF. I.J. Rhyu acknowledges the support from Korea University.
References
- Vigh B. et al. Comparative histology of pineal calcification. Histol Histopathol 13, 851–870 (1998). [DOI] [PubMed] [Google Scholar]
- MG W. Pineal calcification: Structural and functional aspects. Pineal Res Rev 3, 41–68 (1985). [Google Scholar]
- Krstic R. Pineal calcification: its mechanism and significance. J Neural Transm Suppl 21, 415–432 (1986). [PubMed] [Google Scholar]
- Kodaka T., Mori R., Debari K. & Yamada M. Scanning electron microscopy and electron probe microanalysis studies of human pineal concretions. J Electron Microsc (Tokyo) 43, 307–317 (1994). [PubMed] [Google Scholar]
- Zimmerman R. A. & Bilaniuk L. T. Age-related incidence of pineal calcification detected by computed tomography. Radiology 142, 659–662 (1982). [DOI] [PubMed] [Google Scholar]
- Hasegawa A., Ohtsubo K. & Mori W. Pineal gland in old age; quantitative and qualitative morphological study of 168 human autopsy cases. Brain Res 409, 343–349 (1987). [DOI] [PubMed] [Google Scholar]
- Mori R., Kodaka T. & Sano T. Preliminary report on the correlations among pineal concretions, prostatic calculi and age in human adult males. Anat Sci Int 78, 181–184 (2003). [DOI] [PubMed] [Google Scholar]
- Turgut A. T. et al. Age-related changes in the incidence of pineal gland calcification in Turkey: A prospective multicenter CT study. Pathophysiology 15, 41–48 (2008). [DOI] [PubMed] [Google Scholar]
- Kunz D., Bes F., Schlattmann P. & Herrmann W. M. On pineal calcification and its relation to subjective sleep perception: a hypothesis-driven pilot study. Psychiatry Res 82, 187–191 (1998). [DOI] [PubMed] [Google Scholar]
- Reiter R. J. The pineal gland and melatonin in relation to aging: a summary of the theories and of the data. Exp Gerontol 30, 199–212 (1995). [DOI] [PubMed] [Google Scholar]
- Kunz D. et al. A new concept for melatonin deficit: on pineal calcification and melatonin excretion. Neuropsychopharmacology 21, 765–772 (1999). [DOI] [PubMed] [Google Scholar]
- Sandyk R. Calcification of the pineal gland: relationship to laterality of the epileptic foci in patients with complex partial seizures. Int J Neurosci 65, 167–175 (1992). [DOI] [PubMed] [Google Scholar]
- Mahlberg R. et al. Pineal calcification in Alzheimer's disease: an in vivo study using computed tomography. Neurobiol Aging 29, 203–209 (2008). [DOI] [PubMed] [Google Scholar]
- Mahlberg R. et al. Degree of pineal calcification (DOC) is associated with polysomnographic sleep measures in primary insomnia patients. Sleep Med 10, 439–445 (2009). [DOI] [PubMed] [Google Scholar]
- Sandyk R. The relationship of thought disorder to third ventricle width and calcification of the pineal gland in chronic schizophrenia. Int J Neurosci 68, 53–59 (1993). [DOI] [PubMed] [Google Scholar]
- Sandyk R. & Awerbuch G. I. Pineal calcification and its relationship to the fatigue of multiple sclerosis. Int J Neurosci 74, 95–103 (1994). [DOI] [PubMed] [Google Scholar]
- Schmid H. A. & Raykhtsaum G. Age-related differences in the structure of human pineal calcium deposits: results of transmission electron microscopy and mineralographic microanalysis. J Pineal Res 18, 12–20 (1995). [DOI] [PubMed] [Google Scholar]
- Schmid H. A., Requintina P. J., Oxenkrug G. F. & Sturner W. Calcium, calcification, and melatonin biosynthesis in the human pineal gland: a postmortem study into age-related factors. J Pineal Res 16, 178–183 (1994). [DOI] [PubMed] [Google Scholar]
- Galliani I., Frank F., Gobbi P., Giangaspero F. & Falcieri E. Histochemical and ultrastructural study of the human pineal gland in the course of aging. J Submicrosc Cytol Pathol 21, 571–578 (1989). [PubMed] [Google Scholar]
- Galliani I., Falcieri E., Giangaspero F., Valdre G. & Mongiorgi R. A preliminary study of human pineal gland concretions: structural and chemical analysis. Boll Soc Ital Biol Sper 66, 615–622 (1990). [PubMed] [Google Scholar]
- Schmid H. A. Decreased melatonin biosynthesis, calcium flux, pineal gland calcification and aging: a hypothetical framework. Gerontology 39, 189–199 (1993). [DOI] [PubMed] [Google Scholar]
- Sandyk R. Pineal calcification in relation to menopause in schizophrenia. Int J Neurosci 67, 1–8 (1992). [DOI] [PubMed] [Google Scholar]
- Adeloye A. & Felson B. Incidence of normal pineal gland calcification in skull roentgenograms of black and white Americans. Am J Roentgenol Radium Ther Nucl Med 122, 503–507 (1974). [DOI] [PubMed] [Google Scholar]
- Reiter R. J. Pineal Research Reviews, Vol. 3. (Alan R. Liss, Inc., New York; 1985).
- Schüller A. & Stocking F. F. Roentgen diagnosis of diseases of the head. (C. V. Mosby company, St. Louis; 1918).
- Naffzinger H. A method for the localization of brain tumors the pineal shift. Surg Gynec Obst 11, 481–484 (1925). [Google Scholar]
- Kohli N., Rastogi H., Bhadury S. & Tandon V. K. Computed tomographic evaluation of pineal calcification. Indian J Med Res 96, 139–142 (1992). [PubMed] [Google Scholar]
- S Antic, Jovanovic I., Stefanovic N., Pavlovic S., Rancic S. & Ugrenovic S. Morphology and histochemical characteristics of human pineal gland acervuli during the aging. Facta Universitatis Medicine and Biology 11, 63–68 (2004). [Google Scholar]
- S Koshy S. V. Varying appearances of calcification in human pineal gland: a light microscopic study. J Anat Soc India 50, 17–18 (2001). [Google Scholar]
- Krstic R. A combined scanning and transmission electron microscopic study and electron probe microanalysis of human pineal acervuli. Cell Tissue Res 174, 129–137 (1976). [DOI] [PubMed] [Google Scholar]
- Michotte Y., Lowenthal A., Knaepen L., Collard M. & Massart D. L. A morphological and chemical study of calcification of the pineal gland. J Neurol 215, 209–219 (1977). [DOI] [PubMed] [Google Scholar]
- Hwu Y. et al. Imaging cells and tissues with refractive index radiology. Biophys J 87, 4180–4187 (2004). [DOI] [PMC free article] [PubMed] [Google Scholar]
- Hwu Y. et al. Synchrotron microangiography with no contrast agent. Phys Med Biol 49, 501–508 (2004). [DOI] [PubMed] [Google Scholar]
- Hwu Y., Tsai W. L., Groso A., Margaritondo G. & Je J. H. Coherence-enhanced synchrotron radiology: simple theory and practical applications. J Phys D Appl Phys 35, R105–R120 (2002). [Google Scholar]
- Kim J. et al. Altered branching patterns of Purkinje cells in mouse model for cortical development disorder. Scientific reports 1, 122 (2011). [DOI] [PMC free article] [PubMed] [Google Scholar]
- Margaritondo G., Hwu Y. & Je J. H. Synchrotron light in medical and materials science radiology. Riv Nuovo Cimento 27, 1–40 (2004). [Google Scholar]
- Kim J., Choi Y. H., Chang S., Kim K. T. & Je J. H. Defective folliculogenesis in female mice lacking Vaccinia-related kinase 1. Scientific reports 2, 468 (2012). [DOI] [PMC free article] [PubMed] [Google Scholar]
- Krstic R. & Golaz J. Ultrastructural and X-ray microprobe comparison of gerbil and human pineal acervuli. Experientia 33, 507–508 (1977). [DOI] [PubMed] [Google Scholar]
- Koh S. B. et al. Phase contrast radiography of Lewy bodies in Parkinson disease. Neuroimage 32, 566–569 (2006). [DOI] [PubMed] [Google Scholar]
- Connor D. M. et al. Computed tomography of amyloid plaques in a mouse model of Alzheimer's disease using diffraction enhanced imaging. Neuroimage 46, 908–914 (2009). [DOI] [PMC free article] [PubMed] [Google Scholar]
- Boot M. J. et al. In vitro whole-organ imaging: 4D quantification of growing mouse limb buds. Nat Methods 5, 609–612 (2008). [DOI] [PubMed] [Google Scholar]
- Megason S. G. & Fraser S. E. Imaging in systems biology. Cell 130, 784–795 (2007). [DOI] [PubMed] [Google Scholar]
- Trentini G. P., D G. C. F., Criscuolo M., Migaldi M. & Ferrari G. Pineal calcifications in different physiopathological conditions in humans. (Raven Press, New York; 1987.
- Welsh M. G. Pineal calcification: structural and functional aspects. Pineal Res. Rev. 3, 41–68 (1985). [Google Scholar]
- Lukaszyk A. & Reiter R. J. Histophysiological evidence for the secretion of polypeptides by the pineal gland. Am J Anat 143, 451–464 (1975). [DOI] [PubMed] [Google Scholar]
- Sandyk R. The association of pineal calcification with drug-induced dystonic movements. Int J Neurosci 53, 217–222 (1990). [DOI] [PubMed] [Google Scholar]
- Lillie R. D., Pizzolato P. & Donaldson P. T. Hematoxylin substitutes. A study of phenocyanin TC and the use of afterchrome mordanting in histology. Am J Clin Pathol 63, 876–885 (1975). [DOI] [PubMed] [Google Scholar]
- Je J. H., Weon B. M., Hwu Y. & Margaritondo G. Phase contrast X-ray imaging. Int J Nanotechnol 3, 280–297 (2006). [Google Scholar]
Associated Data
This section collects any data citations, data availability statements, or supplementary materials included in this article.
Supplementary Materials
Supplementary figures
Supplemental video 1
Supplemental video 2


