

Abstract
Aim:
The current study was aimed to investigate the feasibility of transdermal delivery of cromolyn sodium using a novel lipid vesicular carrier, ethosomes.
Materials And Methods:
Ethosomes of cromolyn sodium was prepared, optimized, and characterized for vesicle shape, vesicle size and size distribution, zeta potential, entrapment efficiency, in vitro drug release, in vitro skin permeation, in vitro skin deposition and vesicle stability. Histological examination of porcine ear skin treated with optimized ethosomal formulation was performed to study the change of skin morphologies.
Results:
The optimized cromolyn sodium ethosomes showed reasonable entrapment efficiency (49.88±1.84%), optimum nanometric size range (133.8 ± 7.5 nm), and high zeta potential (-69.82 ± 1.2 mV). In vitro drug release studies of optimized ethosomal formulation through cellophane membrane showed an enhanced and sustained delivery of drug compared to conventional liposomes, hydroethanolic, (45% v/v) and phosphate buffer saline PBS pH 7.4 drug solutions. The optimized ethosomal formulation showed significantly-enhanced transdermal flux (18.49 ± 0.08 mg/cm2/h) across porcine ear skin as compared to liposome (1.80 ± 0.12 mg/cm2/h), hydroethanolic drug solution (4.45 ± 0.71 mg/cm2/h), and PBS pH 7.4 drug solution (1.18 ± 0.35 mg/cm2/h). Moreover, ethosomal formulation showed better skin drug deposition (10.28 ± 0.67%) and shortest lag time (0.11 ± 0.09 h) for cromolyn sodium.
Conclusion:
Our significant results suggest that ethosomes can be a promising tool for transdermal delivery of cromolyn sodium.
KEYWORDS: Cromolyn sodium, ethosomes, liposomes, permeation enhancer
Cromolyn sodium (CS), chemically [disodium 4, 4¢- dioxo - 5, 5¢ - (2 - hydroxytrimethylenedioxy) di (chromone - 2 - carboxylate)] is a mast cell stabilizer, and have been clinically used in the treatment of allergic and exercise-induced asthma (prophylatic use), systemic mastocytosis, and food allergy.[1,2] Furthermore, its beneficial effect in atopic dermatitis on topical application and on inflammatory bowel syndrome is evident from various research reports.[3,4] CS is poorly absorbed after an oral administration (~1%). It is usually delivered by inhalation (bioavailability ~7%) and has to be taken 4-8 times daily owing to short half-life (~80 minutes) of the drug.[1] This causes great inconvenience to patients and results in poor compliance. To circumvent all these problems, transdermal administration could be a better option as transdermal route could provide relatively consistent systemic drug levels for prolonged period of time, avoid GI related issues, and improve patient compliance because of non-invasive nature and less frequent dose regime. However, CS is a highly hydrophilic and ionizable drug (pKa 1.9) with a large molecular weight (512.33 Da); therefore, passive transdermal delivery was expected to be low. Hence, it is necessary to use a permeation enhancer to breech the skin barrier, thereby allowing the drugs to absorb. In recent times, ethosomes have attracted considerable attention for their opportunity to enhance dermal/transdermal delivery of a number of bioactive agents.[5–8] Ethosomes are deformable lipid vesicular carriers embodying relatively high concentration of ethanol (20-45%).[6,7] Due to their high deformability, the vesicles permeate intact through the stratum corneum to the deeper skin layers. In vitro and In vivo, in animal and clinical studies have shown that ethosomes are efficient at improving dermal/transdermal delivery of both hydrophilic and lipophilic moieties.[8,9] Therefore, the present study was thus focuses on developing ethosomal formulation of cromolyn sodium with respect to its transdermal delivery.
Materials and Methods
Materials
Soya phosphatidylcholine (Soya PC) was purchased from Sigma-Aldrich, Germany. Cromolyn sodium was kindly provided by Deep Care Health Pvt. Ltd., Ahmadabad, India. Cellophane membrane (molecular weight cut off 12,000-14,000) was purchased from Qualigens Fine Chemicals, Mumbai, India. Ethanol and all other chemicals used were of analytical reagent or HPLC grade.
Methods
Preparation of empty and drug-loaded ethosomal dispersions
Soya PC (3% w/v) was dissolved in ethanol (25-45% v/v) and heated up to 30 ± 1°C in a water bath in a closed vessel. Distilled water or drug solution in distilled water (1% w/v solution), which is previously heated up to 30 ± 1°C, was added slowly in a fine stream to the above ethanolic lipid solution with continuous mixing using a magnetic stirrer at 900 rpm.[10] Mixing was continued for another 5 minutes and finally, the vesicular dispersions resulted was left to cool at room temperature (25 ± 1°C) for 45 minutes. Different ethosomal dispersions and their composition are shown in Table 1.
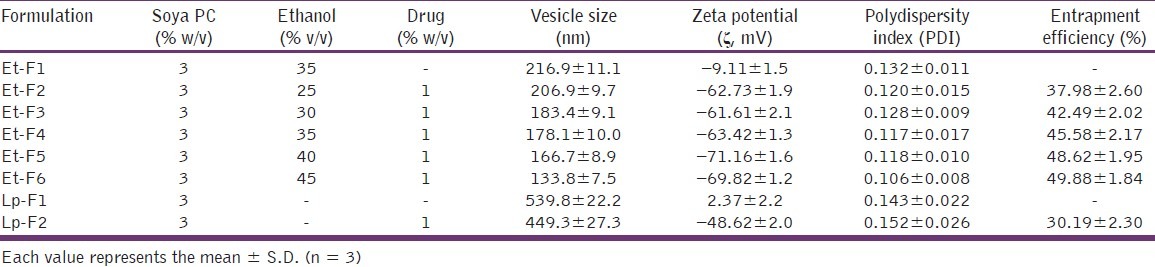
Table 1.
Composition and characterization of different lipid vesicular systems
Preparation of empty and drug-loaded liposomal dispersions
Liposomes were prepared by cast film method.[11] Briefly, soya PC (3% w/v) was dissolved in minimum quantity of chloroform: Methanol mixture (3 : 1 v/v) in a round-bottom flask (RBF). The organic solvents were removed in a rotary evaporator (Superfit, PBU - 6D, India) under vacuum to form a thin film on the inner wall of RBF, and then final traces of solvents were removed under vacuum, overnight. The deposited lipid film was then hydrated with distilled water or with drug solution in distilled water (1% w/v solution) at 60 rpm for 1 hour above the lipid phase transition temperature to anneal the liposome structures and left to cool at room temperature (25 ± 1°C) for 45 minutes. The composition of various liposome formulations is given in Table 1.
Characterization of vesicular dispersions
Visualization of CS ethosomes by scanning electron microscopy
Ethosome formulations were examined by scanning electron microscopy (SEM).[12] 1 drop of vesicular dispersion was mounted on a glass stub, air-dried, and coated with gold using a sputter coater (JEOL, Japan ) and finally, visualized under a JEOL JSM - 6490LA scanning electron microscope (JEOL, Japan) at an accelerating voltage of 15 kV.
Vesicle size and size distribution measurements
Vesicle size and size distribution of empty and drug-loaded ethosomal and liposomal vesicular systems were determined by DLS technique using a computerized Nicomp, 380ZLS (Nicomp, USA) inspection system at 25 ± 1°C and at a scattering angle of 90°.[13]
Zeta potential measurements
Zeta potential (ζ) measurements were done by using a computerized Nicomp, 380ZLS (Nicomp, USA) Zetasizer. Both empty and drug-loaded vesicular systems (ethosomes and liposomes) were analyzed at 25 ± 1°C.[14]
Determination of entrapment efficiency
Entrapment efficiency (EE) of the ethosomal and liposomal vesicular systems were determined by ultracentrifugation method.[15,16] Vesicular dispersions were centrifuged in a Hermele 236HK (Hermele Labortechnik, Germany) ultracentrifuge at 21,000 rpm, at 4 ± 1°C for 90 minutes. Both the supernatant and sediment (after lysed with 0.5% w/w Triton X-100) were assayed for the drug content by using a Shimadzu 1800 (Shimadzu, Japan) double beam UV spectrophotometer at λmax of CS = 327 nm. Percentage entrapment of CS in vesicles was calculated from the equation [(AE – AS) AE] × 100, where AE is the amount of CS determined in the ethosome pellet and AS is the amount of CS determined in the supernatant.
In vitro drug release through cellophane membrane
The experiments were conducted in Franz diffusion cells having a diffusion area of 3.14 cm2 and a receiver volume of 15 ml. A suitable size of pre-treated cellophane membrane was mounted in between donor and receptor cells of the Franz diffusion cells (locally fabricated). The receiver content, phosphate buffer saline, PBS pH 7.4 was constantly stirred by magnetic stirrer at 100 rpm and was maintained at a temperature of 37 ± 1°C throughout the experiments. Formulations (500 μl) were applied homogenously in the donor compartments; samples were withdrawn from receiver at predetermined time intervals over 24 hours and immediately replenished with an equal volume of fresh PBS. Samples were assayed for drug content spectrophotometrically at 327 nm. Sink condition was maintained throughout the experiments.[12,17]
In vitro permeation through porcine ear skin
The skin permeation studies were carried out through full-thickness porcine ear skin (procured from local abattoir; used within 24 h) using Franz diffusion cells with effective permeation area and receptor cell volume 3.14 cm2 and 15 ml, respectively. The receptor fluid was PBS pH 7.4 and was maintained at a temperature 37 ± 1°C and was constantly stirred by magnetic stirrer at 100 rpm. Then, the skin was mounted in between receptor and donor compartments with the stratum corneum side facing upward into the donor compartment. Different formulations (500 μl) were applied uniformly on the skin in donor compartment; aliquots were collected from receiver at various time periods for 24 hours and were immediately replaced with equal volume of fresh diffusion buffer. Aliquots were assayed for drug content spectrophotometrically at 327 nm.[17]
From in vitro skin permeation data, various skin permeation parameters like steady-state transdermal flux (Jss), Lag time (TL), permeability coefficient (Kp), diffusion coefficient (D), and enhancement ratio (ER) were calculated. The cumulative amount of CS permeated per unit area of porcine ear skin was plotted as a function of time. Steady-state flux (Jss) and lag time were calculated from the slope and X-intercept of the linear portion, respectively. Enhancement ratio (ER) was calculated by dividing the transdermal steady-state flux (Jss) of optimized ethosomal system to that of control formulation.[18,19]
Permeability coefficient (Kp) was calculated from the transdermal steady-state flux (Jss) and initial concentration of CS in the donor compartment (Coπ)using the equation:
Diffusion coefficient (D) was calculated from the following equation:
Where D is diffusion coefficient, h is the thickness of the skin, and TL is the lag time.[20]
In vitro skin deposition studies
The amount of CS retained in the porcine ear skin was determined at the end of each in vitro permeation experiment (24 hours) with a procedure reported previously.[21] The skin was removed from Franz diffusion cell and washed for 5 times with hot (40 ± 2°C) PBS pH 7.4 and remounted in Franz diffusion cell and kept for another 12 hours at temperature 37 ± 1°C. The receptor content was 50% v/v ethanolic solution in PBS pH 7.4 and was constantly stirred with magnetic stirrer at 100 rpm. Drug content in the receptor fluid was then analyzed spectrophotometrically at 327 nm.
Drug-excipient interaction studies by FTIR
To investigate any possible interaction between the drug and the vesicle membrane component (Soya PC), IR spectral studies of pure drug and its physical mixture with soya PC were carried out by using Shimadzu IR-Affinity-1 FTIR spectrophotometer (Shimadzu, Japan). Interaction between drug and excipient, if any, was indicated either by presence of additional peaks or by absence of characteristic peaks in the IR spectrum of physical mixture that corresponding to the drug.
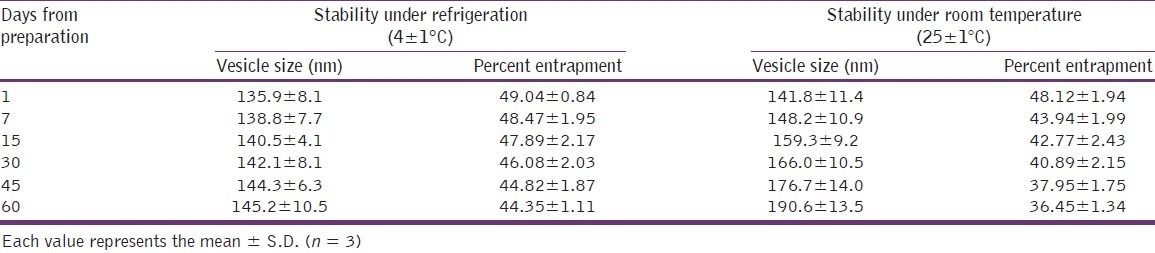
Stability studies
The stability of CS ethosomal vesicles was determined by assessing entrapment capacity and vesicle size over time at 2 different temperature conditions, at 4 ± 1°C (Refrigeration, RF) and at 25 ± 1°C (Room temperature, RT), for a period of 60 days.[17,22] Entrapment capacity and mean vesicle size were determined by ultracentrifugation method and DLS technique, respectively, with the procedure described earlier.
Skin histological examinations
Histological examination of porcine ear skin treated with optimized CS ethosomal formulation (24 h) were done following routine fixation with 10% buffered formalin solution, ethanol dehydration, paraffin block processing, and staining with hematoxylin and eosin.[17] Porcine ear skin samples treated with water (24 h) was used as control. Microscopic examinations were done using a light microscope at magnification 100×.
Release kinetic modeling
Goodness-of-fit-model-dependent approach was followed where the release and permeation profile of optimized ethosomal formulations from in vitro drug release and skin permeation studies were fitted to different kinetic models such as Zero order, First order, and Higuchi. Regression analysis was performed. Various plots were made with Qt vs. t for zero order, log Qt vs. t for first order, and Qt vs. square root of t for Higuchi's models. Where Qt is the amount of CS released at time t.[23–25]
Statistical analysis
Statistical significance of obtained results was determined employing t-test and analysis of variance (ANOVA) using Graph Pad PRISM software with P < 0.05 as a minimal level of significance.[26]
Results and Discussion
Characterization of vesicular systems
CS vesicular formulations were characterized for vesicle shape, size, and size distribution, zeta potential and entrapment efficiency. In SEM image analysis, nano-sized (150-200 nm) spherical or near-spherical-shaped lipidic vesicular structures are clearly observed [Figure 1]. The mean vesicle size and polydispersity index (PDI) of different vesicular formulations were determined by DLS method and are presented in Table 1. Size of empty ethosomes (Et-F1) was found to be 216.9 ± 11.1 nm, whereas CS-loaded ethosomes (Et-F4; contain same concentration of ethanol as in empty ethosomes) showed significantly lower (P < 0.05) vesicle size of 178.1 ± 10.0 nm. Similarly, in case of liposomes, in the absence of CS, had an average vesicle diameter of about 539.8 ± 22.2 nm, which was reduced to 449.3 ± 27.3 nm (P < 0.05) in the presence of CS. In both cases, a significant reduction in vesicle size was observed by the addition of 1% w/v CS, indicating that the presence of drug was a major determinant of vesicle size of CS vesicular systems. Similar pattern was reported previously by Touitou et al. who demonstrated reduction in vesicle size after an addition of trihexyphenidyl hydrochloride in ethosomes.[13] The vesicular size of the CS ethosomes decreased significantly (P < 0.05) with an increase in proportion of ethanol in CS ethosome formulations. Largest vesicles were observed in formulation Et-F2 containing 25% v/v ethanol (206.9 ± 9.7 nm) and smallest in formulation Et-F6 containing 45% v/v ethanol (133.8 ± 7.5 nm). DLS studies also showed significant differences in vesicle size between CS ethosomes and liposomes (P> 0.01). CS liposomes (Lp-F2), prepared by cast film method, showed significantly higher vesicles size (449.3 ± 27.3 nm) than CS ethosomes (Et-F2 – Et-F6, 206.9 ± 9.7 to 133.8 ± 7.5 nm). In accordance with other authors, this decrease in vesicles size is due to the presence of high concentration of ethanol in ethosomal formulations. Ethanol significantly reduces vesicle membrane thickness, probably as a result of interpenetration of hydrocarbon chain (ethanol) in the vesicular lipid bilayers. Furthermore, ethanol imparts a net negative charge to the ethosomal system and confers it some degree of steric stabilization that may finally lead to a reduction in vesicular size.[25,26] Regarding polydispersity index (PDI), all vesicular formulae were of low values (PDI < 0.2), indicating that all of them were highly homogenous dispersions.
Figure 1.
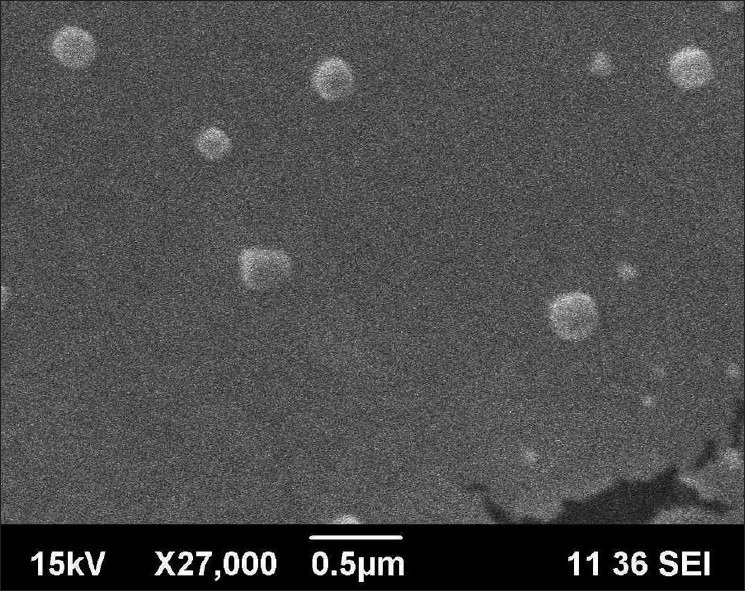
Visualization of ethosomes in CS-loaded ethosome dispersions (Et-F6) by scanning electron microscopy, magnification 27, 000×, 15 kV
In terms of ζ-potential, as shown in Table 1, all the CS ethosomes exhibited high ζ-potential values (ζ > -40 mV, Table 1). On comparison with CS ethosomes (-61.6 ± 2.1 to -71.16 ± 1.6 mV), CS liposomes (contain no ethanol) showed significantly lower (P < 0.01) but still a higher ζ-potential value (-48.62 ± 2.0 mV, Table 1). A high ζ-potential (> -30 mV) is beneficial to vesicles physical stability as it prevents aggregation between vesicles owing to electrostatic repulsion.[12] A significant difference in ζ-potential was observed between empty and drug-loaded ethosomes. While empty ethosomes (Et-F1) showed a ζ-potential of -9.11 ± 1.5 mV, incorporation of drug (1% w/v) to ethosome vesicles (Et-F4, contain same concentration of ethanol as in empty ethosomes) substantially increased (P < 0.01) the ζ-potential (-63.42 ± 1.3 mV). A similar pattern was also observed with liposomes where the ζ-potential was shifted from 2.37 ± 2.2 mV (empty liposomes) to -48.62 ± 2.0 mV (CS liposomes, P < 0.01). From the above results, it was clear that both the presence of ethanol and drug were decisive factors, which determine the surface charge of the CS vesicles.
Entrapment efficiency of the ethosomes was found to have increased with increasing ethanol concentration (25-45% v/v, Table 1). Among different CS ethosomal systems, formulation Et-F6 containing 45% v/v ethanol showed the highest EE of 49.88± 1.84%, and the value was found significantly higher (P <</i> 0.01) than that of liposomes (30.19 ± 2.30%), probably due to the greater retentivity of CS in ethanol present in ethosomal core.
The vesicle size and entrapment efficiency of vesicular carrier are the parameters mostly influence the permeation of entrapped drug through skin. For this reason, formulation Et-F6 (45% v/v ethanol), which is characterized by optimum vesicle size (133.8 ± 7.5 nm) and high entrapment efficiency (49.88 ± 1.84%), was considered to be an optimal formulation and carried forward for in vitro drug release, in vitro skin permeation, and deposition studies. A comparison study of optimized ethosomal formulae with 3 different control formulations, namely conventional liposomes (3% w/w soya PC; 1% w/v CS), hydroethanolic solutions (45% v/v ethanol in distilled water) of drug (1% w/v CS), and phosphate buffer saline (PBS) pH 7.4 drug solutions (1% w/v CS) were performed.
In vitro drug release through cellophane membrane
A comparative release profile of ethosomes (Et-F6), liposomes (Lp-F2), hydroethanolic (HES), and PBS pH 7.4 drug solutions are illustrated in Figure 2. For in vitro drug release studies, prior to the experiment, the unentrapped drugs in vesicular formulations were removed by centrifugation and sediment was re-dispersed in respective medium. Cellophane membrane having MW cut-off range 12,000-14,000 was used that only allows the diffusion of drug in solution form while it withholds lipid vesicles. Therefore, to diffuse the entrapped drug through cellophane membrane, first it should release from the vesicles to surrounding medium. In our study, from hydroethanolic (45% v/v) and PBS pH 7.4 drug solutions, almost 100% of drug was released within 8 and 10 hours, respectively while significantly less amount of drug was released from ethosomal (51.04 ± 6.26%, 24 h, P < 0.01) and liposomal formulations (29.24 ± 2.01%, 24 h, P < 0.01), indicating that diffusion of CS from vesicles to the surrounding medium is the rate- determining step in the release of drug through the cellophane membrane. On the other hand, release of CS from ethosomal formulation was significantly (P < 0.01) higher than that of liposomes, probably as a result of increased fluidity of ethosomal vesicle bilayers at higher ethanol concentrations, which result in an increase in the vesicle membrane permeability. From the kinetic modeling data, release from ethosomal formulation (Et6) found to follow higuchi kinetics (R2 -0.9993, graph not shown). From the above results, it can be concluded that the ethosomal and liposomal formulations provides a controlled and sustained delivery of drug through cellophane membrane compared to hydroethanolic and PBS pH 7.4 drug solutions, where, the lipid vesicles acts as a reservoir of drug and provides a continuous delivery of drug.
Figure 2.
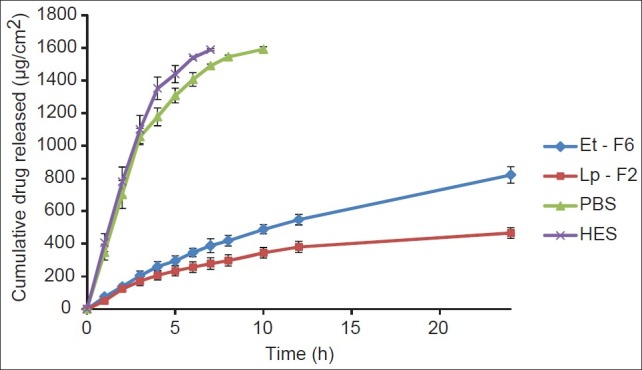
Release profile of CS from ethosomal (Et-F6) and control systems across cellophane membrane (24 h), each time point represents mean±SD (n = 3)
In vitro permeation through porcine ear skin
A comparative permeation profile of ethosomes (Et-F6), liposomes (Lp-F2), hydroethanolic (HES), and PBS (pH 7.4) drug solutions are illustrated in Figure 3. Various skin permeation parameters of CS calculated from the skin permeation data are given in Table 2. As can be seen in Figure 3, in comparison to other control formulations, a dramatic increase in permeation through porcine ear skin from ethosome formulation was observed. The optimized ethosomal formulation showed significantly enhanced (P < 0.01) transdermal flux (18.49± 0.08 mg/cm 2 /h) across porcine ear skin as compared to liposome (1.80± 0.12 mg/cm 2 /h), hydroethanolic drug solution (4.45 ± 0.71 mg/cm2/h), and PBS pH 7.4 drug solution (1.18 ± 0.35 mg/cm2/h). Additionally, ethosomal formulation showed a shortest lag time for CS (0.11 ± 0.09 h), whereas liposomes (0.65 ± 0.03 h), hydroethanolic (0.42 ± 0.26 h), and PBS (0.73 ± 0.20 h) drug solutions showed significantly longer (P < 0.01) lag time, and this was probably as a result of rapid distribution of CS from ethosomal formulation to the stratum corneum and epidermal layers. From the kinetic modeling and skin permeation profile data, it was clear that the ethosomal formulation were found to release the drug in accordance to zero order kinetics (R2 -0.9995, graph not shown). The release rate and kinetics of permeation through skin (zero order) shown by CS ethosomes was different from through cellophane membrane (higuchi), and this may be explained by the fact that skin has complex architecture and release profile of drugs from delivery system through skin cannot be exactly matched with artificial membranes.[22]
Figure 3.
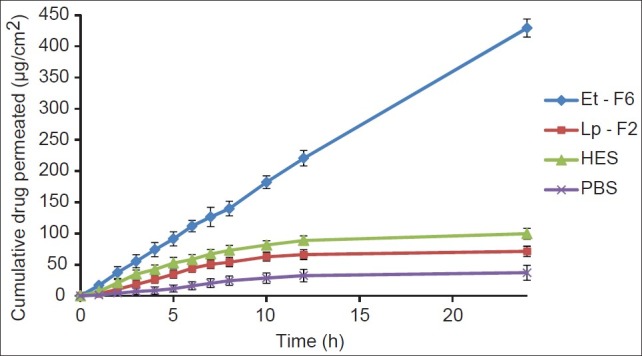
Permeation profile of CS from ethosomal (Et-F6) and control systems across porcine ear skin (24 h), each time point represents mean±SD (n = 3)
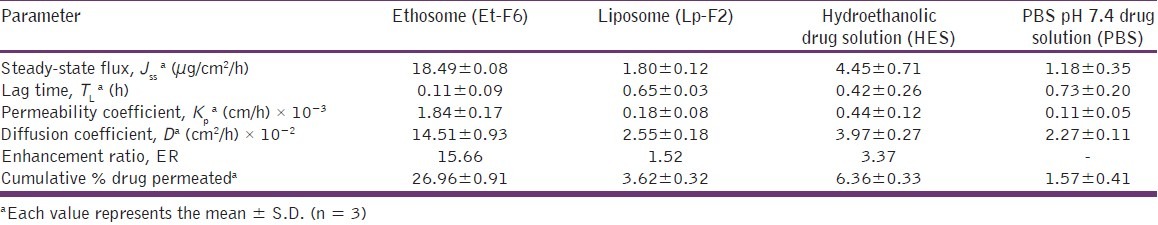
Table 2.
Skin permeation parameters of CS from ethosomal and control systems through porcine ear skin, 24 h
In our study, the permeation enhancement observed for all ethosome-based formulations was much greater than that could be expected from ethanol alone or from liposomes. These findings, as previously reported,[13] may be due to a synergistic mechanism between ethanol, phospholipid vesicles, and skin lipids. Ethanol, as a penetration enhancer, disturbs extracts and fluidizes the SC lipids result in an increase in the membrane permeability. On the other hand, ethanol interacts with lipid vesicles, increases lipid fluidity, and makes the vesicles flexible in nature. The flexible vesicles squeeze themselves intact through the disturbed SC to the deeper layers of skin and consequent release of the drug by the fusion of ethosomal vesicles with skin lipids.[24,25]
In vitro skin deposition
The amount of drug retained in the skin from ethosomal formulation and control formulations at the end of 24 h permeation studies are depicted in Figure 4. CS skin deposition from ethosomal formulation (10.28±0.67%) was much higher (P < 0.05) than from liposomes (4.32 ± 0.35%, 2.37 times), hydroethanolic (6.77 ± 0.14%, 1.51 times), and PBS (0.97 ± 0.17%, 10.60 times) drug solutions, probably due to the combined effect of phospholipid and ethanol on skin and thus providing a mode for sustained delivery of drug for a greater period of time.[22]
Figure 4.
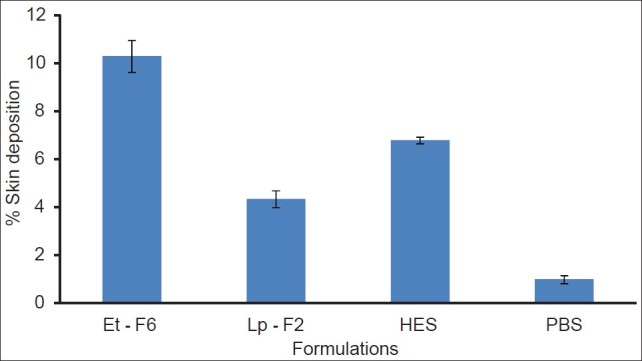
Deposition of CS in porcine ear skin following application (24 h) of ethosomal and control systems, each histogram represents mean±SD (n = 3)
Drug-excipient interaction studies by FTIR
As can be seen in Figures 5a and b, no significant changes in IR spectral pattern of physical mixture, that corresponding to the drug, was observed, indicating the absence of any interaction between drug and vesicle membrane component.
Figure 5.

FT-IR spectra of (a) pure cromolyn sodium (CS); (b) physical mixture of cromolyn sodium (CS) and soya PC
Stability studies
Results of stability studies are shown in Table 3. In case of ethosomal dispersion that was stored in room temperature (25 ± 1°C), showed a significant increase in vesicle size (around 26%, P < 0.01), whereas at refrigerated condition (4 ± 1°C), an insignificant increase in vesicle size was observed. The observed increase in vesicle size at room temperature is thought to be due to aggregation of vesicles. When comparing the entrapment efficiency, at room temperature, there was a significant leakage (about 12%, P < 0.01) of CS from vesicle was observed, and at refrigerated condition, no significant leakage was observed. The observed leakage at room temperature was possibly due to chemical degradation of the phospholipids at higher temperatures, leading to defects in the membrane packing and hence less drug retention at elevated temperatures.[24] Results revealed that higher temperatures have some detrimental effect on ethosomal vesicles; therefore, for better physical and chemical stability, the formulation should be stored under refrigerated conditions (4 ± 1°C).
Table 3.
Stability studies of cromolyn sodium ethosomal dispersion (Et-F6)
Skin histological examinations
Histological examination of treated (formulation Et-F6, 24 h) and control (PBS pH 7.4 treated, 24 h) skin was performed using light microscopy to investigate changes in skin morphologies. Micrographs of control and treated samples demonstrated similar skin layers as shown in Figures 6a and b. The photomicrographs of PBS pH 7.4-treated porcine skins (control) showed normal skin with uniformly-layered SC, well-defined epidermal and dermal layers. In contrast to this, definite changes were observed in the skin morphology of 24 h ethosome-treated skin samples. The treated section showed a clear disruption of SC organization, confirming the penetration enhancing capacity of these vesicular carriers. Also, thickness and appearance of the SC were found to be changed in comparison to the control porcine skin. Some area of the ethosome-treated skin had intercellular vacuoles, loose voids, and empty spaces in the epidermal region. No apparent changes in dermis region were observed.
Figure 6.
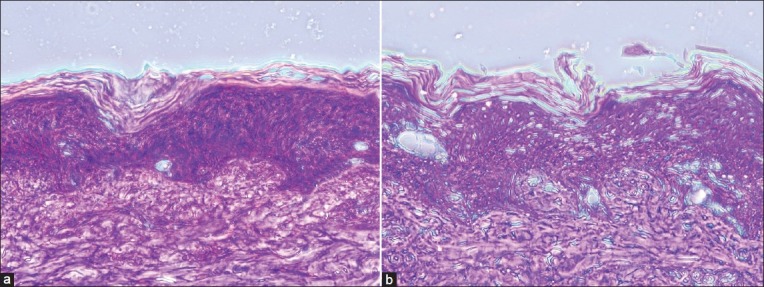
(a) Light microscopic photographs (100×) of porcine ear skin sections treated with PBS (pH 7.4) for 24 h. (b): treated with CS ethosomal system (Et-F6) for 24 h, hematoxylin-eosin staining
Conclusion
In our study, cromolyn sodium entrapped ethanolic liposomes was successfully prepared and were showed reasonable entrapment efficiency, optimum vesicle size, and better stability. In vitro drug release studies through cellophane membrane showed sustained delivery of cromolyn sodium from ethosomal formulation. Ethosomes substantially enhanced the skin permeation of cromolyn sodium in vitro through porcine ear skin and also showed better skin accumulation of drug when compared to liposomes, hydroethanolic, and PBS drug solutions. In light of above findings, it can be a logical conclusion that ethosomal system can be a promising drug carrier for transdermal delivery of cromolyn sodium.
Acknowledgments
The authors are grateful to the Amrita Centre for Nanosciences and Molecular Medicine (ACNSMM), Amrita Institute of Medical Sciences and Research Centre, Amrita Vishwa Vidyapeetham University, Kochi, Kerala, India for providing DLS and SEM facilities. Authors are also grateful to the Deep Care Health Pvt. Ltd., Ahmadabad, Gujarat, India for their generous supply of cromolyn sodium.
Footnotes
Source of Support: Nil,
Conflict of Interest: None declared
References
- 1.Deshmukh DD, Ravis WR, Betageri GV. Improved delivery of cromolyn from oral proliposomal beads. Int J Pharm. 2008;358:128–36. doi: 10.1016/j.ijpharm.2008.02.026. [DOI] [PubMed] [Google Scholar]
- 2.Nagarsenker MS, Londhe VY. Preparation and evaluation of a liposomal formulation of sodium cromoglicate. Int J Pharm. 2003;251:49–56. doi: 10.1016/s0378-5173(02)00583-5. [DOI] [PubMed] [Google Scholar]
- 3.Srivastava V, Viswanathaswamy AH, Mohan G. Determination of antiulcer properties of sodium cromoglycate in pylorus-ligated albino rats. Indian J Pharmacol. 2010;42:185–8. doi: 10.4103/0253-7613.66844. [DOI] [PMC free article] [PubMed] [Google Scholar]
- 4.Moore C, Ehlayel MS, Junprasert J, Sorensen RU. Topical sodium cromoglycate in the treatment of moderate-to-severe atopic dermatitis. Ann Allergy Asthma Immunol. 1998;81:452–8. doi: 10.1016/S1081-1206(10)63145-6. [DOI] [PubMed] [Google Scholar]
- 5.Touitou E, Dayan N, Bergelson L, Levi-Schaffer F, Piliponsky A. Novel lipid vesicular system for enhanced delivery. J Liposome Res. 1998;8:113–4. [Google Scholar]
- 6.Horwitz E, Pisanty S, Czerninski R, Helser M, Eliav E, Touitou E. A clinical evaluation of a novel carrier for acyclovir in the topical treatment of recurrent herpes labialis. Oral Surg Oral Med Oral Pathol Oral Radiol Endod. 1999;87:700–5. doi: 10.1016/s1079-2104(99)70164-2. [DOI] [PubMed] [Google Scholar]
- 7.Touitou E, Alkabes M, Dayan N, Eliaz M. Ethosomes: Novel vesicular carriers for enhanced skin delivery. Pharm Res. 1997;14:S305. doi: 10.1016/s0168-3659(99)00222-9. [DOI] [PubMed] [Google Scholar]
- 8.Elsayed MM, Abdallah OY, Naggar VF, Khalafallah NM. Deformable liposomes and ethosomes: Mechanism of enhanced skin delivery. Int J Pharm. 2006;322:60–6. doi: 10.1016/j.ijpharm.2006.05.027. [DOI] [PubMed] [Google Scholar]
- 9.Touitou E, Godin B, Weiss C. Enhanced delivery of drug into and across the skin by ethosomal carrier. Drug Deliv Research. 2000;50:406–15. [Google Scholar]
- 10.Bendas ER, Tadros MI. Enhanced transdermal delivery of salbutamol sulfate via ethosomes. AAPS Pharm Sci Tech. 2007;8:E107. doi: 10.1208/pt0804107. [DOI] [PMC free article] [PubMed] [Google Scholar]
- 11.López-Pinto JM, González-Rodríguez ML, Rabasco AM. Effect of cholesterol and ethanol on dermal delivery from DPPC liposomes. Int J Pharm. 2005;298:1–12. doi: 10.1016/j.ijpharm.2005.02.021. [DOI] [PubMed] [Google Scholar]
- 12.Dubey V, Mishra D, Dutta T, Nahar M, Saraf DK, Jain NK. Dermal and transdermal delivery of an anti-psoriatic agent via ethanolic liposomes. J Control Release. 2007;123:148–54. doi: 10.1016/j.jconrel.2007.08.005. [DOI] [PubMed] [Google Scholar]
- 13.Dayan N, Touitou E. Carriers for skin delivery of trihexyphenidyl HCl: Ethosomes vs.liposomes. Biomaterials. 2000;21:1879–85. doi: 10.1016/s0142-9612(00)00063-6. [DOI] [PubMed] [Google Scholar]
- 14.Mishra D, Mishra PK, Dubey V, Nahar M, Dabadghao S, Jain NK. Systemic and mucosal immune response induced by transcutaneous immunization using Hepatitis B surface antigen-loaded modified liposomes. Eur J Pharm Sci. 2008;33:424–33. doi: 10.1016/j.ejps.2008.01.015. [DOI] [PubMed] [Google Scholar]
- 15.Paolino D, Lucania G, Mardente D, Alhaique F, Fresta M. Ethosome for skin delivery of ammonium glycyrrhizinate: In-vitro percutaneous permeation through human skin and in-vivo anti inflammatory activity on human volunteers. J Control Release. 2005;106:99–110. doi: 10.1016/j.jconrel.2005.04.007. [DOI] [PubMed] [Google Scholar]
- 16.Jain S, Umamaheshwari RB, Bhadra D, Jain NK. Ethosomes. Novel vesicular carrier for enhanced Transdermal delivery of an anti-HIV agent. Indian J Pharm Sci. 2004;66:72–81. [Google Scholar]
- 17.Shumilov M, Touitou E. Buspirone transdermal administration for menopausal syndromes, in vitro and in animal model studies. Int J Pharm. 2010;387:26–33. doi: 10.1016/j.ijpharm.2009.11.029. [DOI] [PubMed] [Google Scholar]
- 18.Touitou E, Dayan N, Bergelson L, Godin B, Eliaz M. Ethosomes - novel vesicular carriers for enhanced delivery: Characterization and skin penetration properties. J Control Release. 2000;65:403–18. doi: 10.1016/s0168-3659(99)00222-9. [DOI] [PubMed] [Google Scholar]
- 19.Chen M, Liu X, Fahr A. Skin penetration and deposition of carboxyfluorescein and temoporfin from different lipid vesicular systems: In vitro study with finite and infinite dosage application. Int J Pharm. 2011;408:223–34. doi: 10.1016/j.ijpharm.2011.02.006. [DOI] [PubMed] [Google Scholar]
- 20.Jain S, Tiwary AK, Sapra B, Jain NK. Formulation and evaluation of ethosomes for transdermal delivery of lamivudine. AAPS Pharma Sci Tech. 2007;8:E111. doi: 10.1208/pt0804111. [DOI] [PMC free article] [PubMed] [Google Scholar]
- 21.Dash S, Murthy PN, Nath L, Chowdhury P. Kinetic modelling on drug release from controlled drug delivery systems. Acta Pol Pharm. 2010;67:217–23. [PubMed] [Google Scholar]
- 22.Rong H, Da-xiang C, Feng G. Preparation of fluorescence ethosomes based on quantum dots and their skin scar penetration properties. Mater Lett. 2009;63:1662–4. [Google Scholar]
- 23.Dubey V, Mishra D, Nahar M, Jain V, Jain NK. Enhanced transdermal delivery of an anti-HIV agent via ethanolic liposomes. Nanomedicine: Nanomedicine. 2010;6:590–6. doi: 10.1016/j.nano.2010.01.002. [DOI] [PubMed] [Google Scholar]
- 24.Touitou E, Godin B, Dayan N, Piliponsky A, Levi-Schaffer F, Weiss C. Intracellular delivery mediated by an ethosomal carrier. Biomaterials. 2001;22:3053–9. doi: 10.1016/s0142-9612(01)00052-7. [DOI] [PubMed] [Google Scholar]
- 25.Godin B, Touitou E. Mechanism of bacitracin permeation enhancement through the skin and cellular membrane from an ethosomal carrier. J Control Release. 2004;94:365–79. doi: 10.1016/j.jconrel.2003.10.014. [DOI] [PubMed] [Google Scholar]
- 26.Gallily R, Touitou E, Lodzki M, Godin B, Rakou L, Mechoulam R. Cannabidiol-transdermal delivery and anti-inflammatory effect in a murine model. J Control Release. 2003;93:377–87. doi: 10.1016/j.jconrel.2003.09.001. [DOI] [PubMed] [Google Scholar]