

Abstract
The goal of this project is to improve the quantification of indoor fungal pollutants via the specific application of quantitative PCR (qPCR). Improvement will be made in the controls used in current qPCR applications. This work focuses on the use of two separate controls within a standard qPCR reaction. The first control developed was the internal standard control gene, benA. This gene encodes for β-tubulin and was selected based on its single-copy nature. The second control developed was the standard control plasmid, which contained a fragment of the ribosomal RNA (rRNA) gene and produced a specific PCR product. The results confirm the multicopy nature of the rRNA region in several filamentous fungi and show that we can quantify fungi of unknown genome size over a range of spore extractions by inclusion of these two standard controls. Advances in qPCR have led to extremely sensitive and quantitative methods for single-copy genes; however, it has not been well established that the rRNA can be used to quantitate fungal contamination. We report on the use of qPCR, combined with two controls, to identify and quantify indoor fungal contaminants with a greater degree of confidence than has been achieved previously. Advances in indoor environmental health have demonstrated that contamination of the built environment by the filamentous fungi has adverse impacts on the health of building occupants. This study meets the need for more accurate and reliable methods for fungal identification and quantitation in the indoor environment.
Keywords: qPCR, indoor environment, health, biocontaminants
INTRODUCTION
Improved methods of fungal identification and quantification are needed to gain a better understanding of fungal impacts in the indoor environment. This manuscript details the development of two internal controls for use in molecular applications used to quantify indoor fungal pollutants. In North America, it is estimated that people spend between 80% and 90% of their time in the indoor environment.1,2 Thus, the importance of a healthy indoor environment has become increasingly significant in recent years. The predominant indoor allergens are from mites, cats, and dogs.3 However, the indoor environment also contains a wide range of microorganisms, including bacteria and filamentous fungi.4–6 Of these biological contaminants, the filamentous fungi (mold) are now recognized as key contributors to an unhealthy built environment, with up to 40% of North American and Northern European homes containing mold infestation.7,8
The filamentous fungi found in the indoor environment can produce microbial volatile organic compounds, allergenic proteins, and mycotoxins,9–13 each contributing to adverse health effects, including itchy eyes, stuffy nose, headache, and general fatigue.12,14–19 As such, the use of the phrase “sick building syndrome” is being applied more frequently when the possible cause is fungal contamination.20
Laboratory confirmation and quantitation of mold in the built environment typically include microscopy, morphology, and colony counting.21–23 These methods of analysis are not only time-consuming, but they also frequently misidentify organisms and lead to an understatement of the diversity of the indoor fungal community.24 These concerns have led to the rapid development of molecular technologies that are capable of unambiguous identification, as well as quantification of fungal contamination. At the forefront of these molecular tools is the qPCR. A favorite target for designing a qPCR assay is the repetitive and highly conserved nuclear rRNA region of fungi.25–30 Recent advances in qPCR have led to extremely sensitive and quantitative methods for single-copy genes; however, it has not been well-established that the rRNA can be used to quantitate fungal contamination. The adherent problem when using this region for qPCR is that its multicopy nature is not defined and has been shown to number in the tens to hundreds for a few of the now fully sequenced fungi.31,32
MATERIALS AND METHODS
Filamentous Fungi, Spore Preparations, and DNA Isolation
The test organisms selected for this project were in-house field isolates Alternaria alternata, Aspergillus fumigatus, Aspergillus versicolor, Cladosporium cladosporoides, Stachybotrys chartarum 5108, S. chartarum 5111, S. chartarum 6307, and S. chartarum Hous, cultured for 14–21 days at room temperature under incandescent lights. Spores were collected, and DNA was extracted using a method described previously .33
Cloning of C. cladosporoides Insert
To estimate the rRNA gene copy number in filamentous fungi, an internal fragment of this gene was cloned. Enzyme restriction and PCR amplification of the rRNA region of C. cladosporoides (Accession AJ244241) produced a 450-bp product that was ligated into a pGEM-T Easy vector (Promega, Madison, WI, USA) and transformed into Escherichia coli strain DH5α. Bacteria were taken up in 800 μL LB broth medium and allowed to incubate for 45 min at 37°C and 225 rpm. After incubation, bacteria were plated onto agar plates containing ampicillin (100 μg/mL), 5-bromo-4-chloro-3-indolyl-β-d-galactoside (20 μg/cm2), and IPTG (12.1 μg/cm2) and incubated overnight at 37°C. White colonies were selected and the inserted gene fragment confirmed by PCR using Cladc F1/R1 primers (Table 1). Recombinant plasmid DNA was purified using an UltraClean 6 Minute Mini Plasmid Prep Kit (MO BIO Laboratories, Carlsbad, CA, USA). After purification, plasmid DNA concentration was determined using a Quant-iT dsDNA high-sensitivity assay kit and Qubit fluorometer (Invitrogen, Eugene, OR, USA). We determined that the plasmid (p57) contained a single-copy insert by agarose gel electrophoresis (data not shown). The copy number was adjusted to 107 in Tris-HCl buffer.
TABLE 1.
Real-Time PCR Primers Used in This Study
| Organism | Primer | Sequence (5′→3′) | Tm (°C) | Amplicon (bp) | Set point (°C) |
|---|---|---|---|---|---|
| PCR insert | |||||
| C. cladosporoides | Sense | ATC ATT ACA AGT GAC CCC GGC | 60 | 450 | 60 |
| Antisense | TTT ACG GCG TAG CCT CCC | 58 | |||
| rRNA | |||||
| A. alternata | Sense | CGA ATC TTT GAA CGC ACA TTG | 57 | 163 | 57 |
| Antisense | CGC TCC GAA ACC AG TAG G | 58 | |||
| A. fumigatus | Sense | CTG TCC GAG CGT CAT TGC | 58 | 140 | 57 |
| Antisense | TAC AGA GCA GGT GAC AAA GC | 58 | |||
| A. versicolor | Sense | GCG AAC TGC GAT AAG TAA TGT | 57 | 111 | 57 |
| Antisense | GCA ATG ACG CTC GGA CAG | 58 | |||
| C. cladosporoides | Sense | GCG TCA TTT CAC CAC TCA AG | 58 | 128 | 57 |
| Antisense | CTC CCG AAC ACC CTT TAG | 56 | |||
| Penicillium chrysogenum | Sense | CTG TCC GAG CGT CAT TGC | 58 | 137 | 57 |
| Antisense | CAG AGC GGG TGA CAA AGC | 58 | |||
| S. chartarum | Sense | GAG TAG TTT GGG AAT GCT GC | 58 | 174 | 57 |
| Antisense | GCC CAA GTC TGG TCA TAA AC | 58 | |||
| β-Tubulin | |||||
| A. alternata | Sense | GCG AAC AAC AGA GAA CAA CAG | 54 | 143 | 55 |
| Antisense | AAA GGC AGC ACC GAT TTG G | 56 | |||
| A. fumigatus | Sense | GCT GGA GCG TAT GAA CGT C | 56 | 165 | 55 |
| Antisense | GAC AGC GTC CAT GGT ACC | 55 | |||
| A. versicolor | Sense | GCG AAC TGC GAT AAG TAA TGT | 55 | 108 | 55 |
| Antisense | GCA ATG ACG CTC GGA CAG | 56 | |||
| C. cladosporoides | Sense | GCA TAC ACC GAT TGA CAA C GCC | 55 | 121 | 55 |
| Antisense | TTG GGA GTT CAT ACC | 56 | |||
| P. chrysogenum | Sense | CGA TGG CGA TGG ACA GTA AG | 55 | 131 | 55 |
| Antisense | ACT CAC ATG GTT GAA GTA GAC G | 55 | |||
| S. chartarum | Sense | ACC TCT CGG CTC ACA ATT TC | 55 | 165 | 55 |
| Antisense | TTG TTG CCA GCA CCA GAC | 56 |
Tm, Temperature.
Real-Time PCR
Primers used for this study are presented in Table 1. They were synthesized and High Purity Salt Free (HPSF)-purified by MWG-Biotech AG, VWR International (Bridgeport, NJ, USA). qPCR reactions were performed in triplicate and comprised genomic DNA, combined forward and reverse primers (1.2 μM), iQ SYBR Green Supermix (Bio-Rad Laboratories, Hercules, CA, USA), and water to 25 μL. The reactions were placed in a Bio-Rad iCycler (Bio-Rad Laboratories). The iCycler was programmed to run on gradient function with annealing temperatures of 60°C, 57°C, and 55°C for each primer set (Table 1). Samples were denatured at 95°C for 4 min, followed by 40 cycles of 95°C (10 s), annealed (10 s), and 72°C (10 s). The relative concentration of the amplified DNA was calculated using the comparative quantification feature in the iCycler software package against the relative fluorescence signal.
RESULTS
The coding sequences were obtained for each gene after an exhaustive search of the PubMed database. In all cases, multiple sequences for each gene were selected and aligned as to design internal oligonucleotide primers for the applications in the qPCR as described in Materials and Methods. Each qPCR assay was first optimized for each primer set by varying primer and PCR reagent concentrations to obtain peak efficiencies (data not shown). The specificity of each primer set to amplify the target was confirmed by melt curve analysis.
Real-time PCR analysis of the p57 standard control plasmid produced specific PCR products that were amplified using primer set Cc insert (Fig. 1) The tenfold serial difference in template concentrations was used to test the sensitivity of a real-time PCR assay. Plasmid DNA was run in triplicate, and comparative threshold (Ct) values ranged from 10 (106 copies) to 34 (100 copies). The Ct values obtained between each log dilution were between three and four in almost all cases. Overall, the curve generated from the p57 qPCR proved to be nearly linear with a correlation coefficient (r) of 0.996. Based on these results, we believed that p57 could be used to determine the absolute copy number of the rRNA region in filamentous fungi. However, as we do not know the size of the genome for each of the fungi used in this study, and we did not know the efficiency of the genomic DNA extraction from a spore, we also included a genomic internal standard control.
FIGURE 1.

Real-time PCR of p57 internal standard. Copy number profile of the p57 plasmid containing the 450-bp C. cladosporoides (Cc) insert was determined by qPCR. The first curve set is 106, tenfold serially diluted to 100. The copy number was determined by mass, and correlation coefficient of the curve is 0.996 (experiment was run in triplicate).
The genomic internal standard control gene, benA, was selected based on its single-copy nature and encodes for β-tubulin. When we conducted qPCR on genomic preparations, we found that the rRNA gene was, in all cases, at least 2 log higher in copy number than the benA gene (Fig. 2).
FIGURE 2.
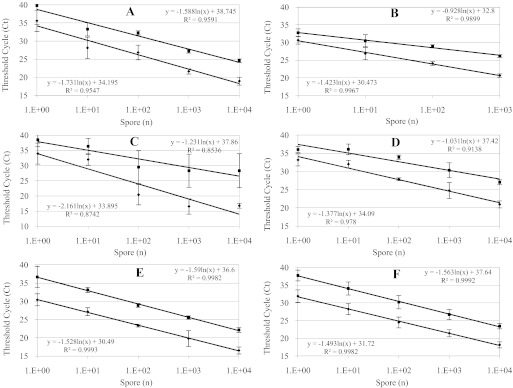
Real-time qPCR results of Ct versus number of spores (n) from which the template gDNA was extracted. A. alternaria (A), A. fumigatus (B), C. cladospooides (C), P. chrysogenum (D), S. chartarum 5108 (E), and S. chartarum 5111 (F). Each plot represents an average of three independent experiments amplifying rRNA (lower curves) and β-tubulin (upper curves). r was calculated for each plot.
The curves demonstrate the relationship of each target region over a 5-log genomic DNA extraction of spores. In general, there was an ∼2-log difference in copy number between the multicopy rRNA and single-copy β-tubulin region, and the results were reproducible. Detection of all fungi was optimal when as few as 104 spores were processed but was also sensitive enough to detect as few as 10 spores in a single preparation. The Ct were similar, and detection began after 15 cycles or so for rRNA and 20 cycles or so for β-tubulin. Linear regression equations with r values >0.95 were obtained in all experiments except for C. cladosporoides (0.85–0.87).
Each Ct value is the result of fluorescence produced by SYBR Green I excitation during the annealing step. Each experiment was done in triplicate, and sem is included. The data indicate that although absolute copy number cannot be predicted from this type of experiment alone, the difference in copy number can be predicted by this qPCR. This is true even when the genome size of the fungi is not known. We observed that there was almost a six Ct difference between the two genes over the range of extractions with the exception of C. cladosporoides. From the data gathered in Fig. 1, we conclude that a Ct value of three to four indicates a 1-log difference. As such, a six Ct is indicative of ten- to 100-fold differences in copy number. The ΔCt remains consistent over the qPCR range but does vary when few copies of the target are analyzed.
In a final experiment, we conducted qPCR using p57 as the standard control curve. The p57 was prepared using mass as the method to determine copy number. In this case, the 3465-bp plasmid is calculated to weigh 3.80E–18 g. Using this as a starting point, we determined the amount of p57 equivalent to 106, 104, 102, and 101 copies for a near-linear curve with an r of 0.997. However, because the genome sizes are unknown, the same calculations cannot be made for the fungi. Based on our previous data, we selected 103 spores for this qPCR analysis. The log concentration of each fungi DNA product was calculated relative to the p57 standard curve using the comparative quantification feature in the iCycler software package against the relative fluorescence signal (Table 2).
TABLE 2.
qPCR and Prediction of Gene Copy Number in Fungi
| Target | Identifier | Quantity | Log-starting quantity | Quantity (calculated) |
|---|---|---|---|---|
| rRNA | A. alternata | 1.00E + 03 | 2.97 | 9.32E + 02 |
| A. fumigatus | 1.00E + 03 | 3.14 | 1.36E + 03 | |
| A. versicolor | 1.00E + 03 | 2.77 | 5.88E + 02 | |
| C. cladosporoides | 1.00E + 03 | 3.40 | 2.50E + 03 | |
| S. chartarum 5108 | 1.00E + 03 | 3.50 | 3.10E + 03 | |
| S. chartarum 5111 | 1.00E + 03 | 3.01 | 1.03E + 03 | |
| S. chartarum 6307 | 1.00E + 03 | 3.75 | 5.66E + 03 | |
| S. chartarum Hous | 1.00E + 03 | 3.38 | 2.38E + 03 | |
| β-Tub | A. alternata | 1.00E + 03 | 1.51 | 3.25E + 01 |
| A. fumigatus | 1.00E + 03 | 1.71 | 5.09E + 01 | |
| A. versicolor | 1.00E + 03 | 1.25 | 1.79E + 01 | |
| C. cladosporoides | 1.00E + 03 | −1.08 | 8.33E − 02 | |
| S. chartarum 5108 | 1.00E + 03 | 1.25 | 1.77E + 01 | |
| S. chartarum 5111 | 1.00E + 03 | 0.92 | 8.31E + 00 | |
| S. chartarum 6307 | 1.00E + 03 | 0.97 | 9.35E + 00 | |
| S. chartarum Hous | 1.00E + 03 | 1.45 | 2.82E + 01 |
Our data indicate that the rRNA multicopy region of 103 fungi has a copy number lower than expected. For example, if the rRNA copy number is 100 or more than the starting quantity of A. alternata, then there should be 1.00E + 05 or more for 103 spores, and the single-copy gene benA should be 1.00E + 03. Here, the copy number is reported as 9.32E + 02 and 3.25E + 01, respectively. Both quantities are ∼2 logs less than expected. In general, this is what was observed for all of the fungi in this study. As the p57 was used as mass, and the standard curve of p57 was nearly linear (r=0.997), we conclude that the extraction of the spores is inefficient. We believe this illustrates the importance of using actual spore quantities for each genomic DNA extraction rather than dilution of a single high-spore preparation.
DISCUSSION
The curves and copy number data produced from our experiments show that qPCR can unequivocally confirm the multicopy nature of the rRNA region in several filamentous fungi over a range of spore extractions. Determination of gene copy number is usually correlated to a known genome size, which in fungi, can vary between 15.8 and 49 Mbp34–45 and an average genome size of 36 Mbp.46 We demonstrate that qPCR can be used for quantitation of these fungi, even when genome size is not known. We accomplished this by inclusion of two standard controls. The first, generated by our laboratory, is a plasmid-containing fungi rRNA that could be quantified by mass as to exact copy number in the qPCR, whereas the second is a single-copy β-tubulin (benA) gene and served as an internal standard of the genomic DNA preparation.
This study also illustrates the difficulty in determining organism copy number by qPCR alone, as has been reported previously for other microbes, including bacteria, yeast, and fungi.47–52 This and these previous studies found between 20% and 50% variation in the detectable target DNA when starting quantity was known. However, these data do not invalidate the approach; they only highlights the necessity for better genomic DNA isolation procedures when dealing with spore and spore-like structures.
As a result of the need for more accurate and reliable methods for fungal identification and quantitation, we set out to generate experimental assay controls that could enhance currently used qPCR methodologies. To that end, we have developed two controls that can be used to better quantify fungal organisms from environmental samples. Additionally, our research has drawn emphasis on the need for more efficient fungal DNA isolation and purification procedures.
Footnotes
The U.S. Environmental Protection Agency, through its Office of Research and Development, funded, managed, and collaborated in the research described here under Assistance Agreement Number CR-82893601 to the Research Triangle Institute, International. It has been subjected to the agency's peer and administrative review and has been approved for publication as an EPA document.
REFERENCES
- 1. Adgate JL, Eberly LE, Stroebel C, Pellizzari ED, Sexton K. Personal, indoor, and outdoor VOC exposures in a probability sample of children. J Expo Anal Environ Epidemiol 2004;14(Suppl 1):S4–S13 [DOI] [PubMed] [Google Scholar]
- 2. Franck U, Herbarth O, Wehner B, Wiedensohler A, Manjarrez M. How do the indoor size distributions of airborne submicron and ultrafine particles in the absence of significant indoor sources depend on outdoor distributions? Indoor Air 2003;13:174–181 [DOI] [PubMed] [Google Scholar]
- 3. Woodcock A, Custovic A. ABC of allergies. Avoiding exposure to indoor allergens. BMJ 1998;316:1075–1078 [DOI] [PMC free article] [PubMed] [Google Scholar]
- 4. Andersson MA, Nikulin M, Koljalg U, et al. Bacteria, molds, and toxins in water-damaged building materials. Appl Environ Microbiol 1997;63:387–393 [DOI] [PMC free article] [PubMed] [Google Scholar]
- 5. Dales RE, Miller D. Residential fungal contamination and health: microbial cohabitants as covariates. Environ Health Perspect 1999;107(Suppl 3):481–483 [DOI] [PMC free article] [PubMed] [Google Scholar]
- 6. Hintikka EL, Nikulin M. Airborne mycotoxins in agricultural and indoor environments. Indoor Air 1998;4:66–70 [Google Scholar]
- 7. Brunekreef B, Dockery DW, Speizer FE, et al. Home dampness and respiratory morbidity in children. Am Rev Respir Dis 1989;140:1363–1367 [DOI] [PubMed] [Google Scholar]
- 8. Fog Nielsen K. Mycotoxin production by indoor molds. Fungal Genet Biol 2003;39:103–117 [DOI] [PubMed] [Google Scholar]
- 9. Black JA, Foarde KK, Menetrez MY. Solvent comparison in the isolation, solubilization, and toxicity of Stachybotrys chartarum spore trichothecene mycotoxins in an established in vitro luminescence protein translation inhibition assay. J Microbiol Methods 2006;66:354–361 [DOI] [PubMed] [Google Scholar]
- 10. Bouziane H, Latge JP, Fitting C, et al. Comparison of the allergenic potency of spores and mycelium of Cladosporium. Allergol Immunopathol (Madr) 2005;33:125–130 [DOI] [PubMed] [Google Scholar]
- 11. Brasel TL, Martin JM, Carriker CG, Wilson SC, Straus DC. Detection of airborne Stachybotrys chartarum macrocyclic trichothecene mycotoxins in the indoor environment. Appl Environ Microbiol 2005;71:7376–7388 [DOI] [PMC free article] [PubMed] [Google Scholar]
- 12. Kuhn DM, Ghannoum MA. Indoor mold, toxigenic fungi, and Stachybotrys chartarum: infectious disease perspective. Clin Microbiol Rev 2003;16:144–172 [DOI] [PMC free article] [PubMed] [Google Scholar]
- 13. Schleibinger H, Laussmann D, Brattig C, et al. Emission patterns and emission rates of MVOC and the possibility for predicting hidden mold damage? Indoor Air 2005;15(Suppl 9):98–104 [DOI] [PubMed] [Google Scholar]
- 14. Andersen B, Nielsen KF, Jarvis BB. Characterization of Stachybotrys from water-damaged buildings based on morphology, growth, and metabolite production. Mycologia 2002;94:392–403 [PubMed] [Google Scholar]
- 15. Dearborn DG, Yike I, Sorenson WG, Miller MJ, Etzel RA. Overview of investigations into pulmonary hemorrhage among infants in Cleveland, Ohio. Environ Health Perspect 1999;107(Suppl 3):495–499 [DOI] [PMC free article] [PubMed] [Google Scholar]
- 16. Etzel RA. How environmental exposures influence the development and exacerbation of asthma. Pediatrics 2003;112:233–239 [PubMed] [Google Scholar]
- 17. Gent JF, Ren P, Belanger K, et al. Levels of household mold associated with respiratory symptoms in the first year of life in a cohort at risk for asthma. Environ Health Perspect 2002;110:A781–A786 [DOI] [PMC free article] [PubMed] [Google Scholar]
- 18. Mahmoudi M, Gershwin ME. Sick building syndrome. III. Stachybotrys chartarum. J Asthma 2000;37:191–198 [DOI] [PubMed] [Google Scholar]
- 19. Meklin T, Haugland RA, Reponen T, et al. Quantitative PCR analysis of house dust can reveal abnormal mold conditions. J Environ Monit 2004;6:615–620 [DOI] [PMC free article] [PubMed] [Google Scholar]
- 20. Li DW, Yang CS. Fungal contamination as a major contributor to sick building syndrome. Adv Appl Microbiol 2004;55:31–112 [DOI] [PubMed] [Google Scholar]
- 21. Aizenberg V, Reponen T, Grinshpun SA, Willeke K. Performance of Air-O-Cell, Burkard, and Button samplers for total enumeration of airborne spores. Aihaj 2000;61:855–864 [DOI] [PubMed] [Google Scholar]
- 22. Portnoy JM, Barnes CS, Kennedy K. Sampling for indoor fungi. J Allergy Clin Immunol 2004;113:189–198 [DOI] [PubMed] [Google Scholar]
- 23. Shelton BG, Kirkland KH, Flanders WD, Morris GK. Profiles of airborne fungi in buildings and outdoor environments in the United States. Appl Environ Microbiol 2002;68:1743–1753 [DOI] [PMC free article] [PubMed] [Google Scholar]
- 24. Wu Z, Wang XR, Blomquist G. Evaluation of PCR primers and PCR conditions for specific detection of common airborne fungi. J Environ Monit 2002;4:377–382 [DOI] [PubMed] [Google Scholar]
- 25. Black JA, Dean TR, Foarde K, Menetrez M. Detection of Stachybotrys chartarum using rRNA, tri5, and β-tubulin primers and determining their relative copy number by real-time PCR. Mycol Res 2008;112:845–851 [DOI] [PubMed] [Google Scholar]
- 26. Hinrikson HP, Hurst SF, Lott TJ, Warnock DW, Morrison CJ. Assessment of ribosomal large-subunit D1-D2, internal transcribed spacer 1, and internal transcribed spacer 2 regions as targets for molecular identification of medically important Aspergillus species. J Clin Microbiol 2005;43:2092–2103 [DOI] [PMC free article] [PubMed] [Google Scholar]
- 27. Jasalavich CA, Ostrofsky A, Jellison J. Detection and identification of decay fungi in spruce wood by restriction fragment length polymorphism analysis of amplified genes encoding rRNA. Appl Environ Microbiol 2000;66:4725–4734 [DOI] [PMC free article] [PubMed] [Google Scholar]
- 28. Millar BC, Xu J, Moore JE. Risk assessment models and contamination management: implications for broad-range ribosomal DNA PCR as a diagnostic tool in medical bacteriology. J Clin Microbiol 2002;40:1575–1580 [DOI] [PMC free article] [PubMed] [Google Scholar]
- 29. Motoyama AB, Venancio EJ, Brandao GO, et al. Molecular identification of Paracoccidioides brasiliensis by PCR amplification of ribosomal DNA. J Clin Microbiol 2000;38:3106–3109 [DOI] [PMC free article] [PubMed] [Google Scholar]
- 30. Vesper SJ, Varma M, Wymer LJ, et al. Quantitative polymerase chain reaction analysis of fungi in dust from homes of infants who developed idiopathic pulmonary hemorrhaging. J Occup Environ Med 2004;46:596–601 [DOI] [PubMed] [Google Scholar]
- 31. Borsuk PA, Nagiec MM, Stepien PP, Bartnik E. Organization of the ribosomal RNA gene cluster in Aspergillus nidulans. Gene 1982;17:147–152 [DOI] [PubMed] [Google Scholar]
- 32. Rooney AP, Ward TJ. Evolution of a large ribosomal RNA multigene family in filamentous fungi: birth and death of a concerted evolution paradigm. Proc Natl Acad Sci USA 2005;102:5084–5089 [DOI] [PMC free article] [PubMed] [Google Scholar]
- 33. Black JA, Foarde KK. Comparison of four different methods for extraction of Stachybotrys chartarum spore DNA and verification by real-time PCR. J Microbiol Methods 2007;70:75–81 [DOI] [PubMed] [Google Scholar]
- 34. Akamatsu H. Molecular biological studies on the pathogenicity of Alternaria alternata tomato pathogype. J Gen Plant Pathol 2004;70:389 [Google Scholar]
- 35. Farber P, Geisen R. Karyotype of Penicillium nalgiovense and assignment of the penicillin biosynthetic genes to chromosome IV. Int J Food Microbiol 2000;58:59–63 [DOI] [PubMed] [Google Scholar]
- 36. Fierro F, Gutierrez S, Diez B, Martin JF. Resolution of four large chromosomes in penicillin-producing filamentous fungi: the penicillin gene cluster is located on chromosome II (9.6 Mb) in Penicillium notatum and chromosome I (10.4 Mb) in Penicillium chrysogenum. Mol Gen Genet 1993;241:573–578 [DOI] [PubMed] [Google Scholar]
- 37. Kayser T, Schulz G. Electrophoretic karyotype of cellulolytic Penicillium janthinellum strains. Curr Genet 1991;20:289–291 [DOI] [PubMed] [Google Scholar]
- 38. Kupfer DM, Reece CA, Clifton SW, Roe BA, Prade RA. Multicellular ascomycetous fungal genomes contain more than 8000 genes. Fungal Genet Biol 1997;21:364–372 [DOI] [PubMed] [Google Scholar]
- 39. Machida M, Asai K, Sano M, et al. Genome sequencing and analysis of Aspergillus oryzae. Nature 2005;438:1157–1161 [DOI] [PubMed] [Google Scholar]
- 40. Nierman WC, Pain A, Anderson MJ, et al. Genomic sequence of the pathogenic and allergenic filamentous fungus Aspergillus fumigatus. Nature 2005;438:1151–1156 [DOI] [PubMed] [Google Scholar]
- 41. Schmitt EK, Eilinghoff B, Olliger R, Decker H, Kuck U. Development of molecular tools for the mulundocandin producer Aspergillus sydowii: DNA-mediated transformation and reporter gene expression. Appl Microbiol Biotechnol 2002;58:625–631 [DOI] [PubMed] [Google Scholar]
- 42. Talbot NJ, Oliver RP, Coddington A. Pulsed field gel electrophoresis reveals chromosome length differences between strains of Cladosporium fulvum (syn. Fulvia fulva). Mol Gen Genet 1991;229:267–272 [DOI] [PubMed] [Google Scholar]
- 43. Tobin MB, Peery RB, Skatrud PL. An electrophoretic molecular karyotype of a clinical isolate of Aspergillus fumigatus and localization of the MDR-like genes AfuMDR1 and AfuMDR2. Diagn Microbiol Infect Dis 1997;29:67–71 [DOI] [PubMed] [Google Scholar]
- 44. Yu J, Cleveland TE, Nierman WC, Bennett JW. Aspergillus flavus genomics: gateway to human and animal health, food safety, and crop resistance to diseases. Rev Iberoam Micol 2005;22:194–202 [DOI] [PubMed] [Google Scholar]
- 45. Yuen KY, Pascal G, Wong SS, et al. Exploring the Penicillium marneffei genome. Arch Microbiol 2003;179:339–353 [DOI] [PubMed] [Google Scholar]
- 46. Zeng QY, Westermark SO, Rasmuson-Lestander A, Wang XR. Detection and quantification of Cladosporium in aerosols by real-time PCR. J Environ Monit 2006;8:153–160 [DOI] [PubMed] [Google Scholar]
- 47. Brinkman NE, Haugland RA, Wymer LJ, et al. Evaluation of a rapid, quantitative real-time PCR method for enumeration of pathogenic Candida cells in water. Appl Environ Microbiol 2003;69:1775–1782 [DOI] [PMC free article] [PubMed] [Google Scholar]
- 48. Ellerbrok H, Nattermann H, Ozel M, et al. Rapid and sensitive identification of pathogenic and apathogenic Bacillus anthracis by real-time PCR. FEMS Microbiol Lett 2002;214:51–59 [DOI] [PubMed] [Google Scholar]
- 49. Herman LM, De Block JH, Waes GM. A direct PCR detection method for Clostridium tyrobutyricum spores in up to 100 milliliters of raw milk. Appl Environ Microbiol 1995;61:4141–4146 [DOI] [PMC free article] [PubMed] [Google Scholar]
- 50. Keegan AR, Fanok S, Monis PT, Saint CP. Cell culture-Taqman PCR assay for evaluation of Cryptosporidium parvum disinfection. Appl Environ Microbiol 2003;69:2505–2511 [DOI] [PMC free article] [PubMed] [Google Scholar]
- 51. Loeffler J, Schmidt K, Hebart H, Schumacher U, Einsele H. Automated extraction of genomic DNA from medically important yeast species and filamentous fungi by using the MagNA Pure LC system. J Clin Microbiol 2002;40:2240–2243 [DOI] [PMC free article] [PubMed] [Google Scholar]
- 52. Luo G, Mitchell TG. Rapid identification of pathogenic fungi directly from cultures by using multiplex PCR. J Clin Microbiol 2002;40:2860–2865 [DOI] [PMC free article] [PubMed] [Google Scholar]