Abstract
Given the complexity of cell membranes, there is a need for an analytical technique which can explore the physical properties of lipid membranes in a high-throughput and noninvasive manner. A simplified sum-frequency vibrational imaging (SFVI) setup has been developed and characterized using asymmetrically prepared 1,2-distearoyl-sn-glycero-3-phosphocholine (DSPC):1,2-distearoyl(d70)-sn-glycero-3-phosphocholine (DSPC-d70) lipid bilayer arrays. Exploiting the vibrational selectivity and inherent symmetry constraints of sum-frequency generation, SFVI was successfully used to probe the transition temperature of a patterned DSPC:DSPC-d70 lipid bilayer array. SFVI was also used to study the phase behavior in a multi-component micropatterned lipid bilayer array (MLBA) prepared using three different binary lipid mixtures (1,2-dioleoyl-sn-glycero-3-phosphocholine (DOPC):DSPC, DOPC:1,2-dipalmitoyl-sn-glycero-3-phosphocholine (DPPC) and 1,2-dimyristoyl-sn-glycero-3-phosphocholine (DMPC:DSPC). This paper demonstrates that a simplified SFVI setup provides the necessary chemical imaging capabilities with the spatial resolution, sensitivity and field of view required for exploring lipid membrane properties in a high-throughput array based assay.
INTRODUCTION
Sum-frequency vibrational spectroscopy (SFVS) is a well-established second-order nonlinear technique which is inherently surface specific and a complete description of its theory can be found in the scientific literature.1–3 There have been several examples of sum-frequency vibrational imaging (SFVI) presented in the literature.4–8 Flörsheimer et al. developed a counter-propagating SFVI setup to examine inhomogeneities in Langmuir-Blodgett (LB) monolayers on fused silica.4,5 The setup reported by Flörsheimer et al. utilizes two input beams which arrive at the surface of a prism from opposite directions under total internal reflection and an output SFG beam is collected on the other side of the prism. The counter-propagating setup has the advantage of good spatial separation of the sum-frequency beam from two high intensity input beams; however, the sum-frequency efficiency is lower when compared to a co-propagating geometry. SFVI microscopy using a co-propagating geometry has already been demonstrated and applied to image patterned self-assembled monolayers.6–8 Baldelli and co-workers have acquired 2D SFVI images of a metal surface that was first microcontact printed with a methyl-terminated alkanethiol and then backfilled with a phenyl-terminated alkanethiol.7 The researchers tuned the input infrared frequency to be on resonance with the vibrational transitions of either the methyl or phenyl groups to obtain the chemical contrast necessary to generate an image. This application of co-propagating SFVI microscopy used gold as the underlying substrate. Gold substrates have a large non-resonant background that results in a significant increase in the sum-frequency response.
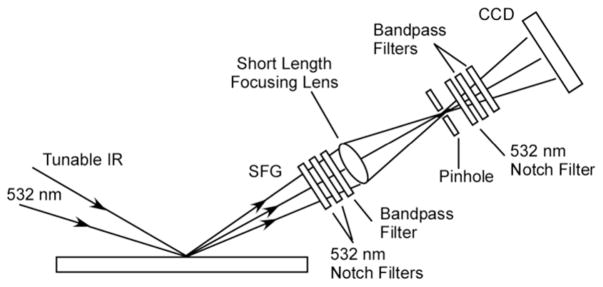
In this paper, a simplified SFVI setup was developed and applied to image lipid asymmetry in micropatterned lipid bilayers on a dielectric surface, in the absence of non-resonant enhancement effects. A single focusing lens in a confocal arrangement along with a combination of interference/notch filters to attenuate the background from the input beams were the only optical elements deemed necessary to produce an SFVI image (Figure 1). This setup is a simplified version of the SFVI setup presented in the literature6–8 where most of the optical elements were eliminated (two collimating lenses, microscope objective, grating, tube lens and interference/notch filters) which also provided the added advantage of a larger field of view, which is of importance for the interrogation of chemical or biological arrays on a surface as demonstrated here.
Figure 1.
Schematic illustration of the simplified SFVI optical setup with the total internal reflections of the input IR and 532 nm laser beams blocked by a series of notch and bandpass filters. The generated SFG image is reconstructed onto a LN cooled CCD camera using a single short length focusing lens (f = 50 mm).
The application of SFVI for the characterization of lipid structural asymmetry was examined using a UV photolithographic patterned PSLB which was asymmetrically prepared using 1,2-distearoyl-sn-glycero-3-phosphocholine (DSPC) and its deuterated analog. The simplified lens setup was initially investigated by collecting images for three different-sized pattern lines (397, 350 and 314 μm). The simplified lens setup was used to collect images of the asymmetric bilayer at different frequencies to demonstrate the vibrational selectivity of this technique. Heating and cooling curves were generated from the SFVI images to examine the phase behavior of the DSPC lipids. Finally, SFVI was used to probe the phase behavior of a micropatterned lipid bilayer array (MLBA) of binary phospholipid lipid mixtures using four primary lipids: 1,2-dioleoyl-sn-glycero-3-phosphocholine (DOPC), DSPC, 1,2-dipalmitoyl-sn-glycero-3-phosphocholine (DPPC) and 1,2-dimyristoyl-sn-glycero-3-phosphocholine (DMPC). These experiments showcase the potential application of spatially resolved SFVS for the investigation of lipid bilayer behavior, which can be extended to other system requiring localized vibrational information for characterization and analysis.
EXPERIMENTAL SECTION
Details of the materials used and sample preparation can be found in the supporting information.
SFVI Setup
SFVI was conducted using a custom optical parametric oscillator (OPO)/optical parametric amplifier (OPA) system (LaserVision) pumped by a 10 Hz Surelite Ex NdYAG laser (Continuum) with a 7 ns pulse duration and an energy around 500 mJ/pulse. This system has been described in detail elsewhere.9,10 The tunable IR (2750–3050 cm−1) generated from the OPO/OPA was combined with a fixed 532 nm beam at the silica/D2O interface in a co-propagating manner with incidence angles around 62° and 67°, respectively. The IR and fixed 532 nm beams were collimated to a beam area of ~7 mm2 with energies of 7 and 9 mJ/pulse, respectively. The SFVI images were collected with s- polarized sum frequency, s- polarized visible and p- polarized IR (ssp). The SFG was collected at the specified IR frequencies using a liquid nitrogen cooled VersArray CCD (Princeton Instruments) with a 512×512 imaging array of 24×24 μm pixels. Three single-band bandpass (447/60 nm Brightline, Semrock) and three single-notch filters (532 nm StopLine, Semrock) were placed before the CCD camera to allow the SFG to pass through while filtering out any residual 532 nm light. A pinhole was placed at the focal point of the short length focusing lens to block additional scattered light. Image acquisition time varied from 1 to 60 minutes. The images were analyzed using ImageJ software (http://rsbweb.nih.gov/ij/). Background subtractions were performed for each image by blocking the IR and using the same acquisition time to collect each image. The images were then rescaled in the x direction to account for the compression that occurs as a result of imaging at an angle close to 67°. The x scale was chosen such that the vertical line-widths would be equivalent to the horizontal line-widths. The line-widths were defined as the full width at half maximum (FWHM) and calculated using GRAMS/AI software.
The MLBA images were flat field corrected to account for the intensity distribution of the IR and 532 nm visible laser beams by normalizing each image to an image of 10 mM KOH recorded at 3100 cm−1 on a bare silica surface. The background image was collected by first removing the MLBA at the end of the experiment by incubating for 20 min in 125 mM sodium dodecyl sulfate (SDS) solution and rinsing with water. Methanol was then injected and incubated for 5 min followed by an additional water rinse. A 10 mM KOH solution was injected and imaged at 3100 cm−1 with the same exposure time (1 hour) used for acquiring the MLBA images. The MLBA images were divided by the KOH images in ImageJ to obtain the flat field corrected images. Background subtractions were also performed using the average intensity from the control spots to obtain a baseline at zero.
SFVS Setup
The SFVS setup is identical to the imaging setup described previously except the CCD was replaced with a photomultiplier tube (PMT) and a boxcar integrator (Stanford Research Systems) used to process the SFVS signal. The SFVS spectrum was obtained by tuning the IR wavelength from 2750–3050 cm−1 in 2 cm−1 steps and integrating for 2 seconds at each step. For the temperature scan experiments, signal was collected at an IR frequency of 2875 cm−1 and averaged for 1 second.
RESULTS AND DISCUSSION
Sum-Frequency Vibrational Imaging
A confocal spatial filter, consisting of one focusing lens and a pinhole at the focal length, is a convenient way to reconstruct an image of the surface while also removing unwanted background light originating from the incident fundamental at 532 nm and ~3.48 μm.11 This SFVI setup was initially tested by imaging a pattern created by selectively etching an asymmetric DSPC/DSPC-d70 lipid bilayer with ozone using the USAF test target group-element 0-3, 0-4 and 0-5 with corresponding line-widths of 397, 355 and 314 Km, shown in Figure 2a. The SFVI images for each group-element were acquired individually at 2875 cm−1 corresponding to the CH3 vs and pieced together in Figure 2b. The CCD camera was placed at a distance from the focal point of the focusing lens to increase the image size to 1.4x its original size. The SFVI images in Figure 2b shows well resolved vertical and horizontal lines at all the different line-widths. Figure 2b also shows this setup is capable of imaging much smaller line-widths apparent by the fact that the individual numbers identifying each group, which have a line-width of 120 Km, are clearly resolved.
Figure 2.
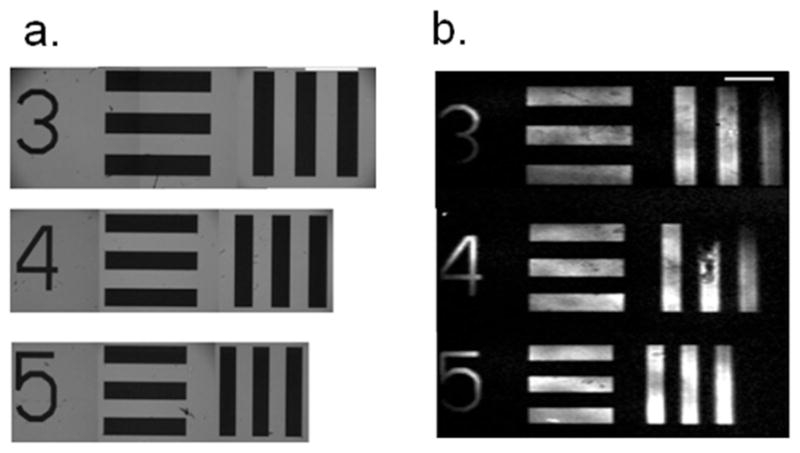
(a) The white light image of the USAF test target for group-elements 0-3, 0-4 and 0-5 corresponding to the line-widths of 397, 355 and 314 μm, respectively. (b) The SFVI image taken of a patterned bilayer imaged with a single lens and confocal stop. The CCD was placed an appropriate distance from the lens to produce a 1.4x magnification in the object size. Scale bars represent 1 mm.
The resolution of the optical setup was determined by calculating the smallest resolvable feature of the USAF test target which was UV patterned on the asymmetric DSPC/DSPC-d70 bilayer (Figure 3). Using the Rayleigh criterion, in which the center maximum of the image of one source falls on the first minimum of the other,12 the vertical lines remain resolved up to the 2-4 group-element which correspond to 88 μm line-widths (Figure 3a). The horizontal lines remain resolved up to the 39 μm line-width (3-5 group-element) (Figure 3b). It should be noted that the peaks were fitted to a Gaussian function in order to provide a simple approximation of the resolution. This anisotropic resolution is expected as a result of imaging at an oblique angle.6 These results demonstrate that one focusing lens is all that is needed to generate well resolved images with a spatial horizontal and vertical resolution of 88 and 39 Km, respectively. This resolution was acceptable since a setup with a large field of view and efficient photon collection was the desired outcome of the current study, as the application was for the chemical imaging of lipid arrays. It is important to note that the observed resolution in the current study is also based on the quality of the line-widths of the lipid bilayers which is dependent on many factors such as UV exposure time, distance of the substrate from the UV lamps and mobility of the lipids influencing the sharpness of the lines. The resolution of the current lens setup is further limited by the pixel size (24 μm) of the CCD and could be improved by increasing the magnification of the lens setup.
Figure 3.
(a) The SFVI image of the USAF test target for the group-elements 2-2 thru 2-6 corresponding to the line-widths of 111 to 70 μm, respectively, with the element numbers shown to the left of the image. The intensity plot profile for the dashed box highlighting the 2-4 group-element vertical lines (88 μm line-width) is shown as the black solid lines to the right with the dashed lines representing the Gaussian peak fitting. (b) The SFVI image of the 3-1 to 3-6 group-element corresponding to 63 μm down to 35 μm per line-width along with the element numbers shown to the left of the image. The intensity plot profile (black solid line) for the dashed box highlighting the 3-5 horizontal lines (39 μm line-width) as well as the Gaussian fits (dashed lines) is shown to the right. Scale bars represent 400 μm.
Vibration Spectroscopy and SFVI
In order to test the vibrational selectivity of the SFVI setup, a UV patterned asymmetric DSPC/DSPC-d70 bilayer patterned with the USAF test target was imaged at different frequencies and compared to the SFVS signal of an identically prepared bilayer. The spectrum of the patterned bilayer in Figure 4 shows predominant peaks from the lipid acyl chains at 2846 cm−1, 2875 cm−1 and 2935 cm−1 which correlate to the CH2 symmetric stretch (vs), CH3 vs and the CH3 Fermi resonance (FR), respectively.13 Images of the USAF test target patterned asymmetric bilayer using group-element 0-3 corresponding to 397 μm line-widths (Figure 4a) were taken at the three peak frequencies along with two off resonance peaks at 2750 and 3050 cm−1 and are shown in Figure 4b–f. The intensity of the patterned bilayer at the different frequencies were individually normalized to the intensity at 2875 cm−1 for each line-width and reproduced in triplicate. The normalized intensities from the images were overlaid with the normalized spectrum of the patterned bilayer. The intensities of the patterned bilayer at 2846 and 2935 cm−1 were found to be 12 ± 5 and 46 ± 13 % of the intensity at 2875 cm−1, respectively. These percentages are comparable to the spectral results from the patterned bilayer which was calculated to be 17 ± 2 and 70 ± 4 % for 2846 and 2936 cm−1, respectively. The differences are insignificant at the 95 % confidence level for the CH2 vs/CH3 vs ratio but not for the CH3 FR/CH3 vs ratio. The discrepancy could be a consequence of the decreasing quantum efficiency (QE) at shorter wavelengths across the SFG wavelengths of 464 to 457 nm (corresponding to ωIR = 2750 to 3050 cm−1) for the CCD device while the PMT’s QE increases at these shorter wavelengths. Furthermore, the images acquired off resonance shows a small amount of signal at 2750 cm−1 while at 3050 cm−1, no statistically significant intensity above background at the 95 % confidence level was measured. These experiments demonstrate that the SFVI setup can resolve vibrational information with similar results compared to the well-established SFVS technique, but with spatial resolution.
Figure 4.
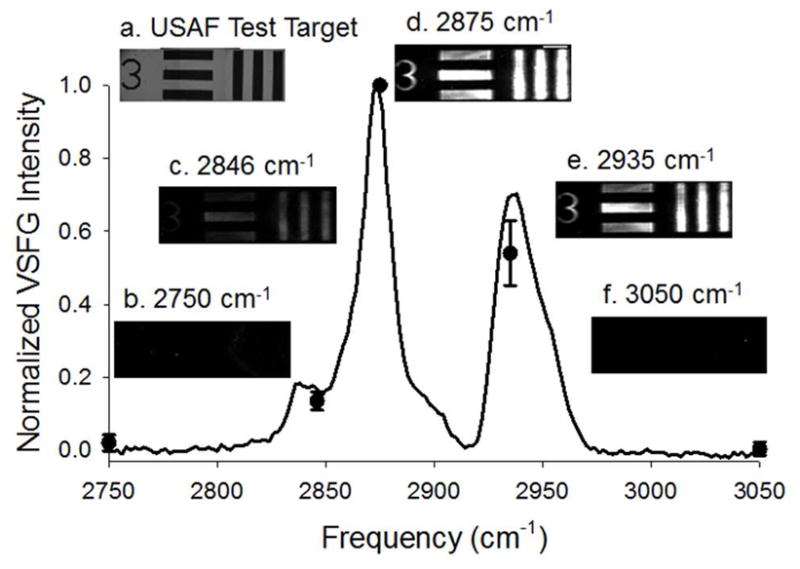
SFVI images of a patterned DSPC/DSPC-d70 bilayer using (a) USAF test target group-element 0-3 (white light image using a standard laboratory microscope) corresponding to 397 μm line-width acquired at the reported frequencies (b–d). The six line-widths were first individually normalized to their identical initial line-width intensity at 2875 cm−1 and reproduced in three separate experiments. The averaged SFVS spectrum from three experiments is also shown for a patterned DSPC/DSPC-d70 bilayer (solid black line). The scale bar represents 1 mm.
Application of SFVI
SFVI was applied to investigate the conversion of a patterned asymmetric DSPC/DSPC-d70 lipid bilayer to a symmetric bilayer as a function of temperature. As the asymmetric DSPC bilayer is heated near it Tm, the lipids undergo a transformation from the gel phase to the l.c. phase. The transition is also accompanied by a rapid increase in the rate of lipid translocation, or flip-flop, which results in the conversion of the asymmetric bilayer into a homogenous symmetric bilayer in which the population of deuterated and proteated DSPC is equal in each leaflet.14 SFVS has already been used to successfully probe the asymmetry in an asymmetric DSPC/DSPC-d83 lipid bilayers as a function of temperature.15 This application was tested with SFVI on a patterned asymmetric DSPC/DSPC-d70 bilayer using 355 μm line-widths from the USAF test target by imaging the array as a function of temperature. The images are shown above the plotted normalized intensities at the respective temperatures in Figure 5. The data points were compared to the heating and cooling curves of a patterned bilayer of identical composition obtained using SFVS which is shown as the solid lines in Figure 5. The heating curve (black line) shows a steady decrease in signal until 50°C where the signal falls off sharply and drops to background levels at the Tm = 55°C. The results obtained from SFVI (solid triangles) follow a similar trend with respect to temperature with slightly lower average intensities observed from the images as the temperature approaches the Tm. This could be explained by the 1 minute exposure time required to obtain an image and the 1 second integration time used in spectroscopy. For example, at 52°C there is a fast rate of lipid flip-flop with a continual decay of signal during the 1 minute acquisition time.14 Figure 5 also demonstrates that when the bilayer is cooled back through its phase transition temperature the signal remains at background levels for both techniques as a result of the transformed symmetric lipid bilayer.
Figure 5.
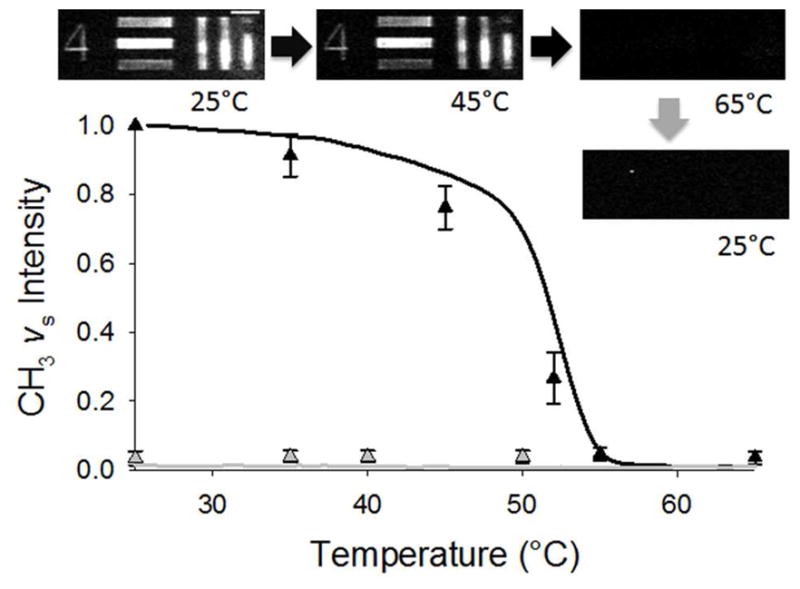
SFVI images of the USAF test target group-element 0-4 (355 μm line-width) patterned DSPC/DSPC-d70 bilayer acquired at various temperatures measured with an incident IR frequency of 2875 cm−1. The intensities as a function of heating (black) and cooling (grey) are shown as triangles. The data points represent the average intensity measured for of all the lines pooled from three separate experiments which each line first individually normalized to their respective intensity at 25°C. The heating (black) and cooling (grey) curves represent the smoothed data averaged from three separate experiments obtained from a patterned DSPC/DSPC-d70 bilayer by SFVS. The scale bar represents 1 mm.
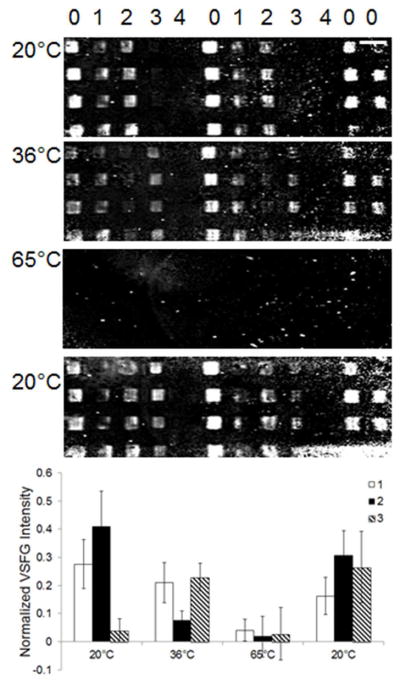
One potential application of SFVI would be to study the phase behavior of multiple lipid bilayers in a multicomponent MLBAs for high-throughput experiments. In another application of the symmetry constraints imposed on SFVS, the ability to detect domain disparities between segregated phases between the proximal and distal leaflets of a PSLB, have already been demonstrated by Liu et al.15 Lipid mixtures with disparate Tms or a single lipid component bilayer at the Tm, creates a phase segregated lipid membrane in which distinct lipid domains form in the bilayer of specific compositions. Although this signal is almost an order of magnitude lower than the signal obtained from a fully asymmetric bilayer, it is readily detectable spatially using the SFVI setup described here.15 To demonstrate the capabilities of our SFVI setup, the phase transitions in a MLBA prepared using the CFM was obtained. Figure 6 shows the flat field corrected images of a MLBA composed of DOPC:DSPC, DOPC:DPPC and DMPC:DSPC at various temperatures along with blank spots to serve as controls obtained measured at 2875 cm−1. Membranes containing 40 mol % CHO in DOPC:DSPC were used as position finders on the array, as a large amount of signal is observed from this composition at room temperature as a result of an asymmetric distribution of CHO within the membrane.16
Figure 6.
The flat field corrected SFVI images of a MLBA composed of a molar ratio of (0) 1:1 DOPC:DSPC with 40 mol % CHO, (1) 1:1 DOPC:DSPC, (2) 1:1 DOPC:DPPC, (3) 1:1 DMPC:DSPC and (4) a control spot acquired at different temperatures at 2875 cm−1. The average VSFG intensities for the three different binary mixtures are plotted as a function of temperature in the bar graph. Scale bar represents 800 Km.
At room temperature, there is significant sum-frequency intensity observed from DOPC:DSPC (0.28 ± 0.09) and DOPC:DPPC (0.41 ± 0.13) while the DMPC:DSPC bilayer patches (0.04 ± 0.04) have signal which is not statistically different from the control spots (0.00 ± 0.07). The detected signal suggests phase segregation exists between DSPC:DOPC and DOPC:DPPC while the lack of signal from DMPC:DSPC implies one homogenous phase at 20°C. This is consistent with the phase diagrams of identical lipid compositions presented in the literature.15,17,18
When the array is heated to 36°C there is a dramatic attenuation in signal for the DOPC:DPPC bilayer spots from 0.41 ± 0.13 to 0.07 ± 0.03 while there is a fivefold increase in the intensity observed from the DMPC:DSPC spots from 0.04 ± 0.04 to 0.23 ± 0.05. There is a slight but not significant decrease in the sum-frequency intensity for the DOPC:DSPC spots from 0.27 ± 0.09 to 0.21 ± 0.07. These results are consistent with the reported Tm of these binary mixtures.15,18 When the temperature is further increased to 65°C there is a significant reduction in signal observed from all the binary lipid mixtures which are all within error of the control spots. The subsequent loss of signal is the result of all the lipid membranes being in the l.c. phase.
When the MLBA is cooled back down to 20°C there is an almost full recovery to the original intensities for DOPC:DSPC (0.16 ± 0.06) and DOPC:DPPC (0.31 ± 0.09). The slightly lower sum-frequency intensities observed for DOPC:DSPC and DOPC:DPPC bilayer spots could be a consequence of the temperature sweeps through the Tm of the lipids which is known to disrupt membrane structure and increase defects in the membrane upon cooling.19,20 In contrast, the intensity from the DMPC:DSPC bilayer patches (0.26 ± 0.13) are comparable to signal intensity observed when the sample was first heated to 36°C. This could be a result of a hysteresis where lipids can exhibit a lower Tm as a result of cooling the sample during temperature sweeps.21
CONCLUSION
The SFVI setup described here, utilizes a single focusing lens in conjunction with a confocal stop, is capable of resolving both vertical and horizontal line-widths of varying sizes on the Km scale. It was also shown that SFVI can be used to probe the different vibrational resonances of the lipid bilayer with its vibrational sensitivity comparable to SFVS. SFVI was capable of resolving up to 48 400 × 400 Km2 spots along with the sensitivity of measuring the phase behavior in binary lipid bilayer mixtures. The phase transition temperatures of three different binary mixtures (DOPC:DSPC, DOPC:DPPC and DSPC:DMPC) were successfully probed using the IR and spatial resolution afforded by SFVI. The capability of this technique to study inhomogeneities of biological surfaces with IR selectivity and sub-IR resolution could be extended to a broad range of important applications in many fields such as drug discovery and clinical diagnostics.
Supplementary Material
Acknowledgments
The authors thank Wasatch Microfluidics for providing the CFM. The authors also thank Ms. Krystal Brown and Dr. Grace Stokes for their assistance with the SFVI setup as well as helpful discussions. This work was supported by funds from the National Institute of Health (59304221), and the National Science Foundation (NSF 1110351). Any opinions, findings, conclusions, or recommendations expressed in this material are those of the authors and do not necessarily reflect the views of the NIH or NSF.
Footnotes
Experimental detail about lipid bilayer preparation and lens-less SFVI. This material is available free of charge via the Internet at http://pubs.acs.org.
References
- 1.Lambert AG, Davies PB, Neivandt DJ. Applied Spectroscopy Reviews. 2005;40:103. [Google Scholar]
- 2.Shen YR. Nature. 1989;337:519. [Google Scholar]
- 3.Shen YR. The Principles of Nonlinear Optics. John Wiley and Sons, Inc; 1984. [Google Scholar]
- 4.Floersheimer M, Brillert C, Fuchs H. Langmuir. 1999;15:5437. [Google Scholar]
- 5.Florsheimer M, Brillert C, Fuchs H. Materials Science & Engineering, C: Biomimetic and Supramolecular Systems. 1999;C8–C9:335. [Google Scholar]
- 6.Hoffmann DMP, Kuhnke K, Kern K. Review of Scientific Instruments. 2002;73:3221. [Google Scholar]
- 7.Cimatu K, Baldelli S. J Phys Chem B. 2006;110:1807. doi: 10.1021/jp0562779. [DOI] [PubMed] [Google Scholar]
- 8.Kuhnke K, Hoffmann DMP, Wu XC, Bittner AM, Kern K. Applied Physics Letters. 2003;83:3830. [Google Scholar]
- 9.Liu J, Conboy JC. Biophysical Journal. 2005;89:2522. doi: 10.1529/biophysj.105.065672. [DOI] [PMC free article] [PubMed] [Google Scholar]
- 10.Brown KL, Conboy JC. J Am Chem Soc. 2011;133:8794. doi: 10.1021/ja201177k. [DOI] [PubMed] [Google Scholar]
- 11.Fowles GR. Introduction to Modern Optics. 2. Holt, Rinehart and Winston; New York: 1975. [Google Scholar]
- 12.Milonni PW, Eberly JH. Lasers. John Wiley and Sons; New York: 1988. [Google Scholar]
- 13.Tamm LK, Tatulian SA. Quarterly Reviews of Biophysics. 1997;30:365. doi: 10.1017/s0033583597003375. [DOI] [PubMed] [Google Scholar]
- 14.Liu J, Conboy John C. Journal of the American Chemical Society. 2004;126:8376. doi: 10.1021/ja048245p. [DOI] [PubMed] [Google Scholar]
- 15.Liu J, Conboy JC. Journal of Physical Chemistry C. 2007;111:8988. doi: 10.1021/jp0671906. [DOI] [PubMed] [Google Scholar]
- 16.Liu J, Conboy JC. Vibrational Spectroscopy. 2009;50:106. doi: 10.1016/j.vibspec.2008.09.004. [DOI] [PMC free article] [PubMed] [Google Scholar]
- 17.Almeida PFF, Vaz WLC, Thompson TE. Biophys J. 1993;64:399. doi: 10.1016/S0006-3495(93)81381-X. [DOI] [PMC free article] [PubMed] [Google Scholar]
- 18.Lentz BR, Barenholz Y, Thompson TE. Biochemistry. 1976;15:4529. doi: 10.1021/bi00665a030. [DOI] [PubMed] [Google Scholar]
- 19.Xie AF, Yamada R, Gewirth AA, Granick S. Physical Review Letters. 2002;89:246103/1. doi: 10.1103/PhysRevLett.89.246103. [DOI] [PubMed] [Google Scholar]
- 20.Tamm LK, McConnell HM. Biophysical Journal. 1985;47:105. doi: 10.1016/S0006-3495(85)83882-0. [DOI] [PMC free article] [PubMed] [Google Scholar]
- 21.Ohlsson G, Tigerstroem A, Hoeoek F, Kasemo B. Soft Matter. 2011;7:10749. [Google Scholar]
Associated Data
This section collects any data citations, data availability statements, or supplementary materials included in this article.


