

Abstract
Object recognition memory requires the perirhinal cortex (PRC) and this cognitive function declines during normal aging. Recent electrophysiological recordings from young rats have shown that neurons in layer V of the PRC are activated by 3-dimensional objects. Thus, it is possible that age-related object recognition deficits result from alterations in PRC neuron activity in older animals. To examine this, the present study used cellular compartment analysis of temporal activity by fluorescence in situ hybridization (catFISH) with confocal microscopy to monitor cellular distributions of activity-induced Arc RNA in layer V of the PRC. Activity was monitored during two distinct epochs of object exploration. In one group of rats (6 young/6 aged) animals were placed in a familiar testing arena and allowed to explore five different 3-dimensional objects for two 5-min sessions separated by a 20-min rest (AA). The second group of animals (6 young/6 aged) also explored the same objects for two 5-min sessions, but the environment was changed between the first and the second epoch (AB). Behavioral data showed that both age groups spent less time exploring objects during the second epoch, even when the environment changed, indicating successful recognition. Although the proportion of active neurons between epochs did not change in the AA group, in the AB group more neurons were active during epoch 2 of object exploration. This recruitment of neurons into the active neural ensemble could serve to signal that familiar stimuli are being encountered in a new context. When numbers of Arc positive neurons were compared between age groups, the old rats had significantly lower proportions of Arc-positive PRC neurons in both the AA and AB behavioral conditions. These data support the hypothesis that age-associated functional alterations in the PRC contribute to declines in stimulus recognition over the lifespan.
Keywords: immediate-early gene, object field, object recognition, rat
Introduction
During normal aging there are deficits in an animal's ability to discriminate new stimuli from those that have already been experienced (Burke et al., 2011; Burke et al., 2010). This age-associated decline in stimulus recognition is reminiscent of the object recognition impairments that have been reported for rats with perirhinal cortical (PRC) lesions (Bartko et al., 2007; McTighe et al., 2010), and suggests that the PRC is among the brain structures vulnerable to the process of normal aging (Burke et al., 2012a; Liu et al., 2008; Liu et al., 2009; Moyer et al., 2009). Although data from animals with a compromised PRC have suggested that it is critically involved in object recognition memory (Winters and Bussey, 2005), the neurobiological mechanism that supports this cognitive process is not completely understood.
Previous electrophysiological recordings (e.g., Xiang and Brown, 1998; Zhu and Brown, 1995; Zhu et al., 1995a) and c-fos imaging studies (e.g., Zhu et al., 1995b; Zhu et al., 1997) have reported that PRC neurons are more active in response to novel stimuli compared to those that are familiar. Therefore, it has been hypothesized that a response decrement in PRC neuron activity could provide the familiarity signal required for an animal to judge whether or not a stimulus has been encountered before. Thus, a reasonable hypothesis is that aged animals could show object recognition deficits because of potential age-associated alterations in the differential firing rates of PRC cells in response to novel versus familiar stimuli.
Although the prevailing theory for the mnemonic mechanism of object recognition memory is that decreases in PRC neuron activity provide a familiarity signal (Brown and Aggleton, 2001), more recent investigations have not observed a response decrement in neuronal firing rates of PRC principal neurons as stimuli go from novel to familiar (Burke et al., 2012b; Thome et al., 2012 in this issue; Woloszyn and Sheinberg, 2012). In fact, it has been reported that PRC principal cells show “object fields”, punctate increases in firing at locations that contain 3-dimensional objects, but this object-dependent activity does not appear to differ as a function of novelty (Burke et al., 2012b in this issue). A potential lack of a response decrement concurrent with rats showing successful object recognition would require a re-examination of current theories of the neurobiological basis of recognition memory, as well as the etiology of age-related declines in this cognitive process.
Another important component of recognition memory includes observations that animals can identify that a stimulus is familiar even when the context changes between familiarization and retrieval (Burke et al., 2010; Piterkin et al., 2008), but an animal's ability to remember the context in which an object was experienced does not require an intact PRC (Norman and Eacott, 2005). These data suggest that PRC-dependent object recognition may be context-invariant. This idea, however, if difficult to reconcile with reports that the PRC is critical for contextual fear conditioning (Bucci et al., 2000; Burwell et al., 2004; Kent and Brown, 2012 in this issue). Thus, examining whether or not changing environmental context has any affect on PRC neuron activity patterns could provide insight regarding the role of the PRC in associating a stimulus with a given context.
Although advances in multiple unit recording techniques have enabled the recording of many well-isolated neurons simultaneously (e.g., Wilson and McNaughton, 1993), neurophysiological techniques are still limited in the number of neurons that can be observed concurrently. This limitation restricts the size of the sample cell population examined during complex behaviors, potentially impacting statistical power to detect novelty-modulated differences in PRC neuron activity patterns. Anatomical methods that monitor the expression of neural activity-dependent, immediate early genes (IEGs) such as c-fos (Morgan et al., 1987) have been developed that can map the distribution of thousands of neurons activated during specific behaviors. IEG expression is dynamically regulated by specific forms of patterned synaptic activity believed to underlie information storage (Cole et al., 1989). One of the most powerful variants of these methods, cellular compartment analysis of temporal activity by fluorescence in situ hybridization (catFISH), utilizes the transcription kinetics of the IEG Arc (activity-regulated cytoskeletal-associated gene; Lyford et al., 1995). Within 2 min of behavior-related activation of a neural ensemble, Arc RNA first appears in the nuclei of glutamatergic principal neurons at discrete sites of genomic transcription. Arc, however, is not expressed by glia or GABAergic interneurons in the hippocampus and neocortex during identical behavioral paradigms (Vazdarjanova et al., 2006). After about 10 min, Arc RNA begins to leave the nucleus and accumulates in the cytoplasm, where it can be detected 15–45 min after activation (Guzowski et al., 2001). The cellular distribution of Arc RNA thus provides information about when single neurons were activated and allows neuronal populations activated by two distinct experiences, separated by about 20 min, to be visualized within a single brain (Guzowski et al., 2001). Neurons active only in the first 5 min epoch of behavior exhibit cytoplasmic Arc but not nuclear Arc (cyto+). Conversely, neurons active during only the second epoch exhibit nuclear Arc only and no Arc in the cytoplasm (foci+). Finally, neurons active in both epochs exhibit both cytoplasmic and nuclear Arc signal (both+). Thus, the proportion of principal neurons with Arc in the nucleus only, cytoplasm only, or both can be used to infer the amount of overlap in neural ensembles activated by two experiences (Table 1). Because it has been suggested that object recognition is supported by a sparsification of the PRC neurons that represent a stimulus (Desimone, 1996), successful object recognition should be correlated with lower numbers of neurons showing activity during epoch 2 when the objects are familiar. With regards to the pattern of Arc expression, this would result in fewer neurons with Arc foci in the nucleus compared to number of cells with Arc in the cytoplasm. In other words, if the mnemonic mechanism for recognition memory is an overall reduction in the number of PRC neurons that are responsive to objects, then one would predict a pattern of Arc expression where more neurons were active during the first epoch of object exploration when the stimuli were novel. It is conceivable, however, that changes in neuronal firing rate without a reduction in the proportion of active cells signals object familiarity (Xiang and Brown, 1998). This type of firing rate change may not be detectable with Arc catFISH. Notably, however, several recent papers using slightly different behavioral tasks, have reported no reduction in PRC neuron firing rates as stimuli go from novel to familiar (Burke et al., 2012b; Thome et al., 2012 in this issue; Woloszyn and Sheinberg, 2012).
Table 1.
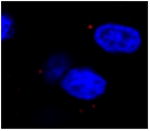
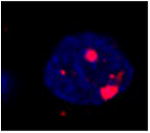
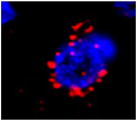
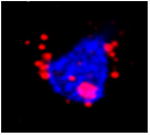
| Image example | Arc subcellular location | Activity history |
|---|---|---|
|
None | In active during both epochs |
|
Foci+ | Epoch 2 only; familiar objects |
|
Cyto+ | Epoch 1 only; novel objects |
|
Both+ | Both epochs 1 and 2 |
The Arc catFISH method also allows the effect of changing environment context to be measured within the same population of cells. Although layer V PRC neurons receive a direct projection from the hippocampus, the extent that cells in this region are sensitive to spatial information is unknown. Therefore, the current experiment also examined whether or not the active PRC neural ensemble was altered by changing the environment that objects were explored in. If objects are primarily responsible in for modulatingPRC neuron activity, then changing th environmental context should not affect cell activity, or a potential response decrement. On the other hand, if the PRC is involved in representing contextual information, as indicated by the fear conditioning literature (Bucci et al., 2000; Kent and Brown, 2012 in this issue), then changing the context should alter the population of active PRC neurons.
Methods
Subjects and behavior
A total of 24 young (7-9 months) and 23 aged (24-27 months) Fischer 344 rats (from the National Institute on Aging's colony at Charles River, Wilmington, MA) participated in the current experiment. The rats were housed individually in Plexiglas guinea pig tubs and maintained on a reversed 12-hr light-dark cycle. All behavioral testing occurred during the dark phase of the rats' light-dark cycle and each animal was given access to food and water ad libitum for the duration of the experiment.
After arriving, rats were handled by experimenters over several days for at least 5-10 minutes per day until they appeared calm during handling. Following this habituation procedure, rats were tested on the spatial and the visually-cued versions of the Morris swim task in order to test visual acuity and spatial memory (Morris, 1984). The Morris swim task procedures have been described in detail previously (e.g. Barnes et al., 1996; Shen et al., 1996). Briefly, during the spatial version of the Morris swim task, all animals were given 6 training trials per day over 4 consecutive days. During these trials, an escape platform was hidden below the surface of water, which was made opaque with non-toxic Crayola paint. Rats were released from seven different start locations around the perimeter of the tank, and each animal performed two successive trials before the next rat was tested. The order of the release locations was pseudo-randomized for each rat such that no rat was released from the same location on two consecutive trials. Immediately following the 24 spatial trials, the rats performed a probe trial in which the platform was removed and a rat swam in the pool for 60 sec (data not shown). Following the probe trial the animals were screened for visual ability with 2 days of cued visual trials (6 trials per day) in which the escape platform was above the surface of the water but the position of the platform changed between each trial. Rats' performance on the swim task was analyzed offline with a commercial software application (ANY-maze, Wood Dale, IL). Because different release locations and differences in swimming velocity produce variability in the latency to reach the escape platform, a corrected integrated path length (CIPL) was calculated to ensure comparability of the rats' performance across different release locations (Gallagher et al., 1993). The CIPL value measures the cumulative distance over time from the escape platform corrected by an animal's swimming velocity, and is equivalent to the cumulative search error described by Gallagher and colleagues (1993). Therefore, regardless of the release location, if the rat mostly swims towards the escape platform the CIPL value will be low. In contrast, the more time a rat spends swimming in directions away from the platform, the higher the CIPL value.
Following the Morris swim task, 23 rats (12 young and 11 aged) were assigned to either the negative or positive control condition (see below). The remaining 12 young and 12 aged rats participated in one of two different variants of an object recognition task (AA or AB condition) in which rats were allowed to freely explore 5 distinct novel objects for two 5 min epochs separated by a 20 min rest in the home cage. In both the AA and AB conditions the same 5 objects were explored during the two epochs of behavior, thus, the only variables that changed were the testing arena/room used for the second epoch of exploration (A or B). Additionally, both the AA and AB groups were habituated to the arenas for the two days directly preceding object exploration. For the AA condition, rats were habituated to an empty arena A (60 cm × 60 cm) for 10 minutes each day in the same room. Rats that participated in the AB condition were habituated to both arena A and arena B (arena B was located in a different room) for 10 min on two consecutive days. For all AB rats, there was at least a 20 min delay between exposures to arena A and arena B. Thus, arena A was used for both the AA and AB groups, but arena B was only used for the AB group.
Figure 1 shows a summary of the object exploration procedure used for the AA and AB groups. On the day of the experiment, each rat was placed individually into arena A to freely explore 5 novel objects. After this initial exposure (epoch 1), the rat was returned to its home cage to rest for 20 min. Following the rest episode, the rat was either placed back into area A to explore the same 5 objects for another 5 min (AA), or transported to arena B, which was located in a different room (AB), to explore the same 5 objects. Halfway through the exploration time, if the rat had not explored each object, it was repositioned adjacent to the unexplored object to encourage exploration. This procedure was done in 3 aged rats (1 AA, 2 AB) and 2 young rats (1 AA, 1 AB) and the data obtained from these animals was not qualitatively different from the rats that were not moved.
Figure 1. Schematic of object exploration conditions.

A) After 2 days of habituation to arena A for 10 min/day, a rat in the AA condition was placed in the arena at the position marked by an “X” to freely explore 5 distinct novel objects (epoch 1). After 5 min, the rat was returned to its home cage to rest for 20 min, and then was returned to the same arena in the same room. The rat was again placed in arena A at the position marked by “X” and allowed to explore the same 5 objects for 5 min (epoch 2). B) After 2 days of habituation to both arena A and arena B for 10 min/day, a rat in the AB condition was placed in arena A for epoch 1 at the position marked by an “X” and allowed to freely explore 5 distinct novel objects (epoch 1). As in the AA group, the rat was then returned to the home cage to rest for 20 min. For the epoch 2 of exploration, the rat was taken to a different room and placed in arena B at the position marked by an “X” and allowed to freely explore the same 5 objects from epoch 1 for another 5 min.
The areas were cleaned with a 70% ethanol solution after each rat had completed the behavior and exploration was recorded by an overhead video recorder for offline analysis of exploration times. Exploration time was considered to be the periods when the rat was directing its nose towards an object within 2 cm. Other behaviors, such as rearing or climbing on objects were not considered to be exploration. An experimenter blind to the epoch, behavioral condition, and age group scored all of the object exploration times manually, and verified that all rats included in the current analyses explored each object at least once (that is, within the 5 min epoch the rat had to direct its nose towards each of the 5 objects within 2 cm). All rats were transported between the testing arena and colony room in a covered towel-lined pot, in order to reduce exposure to extraneous stimuli.
Immediately following the second epoch of object exploration, each rat was deeply anesthetized in a glass chamber containing a lethal concentration of isoflurane and sacrificed with a guillotine. In addition, both a negative and positive control groups were included in this experiment. Six young and 6 aged animals were sacrificed directly from the home cage to assess baseline expression of Arc under these negative control conditions (caged control; CC). For the positive control, 6 young and 5 aged rats received maximal electroconvulsive shock (MECS) 30 minutes prior to sacrifice. The handling of all animals and the experimental procedures were in accordance with the NIH Guide for the Care and Use of Laboratory Animals and approved by the University of Arizona's Institutional Animal Care and Use Committee.
Fluorescence in situ hybridization (FISH) and detection of Arc-positive neurons
Immediately following sacrifice, brains were rapidly extracted, hemi-sected, and quickly frozen in a cold solution of isopentane (approximately −50°C). Brains were stored at −70°C until cryosectioning. For each rat, only one hemisphere was analyzed and the hemisphere examined (left versus right) was counterbalanced across age group (young versus aged) and behavioral condition (AA versus AB). There was no effect of hemisphere on any of the variables examined (data not shown).
Twenty-micron thick coronal sections of one hemisphere were cut and arranged on a slide so that tissue from all groups was represented on a single slide. FISH was performed as previously described (Guzowski et al., 1999). Briefly, Arc antisense riboprobes were generated from the full length 3.0 kb Arc cDNA (Lyford et al., 1995) using a commercial transcription kit (Maxiscript; Ambion, Austin TX) and RNA labeling nucleotide mixes containing digoxigenin-labeled UTP (Roche Molecular Biochemicals, Nutley, NJ). The riboprobe was hybridized with the tissue overnight. The slides were treated with 2% H2O2 to quench any residual HRP activity. Subsequently, the digoxigenin-labeled Arc riboprobe was detected with anti-digoxigenin-HRP conjugate (Roche Applied Science, Indianapolis, IN) and revealed with cyanine-3 (CY3 Direct FISH; PerkinElmer Life Sciences, Emeryville, CA) or SuperGlo Red (Fluorescent Solutions, Augusta, GA) substrate kits. The nuclei were counterstained with SYTOX green nucleic acid stain (Molecular Probes, Eugene, OR).
Following the in situ hybridization, confocal image stacks were collected from 20-μm thick sections of tissue using a Zeiss 510 Metaseries laser scanning confocal microscope with a 40× oil objective. Photomultiplier tube assignments, pinhole size, and contrast values where kept constant for each brain region within a slide. Areas of analysis consisted of a 0.45 mm × 0.45 mm region of layer V of the PRC on the XY scale (indicated by the white squares in Figure 2) and were z-sectioned in −1.0 μm optical sections. Within a single tissue section, images were obtained from layer V of areas 36 and 35 of the PRC that was located between 4.0 and 6.5 mm posterior to bregma (Figure 2; Paxinos and Watson, 1998). Figure 2 shows areas of PRC that were sampled for catFISH analysis (white squares) in a coronal section through the rat brain (left panel) and a mosaic image of the PRC (right panel) labeled for Arc FISH detection in which the blue spots are cell bodies and red signal corresponds to Arc mRNA. In both images note the prominent rhinal sulcus, which served as a landmark for identifying the PRC. Images were collected from 3 different tissue sections for each rat for a total of 282 image stacks.
Figure 2. Perirhinal cortical areas sampled for confocal microscopy.

The left panel shows a coronal section of a rat brain (from Paxinos and Watson, 1998) with the PRC outlined (black box). Images were obtained between 4.0 and 6.5 mm posterior to bregma from layer V of PRC areas 36 and 35, as indicated by the white squares. The more dorsal white square marks the sample taken from area 36 and the ventral square is in area 35. The right panel is a mosaic image of the PRC with fluorescently labeled cell bodies (blue) and Arc mRNA (red) from a rat that explored objects.
Experimenters blind to experimental conditions counted cellular regions positive for Arc FISH labeling. Manual cell counts were obtained with the help of Metamorph software (version 5.0; Universal Imaging Corp, West Chester, PA) or ImageJ (Rasband, W.S., National Institutes of Health, Bethesda, MD). Additionally, for a proportion of the images, segmentation of cells, and neurons positive for FISH labeling were determined with help of in-house custom software (Chawla et al., 2004). The criteria used to determine neurons to be analyzed and for the detection of Arc were consistent between the 3 software applications, and the data obtained from the different programs were quantitatively indistinguishable.
The proportion of neurons positive for Arc expression and the cellular distribution of the mRNA was quantified as described previously (e.g., Burke et al., 2005; Guzowski et al., 2001; Rosi et al., 2006). Specifically, nuclei present in the median 20% of the planes in the z-stack were first identified and outlined. Nuclei out of this range were excluded, taking into consideration stereological concerns, and an increased likelihood of false negatives (West et al., 1991). Glial cell nuclei were identified by their small size (approximately 5 μm in diameter) and their bright, uniform counterstaining, and were not included in the analysis since IEG studies have shown that glial cells do not express Arc (Vazdarjanova et al., 2006). Cells were then evaluated for intranuclear Arc foci labeling (foci+), cytoplasmic Arc labeling (cyto+), or both intranuclear and cytoplasmic labeling (both+). A neuron was considered foci+ if Arc signal was present inside the nucleus for at least 3 planes and reached an intensity of 255 MESF units on at least one plane. A neuron was considered cyto+ if Arc signal was present within the 5 pixels adjacent to the nucleus on 3 or more optical planes and surrounded at least ∼25% of the nucleus. If both of these criteria were met within a single neuron then the cell was identified as both+. For all statistical tests the mean proportion of Arc neurons was calculated for each rat within areas 36 and 35, and the alpha level was set to 0.05.
Results
Morris swim task and object exploration behavior
For the 24 rats that participated in the object exploration conditions (AA and AB behavioral groups), the mean performance of the aged rats on the spatial version of the Morris swim task was significantly worse than the performance of the young rats. Figure 3A shows the mean CIPL (Gallagher et al., 1993) for the 12 aged rats (grey circles), and the 12 young rats (black circles) that participated in the object exploration conditions. All animals were tested over 4 days with 6 spatial trials on each day. As reported previously (e.g., Barnes et al., 1997), the old rats had a significantly longer mean CIPL scores, compared with the young rats (F[1,20] = 7.37, p<0.01; repeated-measures ANOVA). Planned simple contrasts revealed that performance on day four was significantly better than on all proceeding days (p < 0.01 for all comparisons), demonstrating that all rats showed some learning of the location of the platform over time. This suggests that the young rats used in this study had, on average, better spatial memory than did the aged group. Importantly, there was no significant difference in the performance of the rats assigned to the AA versus AB behavioral conditions (F[1,20] = 0.01, p = 0.91; repeated-measures ANOVA), as well as no significant interaction between age and behavioral group (F[1,20] = 0.07, p = 0.80; repeated-measures ANOVA).
Figure 3. Morris swim task and object exploration behavior.

(A) The X-axis is the day of testing and the Y-axis is the mean corrected integrated path length (CIPL) score. Higher CIPL scores indicate longer path lengths to reach the escape platform. All rats completed 4 days of spatial trials (solid lines) in which the platform was hidden below the surface of the water. These spatial trials were followed by 2 days of visually-cued trials in which the platform was visible (dashed lines). During the spatial trials, the aged (grey) rats had significantly longer CIPL scores compared with the young (black) rats (F[3,60] = 13.79, p<0.001; repeated-measures ANVOA). During the 2 days of visual testing, when the platform was raised above the surface of the water, there was no significant difference between the performances of young versus aged rats (F[1,20] = 1.14, p = 0.29; repeated-measures ANOVA). Error bars represent +/−1 standard error of the mean. (B) The X-axis indicates the epoch and behavioral condition and the Y-axis is the total amount of time spent exploring the 5 objects for epoch 1 (grey) and epoch 2 (white). Both the young and aged rats spent significantly more time exploring the 5 objects during epoch 1 compared to epoch 2 (F[1,20] = 24.77, p < 0.001; repeated-measures ANOVA). The reduction in exploration time between epochs did not interact significantly with age group (F[1,20] = 0.52, p = 0.48; repeated-measures ANOVA), or behavioral condition F[1,20] = 0.12, p = 0.73; repeated-measures ANOVA). Error bars represent +/− standard error of the mean and asterisks indicate statistical significance.
During the visual trials of the Morris swim task the platform was raised slightly above the surface of the water. When rats could locate the platform visually, there was no significant difference between the performances of young versus aged rats (F[1,20] = 1.14, p>0.29; repeated-measures ANOVA), indicating that the age groups had comparable visual acuity. There was also no significant difference in the performance of rats assigned to each behavioral condition (F[1,20] = 0.40, p>0.53; repeated-measures ANOVA). Together the Morris swim task data indicate that the aged rats had spatial memory impairments relative to the young animals, but that none of the rats that participated in the object exploration conditions were blind.
All rats explored each object at least once in both the first and second epochs of behavior. The total amount of time spent exploring all objects during epoch 1 and epoch 2 for the young and aged rats is shown in Figure 3B. The rats spent significantly more time exploring the 5 objects during epoch 1 compared to epoch 2 (F[1,20] = 24.77, p < 0.001; repeated-measures ANOVA). The reduction in exploration time between epochs did not interact significantly with age group (F[1,20] = 0.52, p = 0.48; repeated-measures ANOVA), or behavioral condition F[1,20] = 0.12, p = 0.73; repeated-measures ANOVA). These data indicate that both the young and aged rats behaved as if they recognized that the objects were familiar during the second epoch of behavior and this did not vary according to behavioral condition. Importantly, this suggests that when there was only a 20 min delay between episodes of object exploration the rats were able to identify that the 5 objects have been previously experienced, even when the environment and testing arena had changed.
Arc expression in layer V of the PRC in young and aged rats: MECS and CC versus object exploration
A total of 20,964 neurons were included in these analyses. Figure 4 shows the mean number of neurons counted per rat in area 36 and area 35 for each behavioral condition in young (black) and aged (grey) rats. Importantly, there was no significant difference between age groups in the total number of cells counted (F[1, 78] = 1.89, p = 0.17). This is consistent with a previous report of no PRC neuron loss in advanced age (Rapp et al., 2002). Cell number also did not significantly differ between behavioral condition (F[3, 78] = 0.10, p = 0.96). Interestingly, area 36 had significantly more neurons than area 35 (F[1, 78] = 13.05, p < 0.01), which is consistent with the observation that pyramidal neurons in layer V of area 35 are larger and less densely packed than those in area 36 (Burwell, 2001).
Figure 4. Mean # of cells analyzed per rat.

The Y axis is the mean number of neurons included in the analysis of Arc expression plotted for the different subregions of perirhinal cortex (PRC; area 36 and area 35) and behavioral conditions in young (dark) and aged (light) rats. The mean number of cells counted per rat did not differ significantly between the young and aged rats (F[1, 78] = 1.89, p = 0.17) or between behavioral conditions (F[3, 78] = 0.10, p = 0.96). Area 36 had significantly more neurons than area 35 (F[1, 78] = 13.05, p < 0.01), however. Error bars represent +/− standard error of the mean.
Figure 5 shows example images from area 36 (top row) and area 35 (bottom row) for the AA (young and aged rats), CC and MECS conditions. The blue spots are nuclei counterstained with Sytox and the red corresponds to Arc mRNA. The CC group has low levels of Arc while the MECS animals have a high proportion of neurons that have Arc signal surrounding the nucleus.
Figure 5. Representative PRC images for the different behavioral conditions.

Eight different single planes taken from confocal image stacks analyzed for Arc catFISH for area 36 (top row) and area 35 (bottom row). Each column shows data from a different condition and blue spots are cell nuclei stained with Sytox counterstain and red signal corresponds to Arc mRNA. Note that the images from the CC rat (second panels from right) show lower levels of Arc signal while the MECS condition (right panels) images show relatively more Arc labeling. The images from the AA – young and AA – aged rats both have intermediate levels of Arc labeling.
Figure 6 shows the distribution of Arc mRNA in layer V of the PRC for area 36 (Figure 6A), area 35 (Figure 6B) and both areas together (Figure 6C). In order to examine the effects of behavioral condition (AA, AB, CC or MECS) on Arc mRNA expression in layer V of the PRC, data were submitted to a repeated-measures ANOVA with the within-subjects factor of Arc cellular location (foci+, cyto+, or both+) and the between-subjects factors of region of PRC (area 35 versus area 36), behavioral condition, and age group. Arc expression did not vary significantly between areas 35 and 36 (F[1,78]= 0.83, p = 0.37). Moreover, region did not interact significantly with any of the other factors (p > 0.4 for all comparisons), thus, for the remainder of analyses areas 36 and 35 were analyzed together.
Figure 6. The distribution ofArcin layer V of the PRC of young and aged rats.

The Y-axes show the percent of cells that were positively labeled for Arc foci (foci+; green), cytoplasm (cyto+; purple), or both (both+; yellow) in area 36 (A), area 35 (B), and both regions together (C) plotted against the different age groups and experimental conditions. Arc expression did not vary significantly between areas 35 and 36 (F[1,78] = 0.83, p = 0.37), but there were significantly more Arc positive neurons in the young rats compared to the aged animals for both the AA (p < 0.01) and AB conditions (p < 0.001). In the MECS group there was a significantly higher proportion of cyto+ neurons compared to the other groups (p < 0.01 for all comparisons). Moreover, in the young rats, both the AA and AB groups had a significantly higher proportion of neurons with both+ compared to foci+ or cyto+. This indicates that in the object exploration groups the majority of active neurons fired during both behavioral epochs. Finally, in the AB group there were significantly more foci+ neurons compared to cyto+ (p < 0.05), suggesting that changing the environmental context lead to an increase in active neural ensemble. Error bars represent +/− standard error of the mean and asterisks indicate statistical significance.
The between-subjects factor of behavioral condition (AA, AB, CC or MECS) had a significant effect on the pattern of Arc expression in PRC (F[3,78] = 58.54, p < 0.001). Post hoc analysis showed that there were significantly fewer Arc-positive neurons in the CC group relative to the other 3 conditions (p < 0.001 for all comparisons, Tukey), and significantly more Arc positive neurons in the MECS group compared the AA, AB and CC groups (p < 0.001 for all comparisons, Tukey). The proportion of Arc-positive neurons did not differ significantly between the AA and AB groups, however (p = 0.98, Tukey).
When Arc expression was compared between the two age groups, there were significantly more Arc-positive neurons in the young rats compared to the aged animals (F[1,78] = 12.03, p < 0.01). Moreover, the factor of age group interacted significantly with behavioral group (F[3,78] = 2.73, p < 0.05), indicating that the difference in Arc expression between young and old rats varied as a function of behavioral condition. Post hoc analysis showed that there was no significant difference in the proportion of cells expressing Arc between young and old animals for the MECS (p = 0.88) or the CC groups (p = 0.36). In contrast, the young rats had a significantly higher proportion of Arc-positive neurons, relative to the aged animals, for both the AA (p < 0.01) and AB conditions (p < 0.001). Together these data indicate that the baseline and maximum expression of Arc in layer V of the PRC does not differ as a function of age. Importantly, however, the proportion of cells that express Arc during object exploration is reduced in old animals.
When all groups were analyzed together there was a significant main effect of Arc location (F[2,156] = 26.45, p < 0.001), indicating that there were not equal proportions of neurons that met the classification for foci+, cyto+, or both+. Importantly, Arc location significantly interacted with behavioral condition (F[6,156]= 43.30, p < 0.001). This means that the cellular location of Arc varied significantly between the behavioral groups. Post hoc analysis showed that for the CC group there was a significantly reduced proportion of foci+, cyto+ and both+ neurons relative to the other groups (p < 0.01 for all comparisons). For the MECS group, which received seizure treatment to induce maximal Arc expression, there were significantly more cyto+ neurons compared to foci+ or both+ (p < 0.01 for both comparisons). This pattern of Arc expression in rats that were sacrificed 30 min after seizure induction is similar to what has been reported for CA1, CA3 and other cortical regions (e.g., Guzowski et al., 2001; Vazdarjanova et al., 2006). Finally, there was a significantly higher proportion of cyto+ neurons in the MECS group relative to the other behavioral conditions (p < 0.001 for all comparisons), which indicates that the seizure treatment reliably induced activity in PRC neurons 30 min prior to sacrifice. The distribution of Arc in the AA and AB conditions will be discussed more in the next section.
PRC Arc expression during object exploration in young and aged rats
Table 1 shows how the cellular distribution of Arc mRNA can be used to infer the activity history of principal cells following two 5 min epochs of behavior separated by 20 min. The same 5 objects were explored during epochs 1 and 2, therefore the objects were novel for the first epoch of exploration and relatively familiar during the second. Importantly, the exploration times of rats (Figure 3B) suggested that all of the animals behaved as if they recognized that the objects were familiar. If a response decrement in the activity of PRC neurons is the mnemonic mechanism for object recognition, then a higher proportion of neurons would be predicted to be active during the first epoch of behavior (cyto+). In order to test this hypothesis and examine the effects of age and environmental change on the distribution of Arc mRNA following two epochs of object exploration a repeated-measures ANOVA with the within-subjects factor of Arc cellular location (foci+, cyto+, or both+) and the between-subjects factors of exploration group (AA versus AB) and age group was run.
For both the AA and AB conditions, overall there was a significant difference in the proportion of foci+, cyto+, or both+ neurons (F[2,88] = 27.739, p < 0.001), and post hoc analysis indicated that there was a significantly higher proportion of both+ neurons compared to the proportion of foci+ and cyto+ neurons (p < 0.001 for both comparisons; simple contrast). Interestingly, there also a significant difference in the proportion of foci+ and cyto+ cells (p < 0.05; difference contrast), but this difference was in the opposite direction than was predicted by the response decrement hypothesis. Specifically, there was a higher proportion of neurons in layer V of the PRC with foci+ labeling relative to cyto+. Figure 7 shows the percent of foci+ (green) and cyto+ (pink) neurons for the different behavioral conditions and age groups. Behavioral condition (AA vs AB) had a significant effect on Arc labeling (F[2,88] = 6.83, p < 0.01) and post hoc analysis indicated that there was a significant increase in the proportion of foci+ neurons relative to cyto+ in the AB group (p < 0.01; Tukey) but not the AA group (p = 0.53). In addition, a direct comparison between the AA and AB group revealed that there was significantly more foci+ labeling in the AB compared the AA group (p < 0.01; Tukey), but no significant differences in the proportion of cells with cyto+ or both+ labeling (p > 0.15 for both comparisons; Tukey). This pattern of Arc distribution indicates that for both the AA and AB conditions the majority of active neurons fired during both epochs 1 and 2. Moreover, these data suggest that there was not a tendency for more neurons to express Arc during the exploration of novel objects (epoch 1) compared to when the objects were familiar (epoch 2). In fact, in the AB condition the pattern of Arc labeling suggested that more cells were active during the second epoch. This recruitment of new active neurons when the context changes could serve as a neural signal that a familiar stimulus is being encountered in a new place. Together these data do not support the idea that more PRC neurons are active in response to novel relative to familiar objects.
Figure 7. The effect of changing context on epoch 2 activity.

The percent of Arc positive neurons with foci+ and cyto+ labeling for the different age groups and behavioral conditions. In the young rats significantly more cells were foci+ in the AB relative to the AA group (p < 0.05; Tukey), but the percent of neurons with cyto+ labeling did not vary significantly as a function of behavioral condition (p = 0.81; Tukey). In contrast, for the aged rats behavioral condition did not significantly affect the percent of foci+ (p = 0.48; Tukey) or cyto+ (p = 0.63) neurons. Error bars represent +/− standard error of the mean and asterisks indicate statistical significance
Age group also had a significant effect on Arc distribution (F[1,88] = 33.967, p < 0.001). In both the AA and AB conditions, compared to the young rats, the aged rats had significantly fewer neurons with both+ Arc labeling (p < 0.001 for both comparisons), but there was no significant difference in the proportion foci+ (p > 0.7 for both comparisons), or cyto+ (p > 0.9 for both comparisons) neurons between age groups. This suggests that the aged rats had fewer neurons that were active during both epochs of behavior. Interestingly, in the young rats there were significantly more cells with foci+ labeling in the AB relative to the AA group (p < 0.05; Tukey), but no significant difference in the percent of neurons with cyto+ Arc between these behavioral conditions (p = 0.81; Tukey). In contrast, for the aged rats the pattern of Arc expression did not vary significantly as a function of behavioral condition and there was no difference in the percent of foci+ (p = 0.48; Tukey) or cyto+ (p = 0.63) neurons (see Figure 7).
The increased proportion of cells in the AB group with foci+ labeling suggests that in this group more neurons were active during the second epoch of object exploration relative to the first. To test this idea further a repeated-measures ANOVA was used to directly compare the proportion of active cells during epoch 1 (cyto+ and both+) and epoch 2 (foci+ and both+) with the between-subjects factors of age and object exploration group (AA versus AB). Figure 8A shows the percent of active neurons during epoch 1 (grey) and epoch 2 (white) for the different behavioral conditions and age groups. There was a significant interaction effect of behavioral condition and epoch on the percent of active cells (F[1,44] = 8.51, p < 0.01; repeated-measures ANOVA), but this did not significantly interact with age group (F[1,44] = 0.19, p = 0.67; repeated-measures ANOVA). Therefore, the age groups could not be analyzed separately for additional post hoc tests even though the difference in foci+ labeling between behavioral conditions only reached statistical significance in the young rats (see above). Post hoc analysis indicated this interaction effect was due to the AB group showing a significantly larger difference in the proportion of active cells between epochs compared to the AA group (p < 0.01; Tukey). Importantly, behavioral condition (AA vs AB) did not have a significant effect on the proportion of active cells during epoch 1 (F[1,22] = 2.33, p = 0.15). These data lend additional support for the idea that when an environmental context change occurs between episodes of exploring the same objects, additional neurons in layer V of the PRC are recruited to potentially encode the new context.
Figure 8. With epoch activity and ensemble overlap in young and aged rats.

(A) The percent of active neurons (Y-axis) during epoch 1 (grey; cyto+ and both+) and epoch 2 (white; foci+ and both+) for the different age groups and behavioral conditions (X-axis). The AB group showed a significantly larger difference in the proportion of active cells between epochs 1 and 2 compared to the AA group (p < 0.01; Tukey). (B) The Y-axis shows the similarity scores of area 36 (dark purple) and area 35 (light purple) for the different age groups and object exploration conditions (X-axis). There was no significant effect of behavioral condition (F[1,40] = 2.14, p = 0.15), or region (F[1,40] = 0.01, p = 0.96) on similarity score. The similarity score was significantly reduced in the aged compared to the young rats, however (F[1,40] = 19.10, p < 0.001). Error bars represent +/− standard error of the mean and asterisks indicate statistical significance
A calculation of similarity scores (Vazdarjanova and Guzowski, 2004) can also be used to characterize the cellular distribution of Arc (foci+, cyto+, or both+) with a single value that provides a quantitative measure of the population overlap of cell activity patterns between the two different epochs of behavior. The similarity score provides a better means for comparing overlapping activity patterns across brain regions and age groups because it controls for differences in cell number and overall proportion of positive cells. The similarity score is derived with the following formula: diff (E1E2)/(least epoch – p(E1E2). E1 and E2 are the proportion of active cells during epoch 1 (cyto+ and both+) and epoch 2 (foci+ and both+), respectively. The proportion of cells active during E1 × proportion of cells active during E2 is p(E1E2), which is the probability of a neuron being active during both epochs, assuming that the two epochs of behavior activate statistically independent neural ensembles. The value for diff (E1E2) is calculated from proportion of both+ cells – p(E1E2), and is the measure of deviation from the independence hypothesis. Finally, ‘least epoch’ is the proportion of Arc positive cells for the behavioral epoch with the smallest percent of active neurons. A value of 0 indicates that two statistically independent neural ensembles were activated during the two epochs (i.e., the proportion of cells active during both epochs was not greater than that expected by chance). A value of 1 indicates that identical neural ensembles were activated during the two epochs of behavior.
Figure 8B shows the mean similarity scores calculated from areas 36 (dark purple) and 35 (light purple) in young and aged rats for the different behavioral conditions. There was no significant effect of behavioral condition (AA versus AB; F[1,20] = 1.85, p = 0.19), or region (36 versus 35; F[1,20] = 0.02, p = 0.89; repeated-measures ANOVA) on similarity score. This indicates that the ensemble overlap in layer V of the PRC was similar between two epochs of exploring the same objects even when the environment changed, and this was observed in both areas 35 and 36. Age group, however, did have a significant effect on similarity score (F[1,20] = 5.77, p < 0.05), with the aged rats having significantly less ensemble overlap between epochs of object exploration compared to the young animals.
Arc expression in the PRC, spatial memory and exploratory behavior
The PRC has been shown to be involved in the encoding of spatial context in fear conditioning tasks (Bucci et al., 2000; Kent and Brown, 2012 in this issue), and lesion data are equivocal as to whether or not this structure is necessary for normal spatial memory (for review, see Aggleton et al., 2004). Thus, it is possible that Arc expression could correlate with Morris swim task performance. To see whether or not Arc expression in layer V of the PRC showed any relationship with spatial memory the mean CIPL value for Day 4 of spatial testing was compared with the mean proportion of cells expressing Arc and the similarity score. Because there were no differences between regions (area 36 versus area 35) and exploration conditions (AA versus AB) these variables were grouped together and Pearson's correlation coefficients were calculated. Performance on the spatial version of the Morris swim task did not significantly correlate with the proportion of cells that expressed Arc or the similarity score in either the young (p > 0.1 for both comparisons) or the aged rats (p > 0.3 for both comparisons). The lack of a relationship between PRC Arc expression and Morris swim task performance is consistent with previous reports that PRC lesions do not produce deficits in spatial memory (e.g., Burwell et al., 2004; Machin et al., 2002).
In order to examine whether or not differences in object exploration time contributed to Arc expression, the proportion of cells active during epoch 1 (cyto+ and both+) and epoch 2 (foci+ and both+) was compared to the total amount of time rats spent exploring objects during epochs 1 and 2. Figure 9A shows a scatter plot of exploration times (X axis) versus percent of Arc positive neurons. There was no significant correlation between exploration time and the mean proportion of neurons expressing Arc in either the young (r[23] = 0.11, p = 0.59) or the aged rats (r[23] = 0.23, p = 0.26). This suggests that exploring each object once (see Methods) was enough to induce Arc expression and that increased object exploration time did not produce larger populations of active cells.
Figure 9. Object exploration andArcexpression.

(A) The Y-axis shows the percent of Arc positive neurons as a function of total object exploration time (X-axis) during epoch 1 (squares) and epoch 2 (triangles) for young (dark) and aged (light) rats. There was not a significant correlation between exploration time and the mean proportion of neurons expressing Arc in either the young (r[23] = 0.11, p = 0.59) or the aged rats (r[23] = 0.23, p = 0.26). (B) The Y-axis shows the similarity score plotted against the reduction in object exploration time between epochs 1 and 2 for the young (dark) and aged rats (light). Similarity score was not significantly correlated with the difference in object exploration time between epochs in either the young (r[12] = −0.05, p = 0.86), or the aged rats (r[12] = −0.21, p = 0.48).
Finally, because rats spent less time exploring objects during the second epoch of behavior relative to the first it is conceivable that this reduced exploratory behavior could contribute to lower similarity scores. In order to examine this possibility further the difference in exploration time between epochs 1 and 2 was compared to the similarity score for each rat (Figure 9B). Interestingly, similarity score was not significantly correlated with the difference in object exploration time between epochs in either the young (r[12] = −0.05, p = 0.86), or the aged rats (r[12] = −0.21, p = 0.48). These data also support the idea that it was sufficient for a rat to briefly explore an object to induce Arc expression, and that differences in the amount of time exploring an object did not significantly affect the patterns or distribution of Arc in layer V of the PRC.
Discussion
Three novel findings arose from the present experiment. First, within an age group, a significant reduction was not observed in the proportion of perirhinal cortical (PRC) cells that expressed Arc after repeated exposures to the same objects. This indicates that there was no change in the cellular participation of circuits as objects went from being novel to familiar. Aged rats, however, had a reduced proportion of cells in layer V of the PRC that expressed Arc mRNA during exposure to 3-dimensional objects, without a change in the total number of cells counted. Finally, it appears that PRC cells are primarily responsive to objects, as the same population of neurons was active to the same set of objects even when the room and apparatus was changed (different place, same objects). There was, however, evidence that a subset of PRC neurons was responsive to the new environmental context. Specifically, in the AB group there was an increase in the proportion of cells with foci+ labeling, indicating that additional neurons became active during the second epoch of behavior. This recruitment of cells into the active neural ensemble when the environment was changed could help signal that familiar stimuli are being experienced in a new context.
The lack of novelty modulation in layer V PRC neurons
A long-standing hypothesis has been that recognition memory is supported by a response decrement in the activity of PRC neurons when a stimulus goes from novel to familiar (Zhu and Brown, 1995; Zhu et al., 1995a). This theory has gained momentum from imaging studies that used c-fos protein as a marker of neural activity (Wan et al., 1999; Warburton et al., 2005; Zhu et al., 1995b; Zhu et al., 1997). Specifically, in these experiments rats nose-poked as novel images were presented to one eye and familiar images were displayed to the other eye. Thus, one hemisphere received novel input while the other received familiar input. In the PRC there were more c-fos positive cells in the hemisphere that was presented with images of novel items compared to the hemisphere presented with images of familiar items (Wan et al., 1999).
In contrast to the imaging studies that used c-fos protein as an activity marker, in the current experiment there was no effect of relative stimulus novelty on the expression of Arc. Specifically, when rats freely explored novel objects for two 5 min epochs separated by 20 min the proportion of neurons that were active during the second epoch of exploration was not reduced relative to the first. Because the transcription of Arc is regulated by the firing of Ca2+/calmodulin-dependent protein kinase II-positive principal cells (Vazdarjanova et al., 2006), these data suggest that neuron activity in layer V of the PRC is not modulated by novelty. This is in agreement with recent electrophysiology data that have reported no reduction in PRC neuron firing rates during exposure to novel versus familiar stimuli (Burke et al., 2012b; Thome et al., 2012 in this issue; Woloszyn and Sheinberg, 2012).
There are several possible explanations for the apparent discrepancy between the current experiment and c-fos imaging studies. The use of c-fos protein as a label for neuron activity during a given episode may be problematic. Glutamate binding to metabotropic receptors on astrocytes can also lead to c-fos expression in glia (Edling et al., 2007). Therefore, it is unlikely that only neurons were included in these analyses. Additionally, it is known that immediate-early gene expression can be decoupled from neuronal activity under certain circumstances, and a neuron can be active without initiating the signaling cascades that lead to the induction of these genes (Fletcher et al., 2006; Guzowski et al., 2006). Specifically, this electro-transcriptional decoupling is observed in the hippocampus after a massed exposure to an environment. The training used by Wan and colleagues (1999) involved presenting rats with the same visual stimuli many times in a day over the course of several days, and is a ‘massed’ exposure. Therefore, in the absence of electrophysiological confirmation, it remains a possibility that some cells did not express c-fos because of this decoupling, and therefore the reduction may not necessarily reflect reduced cell spiking. In contrast to c-fos, Arc is not expressed by interneurons or glia (Vazdarjanova et al., 2006). Moreover, the object exploration procedure used in the current experiment only involved two episodes of exploration. While this was sufficient object exposure to measure recognition behavior in the rats reliably (Figure 4), it is significantly less than the ‘massed’ exposure paired-viewing procedure in the c-fos imaging studies (Wan et al., 1999) that may induce electro-transcriptional decoupling (Guzowski et al., 2006). Thus, the current data along with recent electrophysiological recordings (Burke et al., 2012b in this issue) demonstrate that when rats actively move through space, freely exploring 3-dimensional objects, novelty does not affect circuit composition in perirhinal cortex.
The impact of advanced age on layer V PRC neuron activity
The second major finding is that following two epochs of object exploration, a lower proportion of neurons in layer V of the PRC were positive for Arc mRNA in aged compared to young rats. This observation supports behavioral data suggesting that the PRC is vulnerable to the process of normal aging (Burke et al., 2012a; Burke et al., 2011; Burke et al., 2010) and point to a potential etiology for age-associated declines in PRC-dependent behaviors.
Following the free exploration of 5 objects ∼23% of layer V PRC neurons were positive for Arc mRNA in the young rats. Because the transcription of Arc is tightly regulated by the activity of principal cells, those cells that were positive for Arc mRNA are likely to be those neurons that were active in response to the objects. Although, this number is less than the ∼37% of cells that showed ‘objects fields’ during electrophysiological recordings obtained from rats that traversed a track with 8 objects (Burke et al., 2012b in this issue), this difference could be due to the lower number of objects that were explored and differences in free exploration versus exploring objects on a spatially more constrained track.
Importantly, in the aged rats only ∼15% of layer V PRC neurons expressed Arc mRNA. Moreover, the aged rats had a significant reduction in the amount of ensemble overlap in active layer V PRC neurons between epochs 1 and 2 as indicated by the lower proportion of cells with both+ Arc labeling (Figure 6) and the reduced similarity score relative to the young rats (Figure 8B). Interestingly, this reduction in overlap did not correlate with a reduced ability to recognize objects during the second epoch of object exploration (Figure 9B) as these old animals displayed behavior consistent with object recognition that was comparable to what was observed in the young rats (Figure 3B). Thus, these data suggest that the amount of ensemble overlap in the aged rats was sufficient to support object recognition but may contribute to difficulty in discriminating novel stimuli from those that are familiar. In other words, recognition memory deficits in old animals may not be due to aged rats “forgetting” the stimuli that have been experienced. Rather, these impairments are likely to be due to aged rats being unable to discriminate novel objects from those that are familiar (Burke et al., 2010), which is comparable to rats with PRC lesions (McTighe et al., 2010). Thus, it is conceivable that the lower proportion of neurons expressing Arc in layer V of the PRC reflect a reduction in the responsiveness of this structure to objects, which could reduce the capacity of the PRC network to represent distinct stimuli uniquely.
If network capacity is defined as the number of discrete states available to represent different stimuli, then in order for a population of neurons to have adequate capacity for storing distinct representations of different stimuli, three criteria should be satisfied (McNaughton and Morris, 1987). First, there should be extensive connectivity between the neurons in the network. The PRC at least partially satisfies this criterion as the intrinsic connections of this region are dense (Burwell and Amaral, 1998). Second, the activity responses of different neurons in the network across different stimulus sets should not be more correlated than expected by chance (i.e., they should be orthogonal). The orthogonality requirement is empirically supported by the observation that before stimuli are learned, or associated with other stimuli, PRC neurons do not show correlated activity patterns (Erickson et al., 2000). Finally, an efficient population code is maximally distributed; that is, half of the available neurons are used to code each stimulus set (e.g., McNaughton and Morris, 1987). Figure 10 shows how the capacity of a theoretical network is affected by increasing or decreasing the number of neurons that are active when a stimulus set is presented. Figure 10 illustrates how the aged PRC could potentially have a reduced capacity to represent distinct images uniquely. This would increase the tendency of old animals to falsely identify novel objects as familiar (Burke et al., 2010), and could contribute to difficulty in discriminating between objects that share features (i.e., pattern separation; Burke et al., 2011).
Figure 10. Population coding in the PRC.

The capacity of a hypothetical network to represent distinct stimuli based on the degree to which the population code is distributed. The X-axis is the number of neurons (r) in a set of n neurons. Network capacity is maximal when half of the neurons are activated by a given stimulus. In the PRC cortex fewer neurons are activated by a stimulus set in aged (purple) compared to young (green) rats. This could have the result of decreasing the capacity of the aged PRC to represent different stimuli distinctively.
An alternative explanation for the reduced proportion of Arc-positive neurons in layer V of PRC in aged compared to young rats would be a decrease in the ability of an active cell to express Arc. In the hippocampus Arc expression is critical for the maintenance of plasticity (Guzowski et al., 2000) and impaired plasticity in the PRC has been linked to object recognition deficits (Warburton et al., 2005). Although plasticity in the PRC of aged rats has not been characterized, it is possible that there are age-associated changes in the expression of immediate-early genes, occurring independently of cellular activity, that contribute to recognition memory deficits over the lifespan. These two possibilities need to be explored further with electrophysiological recordings.
Changing environmental context and layer V PRC ensemble dynamics
Changing the environmental context, lead to an increase in the proportion of active neurons in layer V of the PRC during exploration of familiar objects in the new environmental context (Figures 7 and 8A). These data support an idea that the PRC does receive some information regarding spatial context that can be used to update the active neural ensemble, and are consistent with contextual fear conditioning studies that indicate that PRC lesions produce deficits in conditioning to context (e.g., Bucci et al., 2000; Burwell et al., 2004; Kent and Brown, 2012 in this issue). Both the hippocampus and the postrhinal cortex are involved in the encoding of context (Norman and Eacott, 2005; Piterkin et al., 2008), and activity in the hippocampus is sensitive to changes in environmental context (e.g., Guzowski et al., 1999; O'Keefe and Conway, 1978; Vazdarjanova and Guzowski, 2004). These two structures project directly to both deep and superficial layers of the PRC. Because the PRC does receive information regarding spatial context, it is not surprising that a subset of PRC neurons would be sensitive to changes in the environment in which objects are experienced.
There was no effect of changing the environment on the ensemble overlap of active cells between epochs, however (Figure 8B). This may provide a neural mechanism for an animal's ability to recognize familiar objects in new contexts (Burke et al., 2010; Piterkin et al., 2008). Thus, populations of cells must exist that are activated by a given stimulus regardless of the context that it is experienced in.
Summary
The current data support a growing body of data that the PRC is among the brain structures vulnerable to normative aging processes (Burke et al., 2012a; Burke et al., 2011; Burke et al., 2010; Liu et al., 2008; Liu et al., 2009; Moyer et al., 2009; Toner et al., 2009). Importantly, the reduced proportion of neurons in layer V of the PRC that express Arc also point to a potential mechanism for aged animals' difficulty in discriminating between novel and familiar stimuli (Burke et al., 2010).
Acknowledgments
This work was supported by the McKnight Brain Research Foundation, and NIH grants AG003376, NS054465, and HHMI5205889. Additionally, we would like to thank Andrew Maurer, Jeri Metzler, Kathy Olson, Monica Chawla, Michael Montgomery, Michelle Caroll, and Luann Snyder for help with completing this manuscript.
References
- Aggleton JP, Kyd RJ, Bilkey DK. When is the perirhinal cortex necessary for the performance of spatial memory tasks? Neurosci Biobehav Rev. 2004;28(6):611–24. doi: 10.1016/j.neubiorev.2004.08.007. [DOI] [PubMed] [Google Scholar]
- Barnes CA, Rao G, McNaughton BL. Functional integrity of NMDA-dependent LTP induction mechanisms across the lifespan of F-344 rats. Learn Mem. 1996;3(2-3):124–37. doi: 10.1101/lm.3.2-3.124. [DOI] [PubMed] [Google Scholar]
- Barnes CA, Suster MS, Shen J, McNaughton BL. Multistability of cognitive maps in the hippocampus of old rats. Nature. 1997;388(6639):272–5. doi: 10.1038/40859. [DOI] [PubMed] [Google Scholar]
- Bartko SJ, Winters BD, Cowell RA, Saksida LM, Bussey TJ. Perceptual functions of perirhinal cortex in rats: zero-delay object recognition and simultaneous oddity discriminations. J Neurosci. 2007;27(10):2548–59. doi: 10.1523/JNEUROSCI.5171-06.2007. [DOI] [PMC free article] [PubMed] [Google Scholar]
- Brown MW, Aggleton JP. Recognition memory: what are the roles of the perirhinal cortex and hippocampus? Nat Rev Neurosci. 2001;2(1):51–61. doi: 10.1038/35049064. [DOI] [PubMed] [Google Scholar]
- Bucci DJ, Phillips RG, Burwell RD. Contributions of postrhinal and perirhinal cortex to contextual information processing. Behav Neurosci. 2000;114(5):882–94. doi: 10.1037//0735-7044.114.5.882. [DOI] [PubMed] [Google Scholar]
- Burke SN, Chawla MK, Penner MR, Crowell BE, Worley PF, Barnes CA, McNaughton BL. Differential encoding of behavior and spatial context in deep and superficial layers of the neocortex. Neuron. 2005;45(5):667–74. doi: 10.1016/j.neuron.2005.01.042. [DOI] [PubMed] [Google Scholar]
- Burke SN, Lee R, Barnes CA. Characterizing cognitive aging of recognition memory and related processes in animal models and in humans. Frontiers in Aging Neuroscience. 2012a doi: 10.3389/fnagi.2012.00015. in press. [DOI] [PMC free article] [PubMed] [Google Scholar]
- Burke SN, Maurer AP, Hartzell AL, Nematollahi S, Uprety AR, Wallace JL, Barnes CA. Representation of 3-Dimensional Objects by the Rat Perirhinal Cortex. Hippocampus accepted. 2012b doi: 10.1002/hipo.22060. [DOI] [PMC free article] [PubMed] [Google Scholar]
- Burke SN, Wallace JL, Hartzell AL, Nematollahi S, Plange K, Barnes CA. Age-Associated Deficits in Pattern Separation Functions of the Perirhinal Cortex: A Cross-species Consensus. Behavioral Neuroscience. 2011 doi: 10.1037/a0026238. in press. [DOI] [PMC free article] [PubMed] [Google Scholar]
- Burke SN, Wallace JL, Nematollahi S, Uprety AR, Barnes CA. Pattern separation deficits may contribute to age-associated recognition impairments. Behav Neurosci. 2010;124(5):559–73. doi: 10.1037/a0020893. [DOI] [PMC free article] [PubMed] [Google Scholar]
- Burwell RD. Borders and cytoarchitecture of the perirhinal and postrhinal cortices in the rat. J Comp Neurol. 2001;437(1):17–41. doi: 10.1002/cne.1267. [DOI] [PubMed] [Google Scholar]
- Burwell RD, Amaral DG. Perirhinal and postrhinal cortices of the rat: interconnectivity and connections with the entorhinal cortex. J Comp Neurol. 1998;391(3):293–321. doi: 10.1002/(sici)1096-9861(19980216)391:3<293::aid-cne2>3.0.co;2-x. [DOI] [PubMed] [Google Scholar]
- Burwell RD, Saddoris MP, Bucci DJ, Wiig KA. Corticohippocampal contributions to spatial and contextual learning. J Neurosci. 2004;24(15):3826–36. doi: 10.1523/JNEUROSCI.0410-04.2004. [DOI] [PMC free article] [PubMed] [Google Scholar]
- Chawla MK, Lin G, Olson K, Vazdarjanova A, Burke SN, McNaughton BL, Worley PF, Guzowski JF, Roysam B, Barnes CA. 3D-catFISH: a system for automated quantitative three-dimensional compartmental analysis of temporal gene transcription activity imaged by fluorescence in situ hybridization. J Neurosci Methods. 2004;139(1):13–24. doi: 10.1016/j.jneumeth.2004.04.017. [DOI] [PubMed] [Google Scholar]
- Cole AJ, Saffen DW, Baraban JM, Worley PF. Rapid increase of an immediate early gene messenger RNA in hippocampal neurons by synaptic NMDA receptor activation. Nature. 1989;340(6233):474–6. doi: 10.1038/340474a0. [DOI] [PubMed] [Google Scholar]
- Desimone R. Neural mechanisms for visual memory and their role in attention. Proc Natl Acad Sci U S A. 1996;93(24):13494–9. doi: 10.1073/pnas.93.24.13494. [DOI] [PMC free article] [PubMed] [Google Scholar]
- Edling Y, Ingelman-Sundberg M, Simi A. Glutamate activates c-fos in glial cells via a novel mechanism involving the glutamate receptor subtype mGlu5 and the transcriptional repressor DREAM. Glia. 2007;55(3):328–40. doi: 10.1002/glia.20464. [DOI] [PubMed] [Google Scholar]
- Erickson CA, Jagadeesh B, Desimone R. Clustering of perirhinal neurons with similar properties following visual experience in adult monkeys. Nat Neurosci. 2000;3(11):1143–8. doi: 10.1038/80664. [DOI] [PubMed] [Google Scholar]
- Fletcher BR, Calhoun ME, Rapp PR, Shapiro ML. Fornix lesions decouple the induction of hippocampal arc transcription from behavior but not plasticity. J Neurosci. 2006;26(5):1507–15. doi: 10.1523/JNEUROSCI.4441-05.2006. [DOI] [PMC free article] [PubMed] [Google Scholar]
- Gallagher M, Burwell R, Burchinal M. Severity of spatial learning impairment in aging: development of a learning index for performance in the Morris water maze. Behav Neurosci. 1993;107(4):618–26. doi: 10.1037//0735-7044.107.4.618. [DOI] [PubMed] [Google Scholar]
- Guzowski JF, Lyford GL, Stevenson GD, Houston FP, McGaugh JL, Worley PF, Barnes CA. Inhibition of activity-dependent arc protein expression in the rat hippocampus impairs the maintenance of long-term potentiation and the consolidation of long-term memory. J Neurosci. 2000;20(11):3993–4001. doi: 10.1523/JNEUROSCI.20-11-03993.2000. [DOI] [PMC free article] [PubMed] [Google Scholar]
- Guzowski JF, McNaughton BL, Barnes CA, Worley PF. Environment-specific expression of the immediate-early gene Arc in hippocampal neuronal ensembles. Nat Neurosci. 1999;2(12):1120–4. doi: 10.1038/16046. [DOI] [PubMed] [Google Scholar]
- Guzowski JF, McNaughton BL, Barnes CA, Worley PF. Imaging neural activity with temporal and cellular resolution using FISH. Curr Opin Neurobiol. 2001;11(5):579–84. doi: 10.1016/s0959-4388(00)00252-x. [DOI] [PubMed] [Google Scholar]
- Guzowski JF, Miyashita T, Chawla MK, Sanderson J, Maes LI, Houston FP, Lipa P, McNaughton BL, Worley PF, Barnes CA. Recent behavioral history modifies coupling between cell activity and Arc gene transcription in hippocampal CA1 neurons. Proc Natl Acad Sci U S A. 2006;103(4):1077–82. doi: 10.1073/pnas.0505519103. [DOI] [PMC free article] [PubMed] [Google Scholar]
- Kent B, Brown TH. Dual functions of perirhinal cortex in fear conditioning. Hippocampus. 2012 doi: 10.1002/hipo.22058. in press. [DOI] [PMC free article] [PubMed] [Google Scholar]
- Liu P, Gupta N, Jing Y, Zhang H. Age-related changes in polyamines in memory-associated brain structures in rats. Neuroscience. 2008;155(3):789–96. doi: 10.1016/j.neuroscience.2008.06.033. [DOI] [PubMed] [Google Scholar]
- Liu P, Jing Y, Zhang H. Age-related changes in arginine and its metabolites in memory-associated brain structures. Neuroscience. 2009;164(2):611–28. doi: 10.1016/j.neuroscience.2009.08.029. [DOI] [PubMed] [Google Scholar]
- Lyford GL, Yamagata K, Kaufmann WE, Barnes CA, Sanders LK, Copeland NG, Gilbert DJ, Jenkins NA, Lanahan AA, Worley PF. Arc, a growth factor and activity-regulated gene, encodes a novel cytoskeleton-associated protein that is enriched in neuronal dendrites. Neuron. 1995;14(2):433–45. doi: 10.1016/0896-6273(95)90299-6. [DOI] [PubMed] [Google Scholar]
- Machin P, Vann SD, Muir JL, Aggleton JP. Neurotoxic lesions of the rat perirhinal cortex fail to disrupt the acquisition or performance of tests of allocentric spatial memory. Behav Neurosci. 2002;116(2):232–40. [PubMed] [Google Scholar]
- McNaughton BL, Morris RG. Hippocampal synaptic enhancement and information storage within a distributed memory system. Trends in Neurosciences. 1987;10(10):408–415. [Google Scholar]
- McTighe SM, Cowell RA, Winters BD, Bussey TJ, Saksida LM. Paradoxical false memory for objects after brain damage. Science. 2010;330(6009):1408–10. doi: 10.1126/science.1194780. [DOI] [PubMed] [Google Scholar]
- Morgan JI, Cohen DR, Hempstead JL, Curran T. Mapping patterns of c-fos expression in the central nervous system after seizure. Science. 1987;237(4811):192–7. doi: 10.1126/science.3037702. [DOI] [PubMed] [Google Scholar]
- Moyer JR, Jr, Furtak SC, McGann JP, Brown TH. Aging-related changes in calcium-binding proteins in rat perirhinal cortex. Neurobiol Aging. 2009;32(9):1693–706. doi: 10.1016/j.neurobiolaging.2009.10.001. [DOI] [PMC free article] [PubMed] [Google Scholar]
- Norman G, Eacott MJ. Dissociable effects of lesions to the perirhinal cortex and the postrhinal cortex on memory for context and objects in rats. Behav Neurosci. 2005;119(2):557–66. doi: 10.1037/0735-7044.119.2.557. [DOI] [PubMed] [Google Scholar]
- O'Keefe J, Conway DH. Hippocampal place units in the freely moving rat: why they fire where they fire. Exp Brain Res. 1978;31(4):573–90. doi: 10.1007/BF00239813. [DOI] [PubMed] [Google Scholar]
- Piterkin P, Cole E, Cossette MP, Gaskin S, Mumby DG. A limited role for the hippocampus in the modulation of novel-object preference by contextual cues. Learn Mem. 2008;15(10):785–91. doi: 10.1101/lm.1035508. [DOI] [PubMed] [Google Scholar]
- Rapp PR, Deroche PS, Mao Y, Burwell RD. Neuron number in the parahippocampal region is preserved in aged rats with spatial learning deficits. Cereb Cortex. 2002;12(11):1171–9. doi: 10.1093/cercor/12.11.1171. [DOI] [PubMed] [Google Scholar]
- Rosi S, Vazdarjanova A, Ramirez-Amaya V, Worley PF, Barnes CA, Wenk GL. Memantine protects against LPS-induced neuroinflammation, restores behaviorally-induced gene expression and spatial learning in the rat. Neuroscience. 2006;142(4):1303–15. doi: 10.1016/j.neuroscience.2006.08.017. [DOI] [PubMed] [Google Scholar]
- Shen J, Barnes CA, Wenk GL, McNaughton BL. Differential effects of selective immunotoxic lesions of medial septal cholinergic cells on spatial working and reference memory. Behav Neurosci. 1996;110(5):1181–6. doi: 10.1037//0735-7044.110.5.1181. [DOI] [PubMed] [Google Scholar]
- Thome A, Erickson C, Lipa P, Barnes CA. Differential effects of experience on tuning properties of macaque MTL neurons in a passive viewing task. Hippocampus accepted. 2012 doi: 10.1002/hipo.22070. [DOI] [PMC free article] [PubMed] [Google Scholar]
- Toner CK, Pirogovsky E, Kirwan CB, Gilbert PE. Visual object pattern separation deficits in nondemented older adults. Learn Mem. 2009;16(5):338–42. doi: 10.1101/lm.1315109. [DOI] [PubMed] [Google Scholar]
- Vazdarjanova A, Guzowski JF. Differences in hippocampal neuronal population responses to modifications of an environmental context: evidence for distinct, yet complementary, functions of CA3 and CA1 ensembles. J Neurosci. 2004;24(29):6489–96. doi: 10.1523/JNEUROSCI.0350-04.2004. [DOI] [PMC free article] [PubMed] [Google Scholar]
- Vazdarjanova A, Ramirez-Amaya V, Insel N, Plummer TK, Rosi S, Chowdhury S, Mikhael D, Worley PF, Guzowski JF, Barnes CA. Spatial exploration induces ARC, a plasticity-related immediate-early gene, only in calcium/calmodulin-dependent protein kinase II-positive principal excitatory and inhibitory neurons of the rat forebrain. J Comp Neurol. 2006;498(3):317–29. doi: 10.1002/cne.21003. [DOI] [PubMed] [Google Scholar]
- Wan H, Aggleton JP, Brown MW. Different contributions of the hippocampus and perirhinal cortex to recognition memory. J Neurosci. 1999;19(3):1142–8. doi: 10.1523/JNEUROSCI.19-03-01142.1999. [DOI] [PMC free article] [PubMed] [Google Scholar]
- Warburton EC, Glover CP, Massey PV, Wan H, Johnson B, Bienemann A, Deuschle U, Kew JN, Aggleton JP, Bashir ZI, et al. cAMP responsive element-binding protein phosphorylation is necessary for perirhinal long-term potentiation and recognition memory. J Neurosci. 2005;25(27):6296–303. doi: 10.1523/JNEUROSCI.0506-05.2005. [DOI] [PMC free article] [PubMed] [Google Scholar]
- West MJ, Slomianka L, Gundersen HJ. Unbiased stereological estimation of the total number of neurons in thesubdivisions of the rat hippocampus using the optical fractionator. Anat Rec. 1991;231(4):482–97. doi: 10.1002/ar.1092310411. [DOI] [PubMed] [Google Scholar]
- Wilson MA, McNaughton BL. Dynamics of the hippocampal ensemble code for space. Science. 1993;261(5124):1055–8. doi: 10.1126/science.8351520. [DOI] [PubMed] [Google Scholar]
- Winters BD, Bussey TJ. Transient inactivation of perirhinal cortex disrupts encoding, retrieval, and consolidation of object recognition memory. J Neurosci. 2005;25(1):52–61. doi: 10.1523/JNEUROSCI.3827-04.2005. [DOI] [PMC free article] [PubMed] [Google Scholar]
- Woloszyn L, Sheinberg DL. Effects of long-term visual experience on responses of distinct classes of single units in inferior temporal cortex. Neuron. 2012;74(1):193–205. doi: 10.1016/j.neuron.2012.01.032. [DOI] [PMC free article] [PubMed] [Google Scholar]
- Xiang JZ, Brown MW. Differential neuronal encoding of novelty, familiarity and recency in regions of the anterior temporal lobe. Neuropharmacology. 1998;37(4-5):657–76. doi: 10.1016/s0028-3908(98)00030-6. [DOI] [PubMed] [Google Scholar]
- Zhu XO, Brown MW. Changes in neuronal activity related to the repetition and relative familiarity of visual stimuli in rhinal and adjacent cortex of the anaesthetised rat. Brain Res. 1995;689(1):101–10. doi: 10.1016/0006-8993(95)00550-a. [DOI] [PubMed] [Google Scholar]
- Zhu XO, Brown MW, Aggleton JP. Neuronal signalling of information important to visual recognition memory in rat rhinal and neighbouring cortices. Eur J Neurosci. 1995a;7(4):753–65. doi: 10.1111/j.1460-9568.1995.tb00679.x. [DOI] [PubMed] [Google Scholar]
- Zhu XO, Brown MW, McCabe BJ, Aggleton JP. Effects of the novelty or familiarity of visual stimuli on the expression of the immediate early gene c-fos in rat brain. Neuroscience. 1995b;69(3):821–9. doi: 10.1016/0306-4522(95)00320-i. [DOI] [PubMed] [Google Scholar]
- Zhu XO, McCabe BJ, Aggleton JP, Brown MW. Differential activation of the rat hippocampus and perirhinal cortex by novel visual stimuli and a novel environment. Neurosci Lett. 1997;229(2):141–3. doi: 10.1016/s0304-3940(97)00437-0. [DOI] [PubMed] [Google Scholar]