

Abstract
Small molecule imaging: Aurora kinase A (AKA) was imaged in live cells using an in cellulo bioorthogonal two-step reaction with a small molecule and a fluorescent reporter. The small molecule was localized to spindle poles and microtubules during metaphase, consistent with the localization of both endogenous and GFP-/RFP-tagged AKA. Using this approach, changes in AKA distribution during mitosis were also observed.
Keywords: Cycloaddition reaction, cell cycle, live cell imaging, aurora kinase, cancer
Cell division (mitosis) is a tightly controlled process that is coordinated and regulated by a network of proteins localized in the nucleus. The key stages of mitosis are centrosome maturation, chromosome condensation, nuclear envelope breakdown, centrosome separation, bipolar spindle formation, chromosome separation, and finally cytokinesis.[1] Aurora kinase A (AKA) belongs to the Aurora kinase family of serine/threonine kinases, which have been shown to play critical roles in mitotic progression.[1–4] During mitosis, AKA localizes to centrosomes during late S to early G2 phase. As the cell proceeds to metaphase, AKA localizes to the microtubules and near the spindle poles, where it remains until anaphase when it migrates to some extent to the spindle midzone. Finally, during cytokinesis, AKA localizes to the midbody.[1, 3–5] Whilst localized to these specific cellular regions, AKA interacts with and phosphorylates several intracellular targets, including p53, MBD3, and BRCA1, each of which are critical mediators of malignant transformation.[1, 5] The unique stage-specific nuclear and intracellular locations of AKA during mitosis thus render it an interesting imaging target.
AKA overexpression has been reported in the majority of epithelial cancers[6] and has been shown to cause defects in cell division such as centrosome amplification and abnormal spindle formation.[7] An imbalance of AKA during mitosis may also alter the normal interactions between AKA and tumor suppressors such as p53, possibly promoting cell viability and tumorigenesis.[7] Because of the link between AKA overexpression and tumorigenesis, the use of AKA small molecule inhibitors as potential therapeutics for cancer is now an area of great interest.[6] For example, 4-[[9–Chloro-7-(2,6-difluorophenyl)-5H-pyrimido[5,4-d][2]benzazepin-2-yl]-amino] benzoic Acid (MLN8054) is an AKA-specific inhibitor that has ~100-fold greater specificity for AKA over other kinases, and has been shown to result in mitotic arrest and apoptosis.[8]
Despite interest in AKA’s involvement in cancer and the development of several AKA inhibitors, lack of specific imaging agents has impaired our ability to visualize and quantify AKA expression directly, either in panels of live cells or in patient-derived primary cancer cells (e.g. circulating tumor cells or from fine needle aspirates). Consequently, owing to the challenge of designing such agents, imaging probes with appropriate AKA selectivity and kinetics thus remain extremely limited. Antibodies, for example, are largely ineffective since they rarely have adequate cell permeability. Other techniques that have been used to image AKA include the use of fixed cells and AKA-specific antibodies, or exogenous expression of fluorescently-tagged AKA. Neither technique, however, enables accurate visualization of AKA in its endogenous state. The ability to visualize AKA within live cells or even via whole body imaging would not only provide new insights into the biology of AKA and its ideal pharmacological inhibition, but could also improve clinical efficacy testing of new small molecule AKA inhibitors. Here, in a bid to address this need, we sought to develop small molecule AKA imaging agents using MLN8054 as a scaffold, together with a bioorthogonal two-step labeling method.[9, 10] We initially modified the carboxylic acid of our MLN8054 precursor with trans-cyclooctene (TCO). The resulting compound (MLN8054-TCO; 13) was cell membrane permeable and, upon binding its target, could be visualized via a bioorthogonal tetrazine (Tz)-labeled fluorophore.[11] We thus report the first use of MLN8054-TCO 13 as an imaging agent for AKA in live cells and as a tool for quantifying cellular AKA expression.
To design the modification of MLN8054 with TCO, we utilized the crystal structure of AKA in complex with MLN8054 (PDB ID 2X81).[12] Analysis indicated that modification of the carboxylic acid group would be the most viable side for derivatization since it extends toward the solvent. MLN8054 was synthesized as described previously with minor modification (Scheme 1).[13] Briefly, ortholithiation of the 4-chloro-N-Boc-aniline with tert-butyllithium, followed by addition of the acyl chloride 2,6-difluorobenzoyl chloride, yielded the benzophenone derivative 1. After aniline deprotection and conversion of the amine 2 into an iodide 3, a Sonogashira coupling was performed with an N-Boc propargylamine prepared following a described procedure,[13] affording the alkyne 4. The amine 4 was then deprotected in acidic condition, followed by basic treatment, to allow the direct intramolecular cyclization to form the azepinone ring 5. Compound 6 was formed by reacting 5 with N,N-dimethylformamide dimethyl acetal in refluxed toluene. The pyrimidinoazepine 7 (MLN8054) was prepared by treating the enaminone 6 with 4-guanidinobenzoic acid in refluxed ethanol in the presence of potassium carbonate. The carboxylic acid 7 was then coupled to a piperidine derivative 10 prepared in three steps from the 4-(N-Boc-amino)piperidine, affording compound 11 in 79% yield. Finally, the amino protective group was removed and the resulting primary amine was treated with TCO-NHS, furnishing 13 (MLN8054-TCO) with an overall yield of 6% in ten steps (Scheme 1). Cycloaddition of MLN8054-TCO 13 and Texas Red-Tetrazine (TR-Tz) was initially investigated by mixing the two compounds (0.25 mM), stirring for two minutes, and analyzing the sample by high performance liquid chromatography–mass spectrometry (HPLC-MS). LC-MS spectra confirmed the quantitative conversion of TR-Tz to the cycloaddition-product (Figure S1).
Scheme 1.
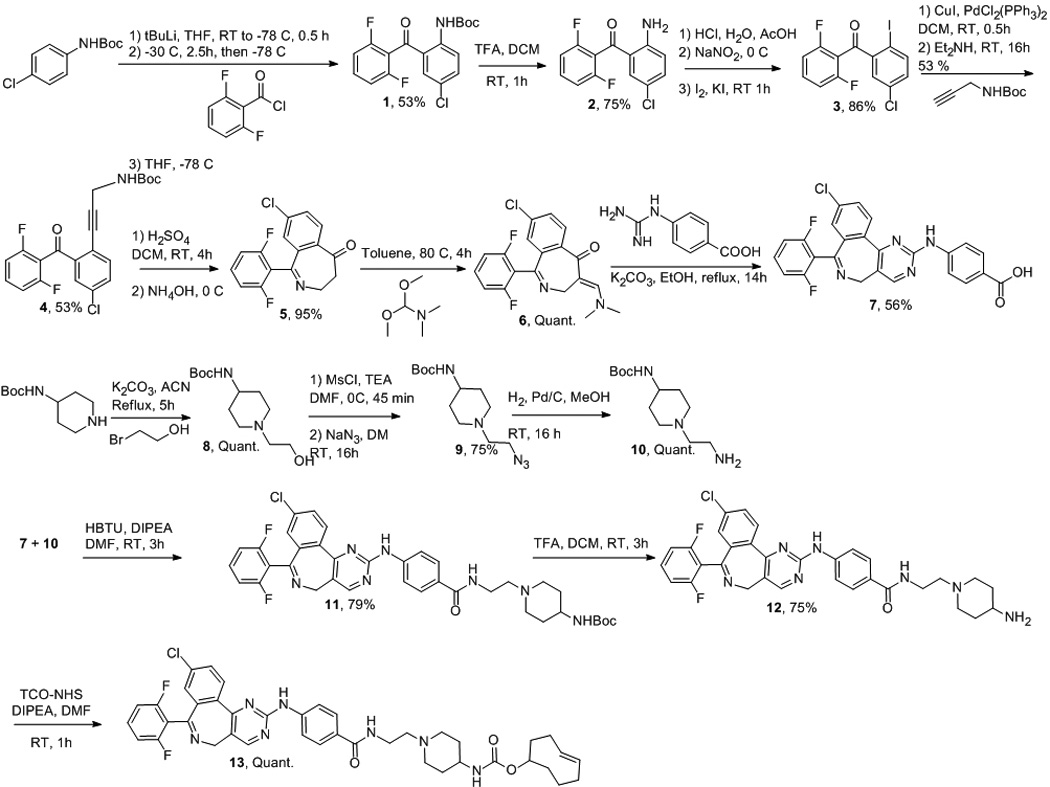
Synthetic scheme of MLN8054-TCO.
The inhibitory effects of MLN8054 7, MLN8054-TCO 13, TR-Tz and the pre-reacted MLN8054-TR on AKA were evaluated using a kinase activity assay (see supplementary information). The IC50 value of MLN8054 7 was 1.5 nM. Analysis of MLN8054-TCO 13 resulted in an expected lower, but still acceptable, IC50 value of 61.8 nM (Figure S2 and Table S1). In contradistinction, the pre-reacted fluorescent MLN8054-TR had an affinity of 437.3 nM (Figure S2 and Table S1), which supported use of the two-step labeling method for imaging. Given the reasonable enzyme affinity achieved with MLN8054-TCO 13, we sought to image AKA within cells. This was performed in two separate experiments, where: 1) AKA was tagged in live cells with MLN8054-TCO 13 and TR-Tz and then imaged in fixed cells, and 2) AKA was tagged in live cells and in cellulo clicking was imaged via a membrane permeable Carboxyfluorescein diacetate-Tz.
To investigate colocalization between AKA and the bioorthogonal small molecule reaction in fixed cells, we engineered pancreatic cancer (PANC-1) cells to express GFP-AKA. Cells were first incubated for 20 min with MLN8054-TCO 13 in growth media (1.5 µM, 0.1% DMSO). Excess probe was washed out and TR-Tz was added in growth media for 20 min (1 µM, 0.1% DMSO). Cells were fixed for DNA staining with Hoechst dye and imaged with a DeltaVision deconvolution microscope (Figure 1). GFP-AKA localized to the microtubules near the spindle poles during metaphase, as previously reported3 (Figure 1A). Excitingly, we observed a very similar microtubule localization using the small-molecule MLN8054-TCO 13, as revealed with TR-Tz (Figure 1B). Subsequent merging of the GFP-AKA and MLN8053-TCO 13 images, in addition to Hoechst staining (Figure 1C), revealed significant colocalization (Figure 1D). Control experiments later verified that neither TR-Tz nor the pre-reacted compound exhibit significant fluorescent staining in PANC-1 tumor cells (Figure S3). These experiments not only demonstrate the fluorochrome’s low background but also highlight the advantage of the bioorthogonal approach over a directly conjugated drug-fluorophore pair (Figure S3). When unlabeled MLN8054 7 was used, no significant staining was observed with TR-Tz (Figure S3B). Given the unique spatial localization of AKA during mitosis, we next determined whether it would be possible to image its distribution using the bioorthogonal approach. Accordingly, after treating PANC-1 cells as above, we found equally good colocalization during different stages of G2/M phase (Figure S4). Interestingly, GFP-AKA expression and MLN8054-TCO 13 staining were both significantly reduced in interphase, a period when AKA is not significantly expressed (Figure S4A).[2, 3] The results also demonstrated that in cellulo chemistry is possible, sufficiently fast and selective under biological conditions.
Figure 1.

Colocalization of MLN8054-TCO 13/Texas Red-Tz with GFP-AKA. PANC-1 Tet-On cells were incubated for 20 min with 1.5 µM MLN8054-TCO 13, washed, and incubated for 20 min with 1 µM Texas Red-Tz for bioorthogonal reaction inside the cells. Cells were fixed and nuclei were stained using Hoechst. 40X images were collected by deconvolution microscopy. (a) GFP-AKA localization in PANC-1 cells, (b) MLN8054-TCO 13/Texas Red-Tz staining, (c) Hoechst staining of nuclei, (d) Merge. Scale bar: 10 µm.
We next determined whether the two-step AKA imaging procedure could be applied to other primary cancer cell lines. To compare small molecule AKA imaging to standard AKA antibody staining (which requires fixed cells), we selected eight cancer cell lines (HeLa, PANC-1, A549, SKOV-3, MDA-MB-231, U-87 MG, SW480, and MIA PaCa-2) and two normal cell lines (IMR-90 and HEK-293). Cells were plated in duplicate in 96-well plates and were treated with MLN8054-TCO 13 and TR-Tz, as described above. Each well was imaged at 10X magnification to examine the entire population of cells. The fluorescence intensity for both the AKA antibody channel and the Texas Red channel were then determined separately using ImageRail software.[14] As shown in Figure 2A, antibody staining revealed that each normal and cancer cell line expressed different levels of AKA. Similar variations in AKA expression levels were likewise observed following the small molecule two-step labeling procedure, with good correlation (Figure 2A and B, R2 = 0.93).
Figure 2.

Expression of AKA in ten cell lines measured using MLN8054-TCO 13. Cell lines were plated in duplicate in 96-well plates 48 hrs prior to assay. Cells were first incubated with 1.5 µM MLN8054-TCO 13 for 20 min (0.1% DMSO). After washing, cells were incubated with 1 µM Texas Red-Tz (0.1% DMSO). Following washing, cells were fixed and processed for staining with an α-AKA antibody and Hoechst. Integrated fluorescence intensity was measured by imaging at 10X with a cellWoRX microscope (Applied Precision). (a) Percent maximum signal of the integrated intensity for each cell line was calculated for the TRITC channel (MLN8054-TCO 13/Texas Red-Tz) and the FITC channel (AKA antibody) using ImageRail software.[14] (b) Correlation between the percent maximum signal for the AKA antibody (x-axis) and MLN8054-TCO 13/Texas Red-Tz (y-axis). Data were fit by linear regression using GraphPad (Prism), with an R2 = 0.93. Data represent at least two independent experiments.
While the feasibility experiments described above were performed using live/fixed cells, our ultimate goal was to develop a method in which AKA could be imaged in live cells. Unfortunately, cellular uptake of Texas Red (and Tz derivatives) was found to be limited in intact live cells (Figure S5). Rather, TR-Tz appears to enter live cells through endocytosis. The bright, punctate staining emanating from the endocytic vesicles likely served to mask the localization of TR-Tz to MLN8054-TCO 13/AKA, as observed following fixation/permeabilization/washing in the fixed cell scenario described above. To identify alternative fluorophores suitable for live cell imaging, we screened a library of various fluorescently-tagged Tzs to determine which might exhibit diffusion-mediated cellular uptake. Ten dyes with an emission wavelength in the red or green spectral region were chosen (Figure S5). For this experiment, we also engineered a PANC-1 cell line to stably express mCherry-AKA (RFP-AKA) so as to visualize dyes emitting in the green spectral region. With the notable exception of Carboxyfluorescein diacetate-Tz (CFDA-Tz; Figure 4), most fluorochrome-Tz dyes tested showed lower accumulation in live cells. Boron-dipyrromethene(BODIPY)-Tz and nitrobenzoxadiazole (NBD)-Tz also showed some colocalization with AKA but at the expense of higher background levels; on account of this, they were not pursued further (Figure S5).
Figure 4.

Live cell colocalization of MLN8054-TCO 13/CFDA-Tz in PANC-1 Tet-On cells expressing RFP-AKA. PANC-1 cells were incubated for 30 min with 125 nM MLN8054-TCO 13. Cells were washed and incubated for 30 min with 187.5 nM CFDA-Tz for bioorthogonal reaction inside living cells. Following washing, cells were incubated for 10 min with DRAQ5 to stain nuclei in live cells. 40X images with 1.6 zoom were collected by deconvolution microscopy. (a) PANC-1 cellular localization of RFP-AKA, (b) MLN8054-TCO 13/CFDA-Tz staining, (c) DRAQ5 staining of nuclei, (d) Merge. Scale bar: 10 µm.
Carboxyfluorescein diacetate (CFDA) is a non-fluorescent, cell-permeant dye, activated by nonspecific cellular esterases.[15] Here, we chose to synthesize a Tz version of this dye and evaluate its activation properties in cell lysates. CFDA-Tz was incubated with varying amounts of HT1080 cell lysate, and the liberated fluorescence measured at 526 nm (Figure 3A). Hydrolysis of the acetate moieties was rapid, reaching a plateau after only 60 min of incubation with 20 µg of cell lysate. While decreasing the quantity of cell lysate slowed the kinetics of activation, the same signal plateau was reached after a few hours. Without cell lysate, the dye remained in its native state. The fluorescent signal before and after activation was shown to increase by a factor of ~10 (Figure 3B).
Figure 3.

Activation properties of CFDA-Tz. (a) Activation of CFDA-Tz with various amounts of cell lysate. CFDA-Tz dye (20 µM) was incubated at room temperature with HT1080 cell lysate (0, 1, 2.5, 5, 10 or 20 µg). Fluorescence emission was recorded at 526 nm over time; (b) Emission spectrum of CFDA-Tz before and after activation by lysate. CFDA-Tz dye (20 µM) was incubated with HT1080 cell lysate (0 or 10 µg) for 40 min at room temperature. The fluorescence emission scan was then recorded.
We subsequently investigated the use of CFDA-Tz in the two-step labeling procedure, using the RFP-AKA PANC-1 cell line. Live cells were imaged in a warm, humidified imaging chamber equipped with a microscope. RFP-AKA was seen to localize to centrosomes and microtubules/spindles during metaphase of mitosis (Figure 4A). A strikingly similar localization was likewise observed for MLN8054-TCO 13/CFDA-Tz (Figure 4B). Merging these images together, along with the DRAQ5 DNA stain, again demonstrated a high degree of colocalization (Figure 4C and D). Control experiments were performed using an HT1080 fibrosarcoma cell line stably transfected with H2B-Apple, to enable easy identification of actively dividing cells. These experiments served to further demonstrate that neither CFDA-Tz nor the pre-reacted compound exhibit significant fluorescent staining in tumor cells (Figure S6). Labeling of endogenous AKA in live cells with MLN8054-TCO 13/CFDA-Tz during different stages of G2/M phase was also examined using the HT1080 H2B-Apple cell line (Figure 5). In this experiment, MLN8054-TCO 13/CFDA-Tz showed very good correlation with the expected localization of AKA during mitosis. Overall, our results not only show that the MLN8054-TCO 13 bioorthogonal two-step labeling procedure is useful for labeling fixed cells, but also demonstrate that this technique can be used to label targets for imaging in living cells.
Figure 5.

Localization of MLN8054-TCO 13/CFDA-Tz in dividing HT1080 H2B-Apple cells. HT1080 cells were incubated for 30 min with 125 nM MLN8054-TCO 13, washed and incubated for 30 min with 1 µM CFDA-Tz for bioorthogonal reaction inside living cells. Following 2 hrs of washing, live cells at different stages of mitosis were imaged at 40X with 1.6 zoom by deconvolution microscopy. Left column: MLN8054-TCO 13/CFDA-Tz, Middle column: H2B-Apple, Right column: merge. (a) Interphase, (b) Prophase, (c) Prometaphase, (d) Metaphase, (e) Anaphase, (f) Telophase, (g) Cytokinesis. Scale bar: 10 µm.
In conclusion, we show that endogenous AKA can be imaged in live cells via a two-step in cellulo bioorthogonal reaction. As an imaging agent, MLN8054-TCO 13 in combination with CFDA-Tz demonstrated superior selectivity, fast reaction kinetics and a sufficient target-to-background ratio as to enable AKA visualization. These results build on previous studies that have used two-step bioorthogonal imaging approaches to visualize both cell surface16 and cytoplasmic targets.[11, 17, 18] Our findings, however, also demonstrate, for the first time, the capability for facultative imaging in live cells. These results represent an important step towards designing AKA agents for imaging at the whole body level, e.g. for positron emission tomography or for use with near infrared optical imaging techniques. We believe that the described strategy for bioorthogonal labeling of a cell cycle-specific intracellular/nuclear target will likely enable the labeling of other intracellular targets. Furthermore, we expect that this approach will allow us to also examine how labeled AKA drugs behave and interact not only in live cells but also within the tumor microenvironment of mice.
Supplementary Material
Acknowledgments
This work was supported by the National Institutes of Health (NIH) grant number RO1EB010011 and P50CA86355, K.Y. was supported by a NIH grant T32-CA79443 and T.R. was supported by a grant from the German Academy of Sciences Leopoldina (LPDS 2009-24). We thank Prof. Peter Sorger and Dr. Robert Yang for assistance with cellWoRx and ImageRail and Paolo Fumene Feruglio for assistance with image processing. We also thank Dr. Jonathan Carlson, Dr. Greg Thurber, and Dr. Carlos Tassa for helpful input and discussions about the manuscript.
Footnotes
Supporting information for this article is available on the WWW under http://www.angewandte.org or from the author.
References
- 1.Marumoto T, Zhang D, Saya H. Nat Rev Cancer. 2005;5:42. doi: 10.1038/nrc1526. [DOI] [PubMed] [Google Scholar]
- 2.Vader G, Lens SM. Biochim Biophys Acta. 2008;1786:60. doi: 10.1016/j.bbcan.2008.07.003. [DOI] [PubMed] [Google Scholar]
- 3.Carmena M, Earnshaw WC. Nat Rev Mol Cell Biol. 2003;4:842. doi: 10.1038/nrm1245. [DOI] [PubMed] [Google Scholar]
- 4.Barr AR, Gergely F. J Cell Sci. 2007;120:2987. doi: 10.1242/jcs.013136. [DOI] [PubMed] [Google Scholar]
- 5.Carvajal RD, Tse A, Schwartz GK. Clin Cancer Res. 2006;12:6869. doi: 10.1158/1078-0432.CCR-06-1405. [DOI] [PubMed] [Google Scholar]
- 6.Lens SM, Voest EE, Medema RH. Nat Rev Cancer. 2010;10:825. doi: 10.1038/nrc2964. [DOI] [PubMed] [Google Scholar]
- 7.Fu J, Bian M, Jiang Q, Zhang C. Mol Cancer Res. 2007;5:1. doi: 10.1158/1541-7786.MCR-06-0208. [DOI] [PubMed] [Google Scholar]
- 8.Manfredi MG, et al. Proc Natl Acad Sci USA. 2007;104:4106. [Google Scholar]
- 9.Blackman ML, Royzen M, Fox JM. J. Am. Chem. Soc. 2008;130:13518. doi: 10.1021/ja8053805. [DOI] [PMC free article] [PubMed] [Google Scholar]
- 10.Devaraj NK, Weissleder R, Hilderbrand SA. Bioconjugate Chem. 2008;19:2297. doi: 10.1021/bc8004446. [DOI] [PMC free article] [PubMed] [Google Scholar]
- 11.Devaraj NK, Hilderbrand S, Upadhyay R, Mazitschek R, Weissleder R. Angew Chem Int Ed Engl. 2010;49:2869. doi: 10.1002/anie.200906120. [DOI] [PMC free article] [PubMed] [Google Scholar]
- 12.Sloane DA, et al. ACS Chem Biol. 2010;5:563. doi: 10.1021/cb100053q. [DOI] [PubMed] [Google Scholar]
- 13.Denton TT, Zhang X, Cashman JR. J Med Chem. 2005;48:224. doi: 10.1021/jm049696n. [DOI] [PubMed] [Google Scholar]
- 14.Millard BL, Niepel M, Menden MP, Muhlich JL, Sorger PK. Nat Methods. 2011;8:487. doi: 10.1038/nmeth.1600. [DOI] [PMC free article] [PubMed] [Google Scholar]
- 15.Rotman B, Papermaster BW. Proc Natl Acad Sci USA. 1966;55:134. doi: 10.1073/pnas.55.1.134. [DOI] [PMC free article] [PubMed] [Google Scholar]
- 16.Devaraj NK, Upadhyay R, Haun JB, Hilderbrand SA, Weissleder R. Angew Chem Int Ed Engl. 2009;48:7013. doi: 10.1002/anie.200903233. [DOI] [PMC free article] [PubMed] [Google Scholar]
- 17.Reiner T, Earley S, Turetsky A, Weissleder R. Chembiochem. 2010;11:2374. doi: 10.1002/cbic.201000477. [DOI] [PMC free article] [PubMed] [Google Scholar]
- 18.Budin G, Yang KS, Reiner T, Weissleder R. Angew Chem Int Ed Engl. 2011;50:9378. doi: 10.1002/anie.201103273. [DOI] [PMC free article] [PubMed] [Google Scholar]
Associated Data
This section collects any data citations, data availability statements, or supplementary materials included in this article.