

Light-cleavable agents (caged)[1, 2] have found utility in addressing fundamental issues in cell biology, most notably drawing correlations between intracellular biochemical activity and cell behavior. However, the current state of technology for caged compounds is generally restricted to functional groups that respond to long UV/short visible wavelengths (~360 nm). Recently, a few reports have appeared describing photolytic strategies that discriminate between two caged bioactive species.[3–7] The latter are based, in large part, on studies of photolabile protecting groups by Brochet[8] and Hagen[9]. These studies have laid the groundwork for a toolkit of wavelength distinguishable caging agents. We report the expansion of this toolkit to three wavelengths using the comparably weak (~30 kcal/mol) Co-alkyl moiety in alkyl-cobalamins[10, 11] as the light-cleavable bond.
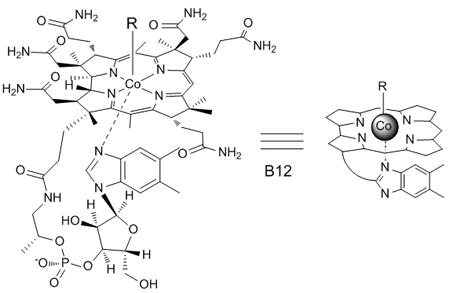
Barker and his coworkers described the photosensitivity of coenzyme B12 (where R = 5′-deoxyadenosyl) 50 years ago.[12] Alkylated cobalamins absorb light at 340 – 380 nm, ~420 nm, and 500 – 570 nm. Illumination with light in any of these regions induces Co-alkyl bond scission with quantum yields on the order of 0.1–0.4.[13] To the best of our knowledge, the visible light sensitivity of Co-alkyl bond has not been used to create caged bioactive compounds. This is not surprising since, unlike a caged hydroxyl, carboxyl, amide, or amine moiety, photolysis of a caged alkyl chain is not likely to generate a functional group essential role for biological recognition or activity. However, we have shown that a photocleavable bond attached at non-essential functionality can render a bioactive agent “caged” by (a) controlling the cellular location of the agent[14] or (b) by disrupting noncovalent interactions between the active agent and an appended inhibitor[15]. We note that other examples of metal-based caging groups have been described, although they are cleaved at wavelengths less than 400 nm[16, 17].
We[14, 15], as well as others[18, 19], have demonstrated that an independent measure of successful photolysis is feasible by linking bond cleavage to a fluorescent readout. We describe herein profluorescent reporters that respond to wavelength-distinct photolytic cleavage of nitrobenzyl, amino-coumarin and cobalamin moieties (Figure 1). The nitrobenzyl moiety is photolyzed at <410 nm with a quantum yield (Φ365nm) ~ 0.1.[6] We’ve previously reported the synthesis of quenched cassettes that display an increase in either TAMRA (NB-1) or FITC (NB-2) fluorescence upon photolysis of a nitrobenzyl linker separating a QSY7 quencher from the fluorophore.[14] NB-1 was designed with a cell-penetrating mitochondrial localization sequence (MLS)[20] for cellular studies. We appended a 440 nm-sensitive diethylaminocoumarin[3, 5, 7, 9] to one of the aromatic amine moieties of rhodamine (Coum-3), which quenches the fluorescence of the latter. The coumarin-rhodamine conjugate is linked to a MLS peptide via a polyethylene glycol (PEG) tether, which furnishes a cell permeable profluorescent reporter of 440 nm photolysis. Finally, cobalamin has previously been shown to quench the fluorescence of appended fluorophores[1, 21], an observation that served as the basis for the design of Cob-4. The latter acts as a reporter of photolytic cleavage at 560 nm. In addition, Cob-4 is cell permeable (vide infra) and consequently, an attached MLS peptide is unnecessary. The unique spectral absorbances of these three groups allows selective cleavage of Cob-4 at 560 nm without interfering with the structural integrity of Coum-3, NB-1, or NB-2 and the selective cleavage of Coum-3, without interfering with the structural integrity of NB-1 or NB-2 (Figure S1).
Figure 1.
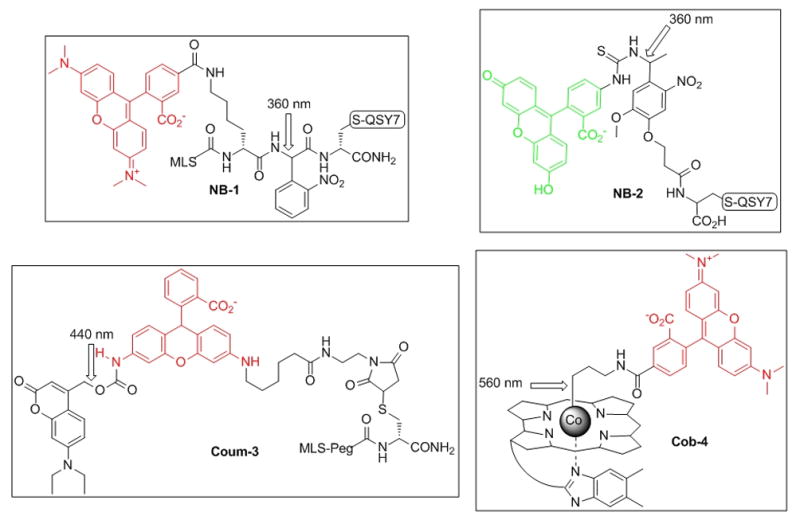
Structures of pro-fluorescent reporters of photolysis, where TAMRA in NB-1 and Cob-4 displays a λem = 580 nm, Rhodamine 110 in Coum-3 a λem = 540 nm, and fluorescein in NB-2 displays a λex = λem = 520 nm. The structure of QSY7 is furnished in the Supporting Information.
Photolysis of NB-1, Coum-3 and Cob-4 was monitored by an increase in rhodamine fluorescence. NB-1 and Coum-3 were photolyzed via a Hg-arc lamp with selective bandpass filters for 360 ± 25, 440 ± 10, and 560 ± 10 nm. NB-1 is only sensitive to photolysis with 360 nm light, resulting in a 24.2 ± 0.8 fold increase in fluorescence [Figure 2(a) and Table 1]. Coum-3 is photocleaved at both 360 nm and 440 nm, furnishing a 9.2 ± 0.3 and 8.3 ± 0.2 fold fluorescent increase, respectively [Figure 2(b)]. Like NB-1, Coum-3 fails to undergo photolysis at 560 nm. Finally, Cob-4 is exquisitely sensitive to photolysis at 360, 440 or 560 nm, resulting in a 12.6 ± 0.6, 10.2 ± 0.3 and 13.6 ± 0.1 fold fluorescent increase, respectively [Figure 2(c)]. Unlike NB-1 or Coum-3, Cob-4 suffers photolysis even under the comparatively low photon flux conditions in a fluorimeter (versus that of a Hg arc lamp). In addition, we note that photolysis of Coum-3 [Figure 2(b)] and Cob-4 [Figure 2(c)] is slower at 440 nm (◆) than at 360 (●) or 560 (▲) nm, presumably due to the smaller absorbance at 440 nm. Finally, the overall yield for the photocleaved products is high. We’ve previously shown that nitrobenzyl derivatives very closely related to NB-1 and NB-2 suffer nearly quantitative photolytic conversion.[14] Both Coum-3 (Figure S3) and Cob-4 (Figure S4) were evaluated via LC-MS in this study, where LC absorbance was used to acquire yields and MS to characterize products. Coum-3 undergoes photolysis in 92% yield and Cob-4 in 97% yield. The former provides a single product, whereas the latter furnishes three (a predominant aldehyde, an intermediate hydroperoxide that is converted into the aldehyde, and a small amount of alkyl product – see Figure S4c).
Figure 2.

(a) Fold increase of NB-1 fluorescence upon photolysis with a Hg arc lamp at 360 nm (●), 440 nm (◆) or 560 nm (▲). (b) Fold increase of Coum-3 fluorescence upon photolysis at 360 nm (●), 440 nm (◆) or 560 nm (▲). (c) Fold increase of Cob-4 fluorescence upon photolysis in a fluorimeter by excitation at 360 nm (●), 440 nm (◆) or 560 nm (▲). RF is an abbreviation for relative fluorescence.
Table 1.
Florescent increase of NB-1, Coum-3, and Cob-4 upon photolysis.
| Light Source Sample | λphotolysis | NB-1 | Coum-3 | Cob-4 |
|---|---|---|---|---|
|
| ||||
| Hg arc lamp Cuvette | 360 nm | 24.2 ± 0.8 | 9.2 ± 0.3 | 12.6 ± 0.6 |
| 440 nm | 1.0 ± 0.04 | 8.3 ± .0.2 | 10.2 ± 0.3 | |
| 560 nm | 0.9 ± 0.04 | 1.0 ± 0.1 | 13.6 ± 0.1 | |
|
| ||||
| Laser/Confocal Microwells | 355 nm | 29.9 ± 2.6 | 5.5 ± 0.2 | 8.9 ± 0.5 |
| 440 nm | 0.9 ± 0.1 | 1.5 ± 0.1[i] | 6.2 ± 0.1 | |
| 559 nm | 1.1 ± 0.01 | 1.2 ± 0.01 | 8.1 ± 0.3 | |
|
| ||||
| Laser/Confocal HeLa Cells | 355 nm | 7.4 ± 0.5 | 3.9 ± 0.1 | ND |
| 440 nm | 1.4 ± 0.1 | 2.3 ± 0.1 | ND | |
| 559 nm | ND | ND | 1.9 ± 0.1 | |
The 440 nm laser on the confocal microscope is not powerful enough to efficiently photolyze Coum-3 in microwells.
ND = Not determined.
We evaluated the wavelength selective photolysis of Cob-4 in the presence of Coum-3 and NB-1 by taking advantage of the MLS sequences appended to the latter two compounds. In the presence of mitochondria, photolysis of Coum-3 and NB-1 generates an increase in fluorescence at 540 and 580 nm, respectively, that is associated with the mitochondria. (Figures 3, S8, and S9) The latter is obvious by simply centrifuging the photolyzed mitochondria-containing solution and separating the pellet (mitochondrial fraction) from the supernatant (non-mitochondrial fraction). By contrast, photolysis of Cob-4, which lacks an MLS, only furnishes a fluorescence increase in the supernatant (Figures 3, S8, and S9). As predicted, illumination of a NB-1, Coum-3, Cob-4 mixture at 560 nm generates a fluorescence increase at 575 nm in the supernatant, characteristic of selective Cob-4 photolysis. Subsequent illumination at 440 nm provides a fluorescence increase at 540 nm in the pellet (mitochondrial associated), characteristic of Coum-3 photolysis. Finally, illumination at 360 nm, furnishes a fluorescence increase at 575 nm only in the pellet, characteristic of NB-1 photolysis (Figures 3, S8, and S9).
Figure 3.

Strategy for demonstrating the wavelength selective photolysis of Cob-4 in a NB-1/Coum-3/Cob-4 mixture. Cob-4 photolysis at 560 nm furnishes a mitochondria-free fluorescent response at 575 nm. Coum-3 photolysis at 440 nm provides a mitochondria-associated fluorescent response at 540 nm. Finally, NB-1 photolysis at 360 nm delivers a mitochondria-associated fluorescent response at 575 nm.
We integrated a 100 mW continuous-wave UV laser with a confocal microscope in order to photolyze cellular and other microscopic samples at 355 nm. Fluoview software was employed to control the power and region of photolysis. Initial studies were performed using the photolabile pro-fluorescent reporters in 10 μL microwells. Photolysis of NB-1 and Coum-3 at 355 nm (100 mW) cleaves the photolabile bond as signalled by fluorescent fold increases of 29.9 ± 2.6 and 5.5 ± 0.2, respectively (Figure S5 and Table 1). Photolysis of Cob-4 at 355, 440, and 559 nm results in 8.9 ± 0.5, 6.2 ± 0.1, and 8.1 ± 0.3 fold fluorescent increases, respectively (Figure S5 and Table 1). Selective photolysis of the cobalamin moiety in the presence of a nitrobenzyl functionality was monitored by imaging TAMRA on Cob-4 and fluorescein on NB-2. As expected, 559 nm photolysis cleaves Cob-4 but not NB-2. NB-2 is cleaved upon subsequent exposure to 355 nm [Figures S6]. In addition, we have found that Cob-4 is much more sensitive to 355 nm illumination than NB-1, NB-2 or Coum-3, a result that is likely a consequence of a higher quantum yield of Cob-4 photolysis. Indeed, Cob-4 is selectively photolyzed in the presence of NB-2 at 355 nm by simply reducing the overall exposure (5 frames; where each frame represents exposure of all 512 × 512 pixels with a dwell time of 100 μs/pixel). By contrast, 100 frames are required for complete NB-2 photolysis (Figure S7).
NB-1, Coum-3, and Cob-4 are cell permeable. As expected, only Cob-4-loaded HeLa cells display a response to photolysis at 559 nm. Specifically, Cob-4 cleavage is induced by imaging at 0.03 mW with a 2 μs/pixel dwell time [Figs. 4(c) and S5 (c–d)]. By contrast, neither NB-1 [Figure 4(a)] nor Coum-3-loaded cells [Figure 4(b)] are affected by 559 nm light, even at 10 times the power and 5 times the dwell time. In an analogous vein, Coum-3-treated HeLa cells undergo photolysis at 440 nm [2.3 ± 0.1 fold fluorescent increase; Figure 4(b)] whereas NB-1-exposed cells are impervious to 440 nm light [Figure 4(a)]. Finally, both NB-1 and Coum-3 are susceptible to photolysis at 355 nm [Figs. 4(a–b) and S5 (a–b).
Figure 4.

(a) Quantification of the fluorescent increase of NB-1 in HeLa cells before and after 25 frames of photolysis at 355 (●), 440 (■) or 559 nm (▲). (b) NB-1-loaded HeLa before and after photolysis at 355 nm. (c) Quantification of the fluorescent increase of Coum-3 in HeLa cells before and after 25 frames of photolysis at 355 nm (●), 440 nm (■) or 559 nm (▲). (d) Coum-3-loaded HeLa before and after photolysis at 44o nm. (e) Quantification of the fluorescent increase of Cob-4 in HeLa cells imaged from 1 – 50 frames at 559 nm. (f) Cob-4-loaded Hela before and after photolysis at 559 nm.
In summary, we’ve established an order of photolytic selectivity that runs from long to short wavelength: Cob-4 is selectively photolyzed at 559 nm in the presence of Coum-3 and NB-1/NB-2 whereas Coum-3 is selectively photolyzed at 440 nm in the presence of NB-1/NB-2. Cob-4 photolysis transpires in a fluorimeter as well as, along with NB-1, NB-2, and Coum-3, under a confocal microscope in microwells and living cells. This is the first time that selective photolysis has been reported for three different moieties at three different wavelengths. In addition, the difference in photolysis rates of NB-1/NB-2 and Cob-4 at 355 nm allows the latter to be selectively cleaved in the presence of the former. The selective photolysis of three different moieties opens up possibilities of caging multiple bioactive molecules in a signalling network in order to probe their spatiotemporal influence in a single experiment.
Experimental Section
All experiments with NB-1, NB-2, Coum-3 and Cob-4 were performed done in the dark to prevent inadvertent photolysis.
Photolysis of NB-1 and Coum-3 with Hg arc lamp: Photolysis was performed using an Oriel 200 W Hg arc lamp (model 68700) equipped with a beam bending filter. A UV bandpass colored glass filter (Newport, FSQ-UG1), 440 ± 10 nm bandpass filter (Newport, 10BPF10-440) and 560 ± 10 nm bandpass filter (Newport, 10BPF10-560) were used for wavelength-selective photolysis. Initial fluorescence of 1 μM of NB-1 or Coum-3 in PBS + 1 mM DTT were read on a PTI Model 814 LPS-220B fluorimeter. Samples were photolyzed for specific time intervals up to 40 min on ice and then fluorescence re-read. Relative fluorescent (RF) changes were determined by the equation RF= (Ft −F0)/F0 where Ft is the fluorescence at time t and F0 the initial fluorescence. All experiments were performed in triplicate.
Photolysis of Cob-4 with a fluorimeter: Photolysis was performed using a PTI Model 814 LPS-220B fluorimeter. For photolysis at 560 nm, 1 μM of Cob-4 in PBS + 1 mM DTT was excited at 560 nm while monitoring the emission at 580 nm. Photolysis at 440 and 360 nm was accomplished by excitation of 1 μM Cob-4 in PBS + 1 mM DTT to the appropriate wavelength for 0 – 5 min. Fluorescence of the photolyzed samples was then recorded with λex = 560 nm and λem = 580 nm.
Photolysis of NB-1, Coum-3 and Cob-4 in HeLa cells on the confocal: HeLa cells were loaded with a) 5 μM NB-1 + 20 nM MitoTracker Deep Red, b) 5 μM Coum-3 + 20 nM MitoTracker Deep Red, 20 nM TMRE + 20 nM MitoTracker Deep Red, or c) 80 μM Cob-4 for 30 min at 37 °C and then washed 3 times with L-15 media. Photolysis was carried out using the stimulation mode of fluoview with images collected before and after stimulation for NB-1 and Coum-3. Photolysis was set at a dwell time of 100 μs/pixel for the defined region of interest using the following settings: a) 0 – 50 frames 355 nm (5 mW) or b) 0 – 100 frames 440 nm (30 mW). Imaging of NB-1 and Coum-3 was performed with a 60X oil immersion Plan S-Apo objective at 0.3 mW, 559 nm laser. Photolysis of Cob-4 was carried out by exposing to 559 nm (0.03 mW) for 1 – 50 frames. TMRE loaded cells were used for photobleaching curves under all photolysis experiments listed above. Image J software was employed for all image analysis. Fluorescent increases were determined as described above. All results are representative of 8–30 cells ± SE.
Photolysis of a mixture of NB-1, Coum-3 and Cob-4: Photolysis was performed at 550 nm using a PTI Model 814 LPS-220B fluorimeter and at 440 nm and 360 nm using the previously described filters with an Oriel 200 W Hg arc lamp equipped with a beam bending filter. A mixture of 0.5 μM NB-1 + 0.5 μM Coum-3 + 0.5 μM Cob-4 in PBS + 1 mM DTT was photolyzed at 550 nm, 440 nm or 360 nm and the emission spectra from 400 – 650 nm, excitation at 360 nm, was taken. For studies performed with mitochondria, 40 μL of bovine mitochondria (5.5 mg/ml for Abcam) was incubated with 200 μL of the mixture in isotonic mitochondrial buffer for 5 min. The sample was centrifuged at 9500 g for 10 min and the supernatant assayed. The pellet was washed 3 times, resuspended in 200 μL and assayed.
Supplementary Material
Footnotes
We thank the NIH (GM086217) for financial support
Supporting information for this article is available on the WWW under http://www.angewandte.org or from the author.
Contributor Information
Prof. Melanie A. Priestman, Department of Chemistry, Division of Chemical Biology and Medicinal Chemistry, and the Department of Pharmacology, University of North Carolina, Chapel Hill, NC 27599, Fax: 919-962-2388
Dr. Thomas A. Shell, Department of Chemistry, Division of Chemical Biology and Medicinal Chemistry, and the Department of Pharmacology, University of North Carolina, Chapel Hill, NC 27599, Fax: 919-962-2388
Dr. Liang Sun, Pharmaron-Beijing BDA, Beijing, 100176, P.R. China
Prof. Hsien-Ming Lee, Institute of Chemistry, Academia Sinica, Nankang Dist. Taipei, 115 Taiwan
Prof. David S. Lawrence, Email: lawrencd@email.unc.edu, Department of Chemistry, Division of Chemical Biology and Medicinal Chemistry, and the Department of Pharmacology, University of North Carolina, Chapel Hill, NC 27599, Fax: 919-962-2388.
References
- 1.Lee HM, Larson DR, Lawrence DS. ACS Chem Bio. 2009;4:409–427. doi: 10.1021/cb900036s. [DOI] [PMC free article] [PubMed] [Google Scholar]
- 2.Mayer G, Heckel A. Angew Chem Int Ed Engl. 2006;45:4900–4921. doi: 10.1002/anie.200600387. [DOI] [PubMed] [Google Scholar]; Angew Chem. 2006;118:5020–5042. [Google Scholar]
- 3.Goguen BN, Aemissegger A, Imperiali B. J Am Chem Soc. 2011;133:11038–11041. doi: 10.1021/ja2028074. [DOI] [PMC free article] [PubMed] [Google Scholar]
- 4.Hagen V, Dekowski B, Nache V, Schmidt R, Geissler D, Lorenz D, Eichhorst J, Keller S, Kaneko H, Benndorf K, Wiesner B. Angew Chem Int Ed Engl. 2005;44:7887–7891. doi: 10.1002/anie.200502411. [DOI] [PubMed] [Google Scholar]; Angew Chem. 2005;117:1219–1223. [Google Scholar]
- 5.Kantevari S, Matsuzaki M, Kanemoto Y, Kasai H, Ellis-Davies GC. Nat Met. 2010;7:123–125. doi: 10.1038/nmeth.1413. [DOI] [PMC free article] [PubMed] [Google Scholar]
- 6.Menge C, Heckel A. Org Lett. 2011;13:4620–4623. doi: 10.1021/ol201842x. [DOI] [PubMed] [Google Scholar]
- 7.Priestman MA, Sun L, Lawrence DS. ACS Chem BIo. 2011;6:377–384. doi: 10.1021/cb100398e. [DOI] [PMC free article] [PubMed] [Google Scholar]
- 8.Bochet CG. Angew Chem Int Ed Engl. 2001;40:2071–2073. doi: 10.1002/1521-3773(20010601)40:11<2071::AID-ANIE2071>3.0.CO;2-9. [DOI] [PubMed] [Google Scholar]; Angew Chem. 2001;113:723–726. [Google Scholar]
- 9.Kotzur N, Briand B, Beyermann M, Hagen V. J Am Chem Soc. 2009;131:16927–16931. doi: 10.1021/ja907287n. [DOI] [PubMed] [Google Scholar]
- 10.Hogenkamp HP. Biochemistry. 1966;5:417–422. doi: 10.1021/bi00866a005. [DOI] [PubMed] [Google Scholar]
- 11.Schrauzer GN, Lee LP, Sibert JW. J Am Chem Soc. 1970;92:2997–3005. doi: 10.1021/ja00713a012. [DOI] [PubMed] [Google Scholar]
- 12.Barker HA, Weissbach H, Smyth RD. Proc Natl Acad Sci USA. 1958;44:1093–1097. doi: 10.1073/pnas.44.11.1093. [DOI] [PMC free article] [PubMed] [Google Scholar]
- 13.Taylor RT, Smucker L, Hanna ML, Gill J. Arch Biochem Biophys. 1973;156:521–533. doi: 10.1016/0003-9861(73)90301-9. [DOI] [PubMed] [Google Scholar]
- 14.Lee HM, Priestman MA, Lawrence DS. J Am Chem Soc. 2010;132:1446–1447. doi: 10.1021/ja907427p. [DOI] [PMC free article] [PubMed] [Google Scholar]
- 15.Lee HM, Xu W, Lawrence DS. J Am Chem Soc. 2011;133:2331–2333. doi: 10.1021/ja108950q. [DOI] [PMC free article] [PubMed] [Google Scholar]
- 16.Petroni A, Slep LD, Etchenique R. Inorg Chem. 2008;47:951–956. doi: 10.1021/ic7018204. [DOI] [PubMed] [Google Scholar]
- 17.Respondek T, Garner RN, Herroon MK, Podgorski I, Turro C, Kodanko JJ. J Am Chem Soc. 2011;133:17164–17167. doi: 10.1021/ja208084s. [DOI] [PMC free article] [PubMed] [Google Scholar]
- 18.Majjigapu JR, Kurchan AN, Kottani R, Gustafson TP, Kutateladze AG. J Am Chem Soc. 2005;127:12458–12459. doi: 10.1021/ja053654m. [DOI] [PubMed] [Google Scholar]
- 19.Pellois JP, Hahn ME, Muir TW. J Am Chem Soc. 2004;126:7170–7171. doi: 10.1021/ja0499142. [DOI] [PubMed] [Google Scholar]
- 20.Horton KL, Stewart KM, Fonseca SB, Guo Q, Kelley SO. Chemistry & Biology. 2008;15:375–382. doi: 10.1016/j.chembiol.2008.03.015. [DOI] [PubMed] [Google Scholar]
- 21.Smeltzer CC, Cannon MJ, Pinson PR, Munger JD, Jr, West FG, Grissom CB. Org Lett. 2001;3:799–801. doi: 10.1021/ol006825v. [DOI] [PubMed] [Google Scholar]
Associated Data
This section collects any data citations, data availability statements, or supplementary materials included in this article.