

Abstract
Simulating protein flexibility is a major issue in the docking-based drug-design process for which a single methodological solution does not exist. In our search of new anti-Alzheimer ligands, we were faced with the challenge of including receptor plasticity in a virtual screening campaign aimed at finding new β-Secretase inhibitors. To this aim, we incorporated protein flexibility in our simulations by using an ensemble of static X-ray enzyme structures to screen the National Cancer Institute database. A unified description of the protein motion was also generated by computing and combining a set of grid maps using an energy weighting scheme. Such a description was used in an energy-weighted virtual screening experiment on the same molecular database. Assessment of the enrichment factors from these two virtual screening approaches demonstrated comparable predictive powers, with the energy-weighted method being faster than the ensemble method. The in vitro evaluation demonstrated that out of the 32 tested ligands, 17 featured the predicted enzyme inhibiting property. Such an impressive success rate (53.1%) demonstrates the enhanced power of the two methodologies and suggests that energy-weighted virtual screening is a more than valid alternative to ensemble virtual screening given its reduced computational demands and comparable performance.
Keywords: Docking, Virtual Screening, Receptor Flexibility, Drug Design, BACE-1
Introduction
Biological molecules (proteins, DNA, RNA) are flexible entities that can experience dramatic movements when interacting with their binding partners (small ligands and other macromolecules). These conformational rearrangements can involve side-chains, loops and even entire domains. In pharmaceutically relevant biological targets this phenomenon is a critical feature that can significantly affect drug binding. Unfortunately, from a computational point of view, simulating target flexibility in docking calculations still remains a major issue for which no single optimal approach exists. Several approaches have been described to simulate protein flexibility1 in docking calculations2 in which receptor plasticity is taken into account before or after the simulation. In this respect, one of the most popular strategies is to utilize a variety of static target structures to represent a flexible receptor in drug design applications.3,4 The performance of this method, referred to as ensemble-docking, highly depends on the way the different protein conformations are detected and on the way these conformations are used in a docking calculation. Experimentally determined structures (X-ray and NMR) can be successfully employed in an ensemble-docking. Alternatively, computational methods can be used to generate different protein conformations.5
Indeed, sufficiently fast methods have been proposed to include receptor flexibility during conformational search by varying the dihedral angles of a restricted number of side chains.6-8 The main weakness of this approach resides in the selection of the side chains to be considered flexible, which might not always be clearly understood or be sufficient in the absence of backbone flexibility. On the other hand, small backbone rearrangements can be efficiently simulated by employing a “soft docking”9 approach in which a tolerant interaction scoring function allows for limited ligand-receptor steric-clashes during docking simulations.
Ideally, the entire receptor plasticity should be considered during docking calculations and in pioneering works this has been implemented using Monte Carlo methods,10 molecular dynamics (MD) simulations11 and genetic algorithm-based search techniques.12 Unfortunately, the main drawback of these methodologies is that they can be extremely time-intensive, hampering the screening of a chemically comprehensive database in a practical receptor-based virtual screening (RBVS). Nevertheless, such screens can be deeply impacted by the use of a rigid receptor structure since it can restrict the calculated binding pose of a specific ligand to a small fraction of the proper chemical space that could complement that receptor.13 This, in turn, might lead to missing some borderline hits in the analysed database.
In our search of new anti-Alzheimer ligands,14 we were faced with the challenge of including receptor plasticity in a VS campaign aimed at finding new β-Secretase (BACE-1) inhibitors. This enzyme plays a key role in the maturation and production of amyloid-β (Aβ) peptides whose extra-neuronal accumulation constitutes a distinctive lesion of Alzheimer disease. Given the critical role played by BACE-1 in the production of Aβ peptides together with its druggable properties it is not surprising that the development of BACE-1 inhibitors has generated serious interest from both academia and pharmaceutical industries.15,16
BACE-1 is a structurally challenging protein target, featuring multiple sites for effective binding and an induced-fit upon ligand interaction. In particular, as already reported,14 the flap region (residues 68-74) of the enzyme is known to undergo a massive rearrangement upon ligand binding. Moreover, some mobility is also expected for the 10s-loop (residues 9–14). Notably, the three-dimensional (3D) crystal structures of BACE-1 have been reported in complex with numerous structurally unrelated inhibitors, producing a variety of receptor states and enabling the employment of an ensemble docking approach in our calculations. In a previous paper14 the use of an ensemble of five BACE-1 X-ray structures allowed the delineation of an exhaustive pharmacophore model for BACE-1 inhibitors. In this contribution, the same docking approach has been implemented in ensemble VS calculations (EVS) in which the National Cancer Institute (NCI) Diversity set was docked into the binding site of five different conformationally nonredundant BACE-1 structures.
In this case, the starting conformations of the protein could be combined into a unified description of the protein motion rather than sequentially docking the ligand to all the structures of the ensemble. For example, in previous work different protein 3D structures were superimposed, the similar parts merged and the conformationally different segments were treated separately thus achieving a “united protein representation”.17-19 In 2002 Goodsell and co-workers adopted four different methods of combining multiple target structures within a single grid-based lookup table of interaction energies.20 Among these methods, an energy-weighted grid, developed by the authors, permitted consistent and accurate ligand docking, using a single grid representation of the target protein structures. To the best of our knowledge this method has not been employed in VS calculations. Therefore, in the present contribution the energy-weighted grid method was included in a VS calculation (EWVS) for the discovery of BACE-1 inhibitors.
Herein, the description of the two adopted methodologies is reported together with an analysis of the achieved computational results. The experimental results from in vitro inhibition verification against BACE-1 of the newly identified scaffolds are also reported.
Results and Discussions
Analysis of BACE-1 crystal structures
The great interest in BACE-1 from both academia and industry is demonstrated by the exponentially growing number of crystal structures deposited in the Protein Data Bank. In 2000 Tang and co-workers deposited the first structure of BACE-1 in complex with the peptide inhibitor OM99-2.21 Since then, around 180 structures have been deposited in the PDB in which the enzyme was crystallized in complex with different ligands or in its apo form. In a previous paper,14 we identified the BACE-1 crystals that can represent the total enzyme flexibility in a set of conformationally non-redundant structures. The identification of these conformations was attained by visual inspection of all the available structures. Since then, new structures have been deposited in the Protein Data Bank. Therefore in the present study we have also included the new structures deposited up to December 2010.
To analyse the most relevant conformational differences, all available crystal structures were superimposed using 1XS722 as the reference structure. Table S1 in Supporting Information reports the resulting root-mean square deviations (RMSD). A visual inspection of the aligned structures reveals that there are several conformational differences among the deposited crystal structures. As mentioned elsewhere,14 the most evident difference among all the structures resides in the conformation of the flap region (residues 68-74). In particular, this portion of protein undergoes a swing motion, gradually covering the active site to facilitate the ligand binding process. Interestingly, the diverse ligand structures can induce different flap degrees of closures with a 2-aminoquinazoline inhibitor (PDB code 2Q11)23 inducing the most widely open conformation and peptoid ligand (PDB code 3KYR)24 inducing the most closed one (Figure 1). In our calculations, the structure having PDB code 1XN325 was considered as representative of the open conformation of the flap region (Figure 1). Also the 10S-loop (residues 9-14), a short loop located between two strands at the base of the S3 sub-pocket, displays three main low-energy conformations, a closed, an open and an outlier conformation. The structures with PDB codes 1FKN,21 1W5126 and 1TQF27 can be considered representative of these three conformations, respectively (Table S2 in Supporting Information reports the PDB codes of the analysed structures clustered according to their conformational behaviour). Additionally, a degree of flexibility can be detected in the side-chains of several residues present in the binding site (Leu30, Arg128, Lys224, Arg235, Arg307). The side chain conformations of the latter residues can be sufficiently described by the structures representing the flap and 10s loop motions (PDB codes 1XN3, 1FKN, 1W51 and 1TQF) and by an additional one having PDB code 2G94.28
Figure 1.
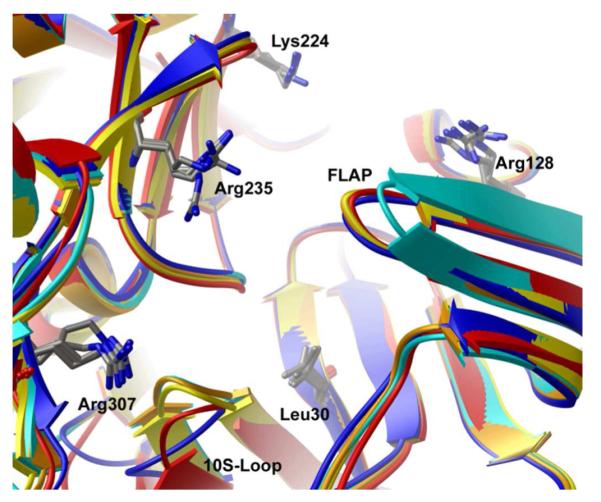
Superimposition of the five BACE-1 structures chosen as representative of the enzyme protein motion upon ligand binding. Structures having PDB codes 1FKN, 1TQF, 1W51, 1XN3 and 2G94 are depicted as orange, blue, red, cyan and yellow ribbons, respectively. Flexible residues are also depicted as sticks.
Ensemble Virtual Screening (EVS)
The diversity set of the NCI database was docked to the five structures selected to represent the BACE-1 flexibility. The NCI diversity library is a reduced set of 1597 compounds selected from the original NCI-3D structural database for their unique scaffolds. The selection process is outlined in more detail at the NCI Developmental Therapeutic Program website.29 In our computations we used a modified version of the database which was processed according to the ZINC protocol.30 In this version all of the compounds were present in different protonation and tautomeric forms, thus accounting for all of their biologically relevant forms. In addition, the 3D structures of 45 known active inhibitors (Table S3 in Supporting Information) were added to the database (approximately 2%). The resulting set of compounds was docked in the binding site of 1FKN, 1TQF, 1W51, 1XN3 and 2G94 structures. All calculations were performed with the current version of AutoDock (AutoDock4.2, AD4).31 AD4 calculated for each ligand different alternative binding poses with an associated free energy of binding (ΔGbind) which were then clustered according to their RMSD, thus allowing calculation of the frequency of occurrence (Focc.) of each conformation. Therefore, for each of the five VS we considered the solution having the lowest ΔGbind among all the predicted conformations (Lowest Overall Energy, LOE) together with the lowest energy conformation belonging to the most populated cluster (Lowest Energy of Best Cluster, LEBC). Considering both the LOE and LEBC conformations may have positive effects on the screening results. Indeed, in the ideal situation the two solutions would coincide, but in several cases they diverge and usually the preference is given to the LOE one. In our opinion, it would be also worth considering the frequency of occurrence, especially in cases where the best solution is poorly represented among the predicted ones.32 Therefore, for each ligand two rankings were achieved (LOE and LEBC solutions) considering the associated ΔGbind and Focc.. Discarded from the solutions were those having a ΔGbind more than −10 kcal/mol and a Focc. less than 10 out of one hundred. In all five virtual screens the cut-off value of −10 kcal/mol was chosen as the average ΔGbind since the known active compounds were predicted to be around −10 kcal/mol in each. Additionally, the cut-off value of 10/100 for the Focc. was chosen as it represents 10% of the total number of solutions achieved per docking calculation. The two rankings (LOE and LEBC solutions) were then unified. In the unified ranking each ligand was represented by its LOE solution if present, otherwise the cluster one was retained if it satisfied the aforementioned filtering. Such a process eventually led to 5 different rankings that were subsequently unified using a parallel selection method.33-34
Virtual Screening using Energy Weighted Grids (EWVS)
In AD4, the protein is described by a set of grid maps, one for each atom type of the ligand. These pre-calculated grids of interaction energy are achieved through the program AutoGrid4, which places probe atoms (one for each ligand atom type) at discrete points in the space around the target protein and then associates to this point the values of interaction energies between the probe and the surrounding protein atoms. The employment of these grids of interaction energy values in docking calculations has the advantage of accelerating the docking process since only a simple interpolation is needed to calculate the interaction energy of a specific ligand conformation in a protein rather than the computation of the pairwise atomic interaction energies when the protein is explicitly treated. In the above mentioned grids the regions occupied by the receptor are described by high positive values and accessible regions are described by negative values of a few kcal/mol. The description of a protein through grid maps can also allow the inclusion of protein flexibility in docking calculations. In fact, if several conformations of the protein are available, a set of different maps can be computed for each of them. Then, these grids can be combined into a single set of maps derived from such the combination. As reported by Österberg et al.,20 among the several methods to combine these maps the energy weighting scheme seems to be the most physically meaningful. According to this scheme, a weighted average of the energies is computed at each point of the grid and the weight (W) is calculated using the Boltzman assumption based on the interaction energy (ΔG):
.
The calculated weights are normalized as the average is calculated. In such a function when points in any of the grids have negative values, then the associated weight will prevail in the average. On the contrary, in highly repulsive regions where points from all grids have positive values, the average will be described by a positive value.
The above described method was used to calculate the energy-weighted grids for BACE-1. In principle all the available crystal structure could have been used in the computation of the energy-weighted grids. Nevertheless, it is worth noting that the grids are calculated as an average of the energies of each individual conformation, weighted by how often we would expect to find them in the ensemble. Therefore, the inclusion of some redundant structures would have given a higher weight to these conformations, thus biasing the result of the energy-weighted grids.
Starting from these considerations we decided to employ the same 5 crystals (PDB codes 1FKN, 1TQF, 1W51, 1XN3, 2G94) that were used for the EVS. This also allowed a direct comparison of the results of the two computational strategies. As an example, Figure 2 depicts the calculated oxygen maps for the highly flexible Arg235 and, for comparison, the standard oxygen energy grid calculated on 1FKN. In the latter, it is evident that the favourable interaction energies are located near the H-bond donors (Figure 2 panel a) while the unfavourable contours are present in the region occupied by the protein atoms (Figure 2 panel b). In the energy-weighted grids the favourable interaction energies are located around the H-bond donors of all the considered structures (Figure 2 panel c), while the unfavourable interaction energies are located only in the regions that are more frequently occupied by the atoms of all the considered proteins (Figure 2 panel d).
Figure 2.

Grids maps of oxygen interaction energy: (a) and (b) standard maps calculated on structure with PDB code 1FKN, (c) and (d) energy-weighted grid maps. The view is centred on Arg235, which shows significant motion. Strong repulsive energies are shown in red (b) and (d) at a contour level of 250 kcal/mol; favourable peaks are shown in blue at a contour level of -4.0 Kcal/mol.
These energy grids were used to perform the EWVS calculation on the same database used for the EVS. The screened database was then ranked according to the predicted ΔGbind values and the filtering scheme applied for the EVS was also used in the EWVS. All the solutions not satisfying the filtering scheme were not considered further.
EVS and EWVS Performance
The 45 known inhibitors included in the screened database allowed evaluation of the performance of the two adopted VS approaches. A broadly used index to measure a VS calculation is the enrichment factor, defined as the percentage of known inhibitors in a specified top percentage of the ranked database:
Figure 3 shows the enrichment results of the EVS and EWVS. Detailed data are presented in Table 1, showing the enrichment factors at several different database percentages (1, 2, 5, and 10%). Results of single rigid-receptor docking are also given in Figure 3 and Table 1 for comparison.
Figure 3.

Comparison of the different VS methods on enrichment tests against BACE-1 (a), close-up view of the same histogram.
Table 1.
Enrichment factors calculated for single protein VSs, EVS and EWVS.
| Database % | 1FKN | 1TQF | 1W51 | 1XN3 | 2G94 | EVS | Average | EWVS |
|---|---|---|---|---|---|---|---|---|
| 1 | 10 | 8 | 6 | 2 | 4 | 8 | 6 | 2 |
| 2 | 12 | 15 | 9 | 4 | 12 | 10 | 10,4 | 6 |
| 5 | 12 | 10 | 9 | 4 | 11 | 12 | 9,2 | 6 |
| 10 | 7 | 7 | 6 | 4 | 7 | 7 | 6,2 | 7 |
As expected, and depicted in Figure 3, the EVS performs better than the VS on each single rigid receptor. From Figure 3 it seems that two VSs conducted on the single receptor (against 1FKN and 1TQF) perform better that EVS (blue line) at lower percentages of the ranked database (0%-3%). Indeed in 1FKN for some positive controls the LOE conformation has very low ΔGbind values. Nevertheless, these binding poses belong to clusters populated by less than ten individuals. As previously mentioned these conformations were discarded in EVS. As depicted in Figure 3, all the single receptor VSs placed 100% of the active compounds in the top 50% of the ranked database while the EVS placed all of them in the top 25% the ranked library. Therefore, as expected the inclusion of protein flexibility has a positive effect on docking calculations with BACE-1, suggesting that this is a beneficial strategy in receptor based VS simulations. With regard to EWVS, a different trend was observed. In fact, at lower percentages of the ranked database (0%-8%) EWVS performs worse than the EVS. In the 10% level of the ranked databases the two methodologies have the same performance. Then, as depicted in figure 3, the EWVS outperforms the EVS at higher percentages of the database and is able to pick 100% of the active compounds within just 20% of the database.
Biological Results
The filtering scheme applied to the EVS and EWVS produced 241 and 218 compounds, respectively. These sets of ligands were visually inspected in their predicted binding poses and only the ones that were able to establish favourable (H-bond, ionic) interactions with the catalytic aspartates (Asp32 and Asp228) were retained. From the two resulting rankings (one for each VS) the top 20 compounds were selected resulting in a set of 40 ligands (12 ligands were predicted to be top ranked by both methodologies and these were chosen only once). These compounds were obtained from the NCI (NCI/DTP Open Chemical Repository, http://dtp.cancer.gov). Prior to biological testing, compound composition and purity were evaluated through NMR spectroscopy (1H NMR) and mass spectrometry. Unfortunately, for six compounds experimental data did not confirm the claimed structure and therefore were discarded. More precisely, three were chosen from EVS, two from EWVS and one from both methodologies. Standard FRET methodology was used to evaluate BACE-1 inhibition of the remaining 34 test compounds. Two methods were adopted; method a) employs a peptide characterized from the Swedish mutated form of APP having (7-methoxycoumarin-4-yl)acetyl and dinitrophenyl as the fluorescent and quencher groups, respectively. In the method b), rhodamine is the fluorescent group of the substrate, while the quencher has an undisclosed structure. After enzymatic hydrolysis, substrate A gives a fluorescent product that emits at 405 nm, in a spectral region where many synthetic and natural ligands (carrying in their structure fluorescent aromatic rings and/or heterocycles) can interfere. For this reason, method b) was applied as an alternative to overcome the problem of the inhibitors’ intrinsic fluorescence as the cleavage product is detected at high and selective wavelengths (λexc/em=544/590 nm). To exclude the presence of promiscuous inhibitors both the aforementioned assay methods were carried out in the presence of a proper detergent (CHAPS).35 Of the 34 selected compounds 2 were not tested due to solubility issues, these ligands were from the EVS ranking. In Table 2, the compounds which were found to be active in the in vitro inhibition FRET assays are reported. Those compounds which showed interfering spectroscopic properties were assayed with method b). A majority of the molecules (17 out of 32) were able to inhibit BACE-1 (Table 3), the most active having IC50 values in the low micromolar range (1-5). Importantly, they were characterized by new structural features rather different from those of the already known BACE-1 inhibitors. Peptidic OM99-2 and inhibitor IV were used as standard potent peptidic inhibitors,36,37 that showed equivalent nanomolar potencies with both methods a and b. From the medicinal chemistry point of view, the newly discovered chemotypes exhibit significant molecular dissimilarities from the already known BACE-1 inhibitors and might represent promising non-peptidic hits to undergo subsequent optimization steps to improve BACE-1-inhibiting profile and eventually afford novel anti-AD lead candidates.
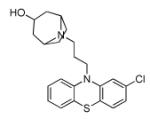
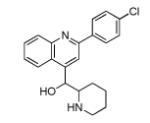
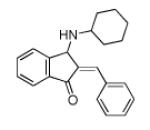
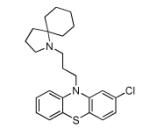
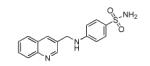
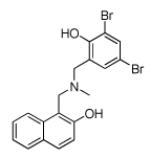
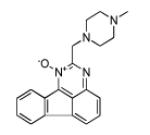
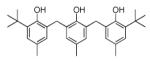
Table 2.
NCI codes, VS methodology, AD4 Binding Energies, Structures and Activities of the newly identified BACE 1 Inhibitor Compounds
| NSC # | VS Method | ΔGAD4 (Kcal/mol) | Focc. | Structure | IC50 (μM) |
|---|---|---|---|---|---|
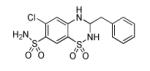
| 290956 | Both | −10.51 | 14 |

|
6.6±0.3 b |
| 263220 | Both | −10.51 | 26 |
|
12.1±0.4a |
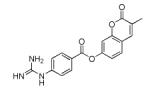
| 372490 | Both | −10.70 | 12 |

|
1.8±1.1b |
| 116490 | Both | −10.53 | 52 |
|
286±35 b |
| 48881 | Both | −10.84 | 14 |

|
645±163a |
| 162404 | EVS | −10.43 | 24 |
|
1.5±0.2b |
| 59349 | EVS | −10.82 | 20 |
|
127±38 b |
| 126710 | EVS | −10.35 | 23 |

|
829±346b |
| 13316 | EVS | −10.55 | 42 |
|
21.3±6.4b |
| 150117 | EVS | −10.13 | 52 |
|
521±168b |
| 19976 | EVS | −10.77 | 20 |
|
228±18b |
| 299209 | EVS | −10.02 | 17 |
|
346±22b |
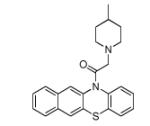
| 309874 | EWVS | −11.35 | 42 |

|
67.6±0.3a |
| 88852 | EWVS | −10.25 | 17 |
|
147±55b |
| 170561 | EWVS | −10.20 | 56 |
|
315±77b |
| 62914 | EWVS | −10.20 | 14 |
|
292±68a |
| 79563 | EWVS | −12.24 | 32 |

|
40.0±11.3a |
For full explanation of the two different methods employed for BACE 1 inhibition assays see experimental methods.
For full explanation of the two different methods employed for BACE 1 inhibition assays see experimental methods.
Conclusions
The present lead-discovery campaign was highly successful because out of 32 tested compounds 17 of them displayed detectable BACE-1 inhibiting properties with an overall success rate of 53.1%. This is well above the success rates we have ever obtained with AD438-40 and, more generally, it places the present study among the best performing examples of VS experiments. Such success should be ascribed to the inclusion of protein flexibility in VS calculation. In considering the performance of the two adopted methods, EVS slightly outperforms the EWVS, having a 50.0% versus a 38.4% success rate, respectively. As already, mentioned by Osterberg et al.20 the application of energy-weighted grids for docking with AD4 could be limited in the case of higher degrees of protein flexibility such as the flap swing motion. Nevertheless, when applying such a methodology in high-throughput docking, the computing demands should also be considered. From, this point of view, EWVS is as fast as a single rigid receptor VS with AD4 while EVS requires a computational demand that grows linearly with the number of receptor conformations. Moreover, with this approach the individual VS’s result in a number of different rankings that must subsequently be integrated into a single one, employing one of the available integration models, which can arbitrarily influence the outcome of the VS campaign.
In conclusions, in the present study two different models of protein flexibility where employed in a practical VS campaign in the search for new BACE-1 inhibitors. The outstanding results outlined that including protein plasticity in the case of BACE-1 is mandatory to achieve higher success rates. Most importantly, this study also suggests the EWVS as a valid alternative to the more computationally intensive EVS. In fact, the two methodologies, while demonstrating similar predictive power, differ in their computational demands, making EWVS more suitable for screening large molecular databases in a real drug discovery campaign.
Computational and Experimental Methods
Virtual screening procedure
The AutoDock 4.0 (AD4)31 software package, as implemented through the graphical user interface AutoDockTools (ADT), was used to dock small molecules to different conformations of BACE-1 coming from X-ray crystallography studies. This software has already been proven to be successful in enabling the identification of active hits in several virtual screening campaigns.37 The enzyme files were prepared using published coordinates (PDB codes 1FKN,21 1TQF,27 1W51,26 1XN325 and 2G9428). The terminal residues were modified to charged quaternary amine and carboxylate forms. All atom values were generated automatically by ADT. The docking area was assigned visually around the enzyme active site. A grid of 60 Å × 60 Å × 60 Å with 0.375 Å spacing was calculated around the docking area for 13 ligand atom types using AutoGrid4. These atom types were sufficient to describe all atoms in the NCI database. The resulting 5 sets of grids (one for each BACE-1 chosen conformation) were also combined to calculate another set of grids following the above described weighting scheme.
For VS, compound structures of the NCI Diversity Set were prepared using the ZINC database server (http://zinc.docking.org/)30 to take into account the different protomeric and tautomeric states of each compound. All the ligands were then converted into the AutoDock format file (.pdbqt). For each ligand, 100 separate docking calculations were performed. Each docking calculation consisted of 10 million energy evaluations using the Lamarckian genetic algorithm local search (GALS) method. The GALS method evaluates a population of possible docking solutions and propagates the most successful individuals from each generation into the subsequent generation of possible solutions. A low-frequency local search according to the method of Solis and Wets is applied to docking trials to ensure that the final solution represents a local minimum. All dockings described in this paper were performed with a population size of 150, and up to 300 rounds of Solis and Wets local search were applied with a probability of 0.06. A mutation rate of 0.02 and a crossover rate of 0.8 were used to generate new docking trials for subsequent generations, and the best individual from each generation was propagated to the next generation. The docking results from each calculation were clustered on the basis of root-mean-square deviation (rmsd) between the Cartesian coordinates of the atoms and were ranked on the basis of free energy of binding. The top-ranked compounds were visually inspected for good chemical geometry.
FRET inhibition studies
FRET inhibition studies were performed using the following procedures:
Method a): 5 μL of test compound (or DMSO) were pre-incubated with 175 μL of BACE-1 (17.2 nM, final concentration) in 20 mM sodium acetate pH 4.5 containing CHAPS (0.1% w/v) for 1 hour at room temperature. M-2420 (3 μM, final concentration) was then added and left to react for 15 min at 37°C. The fluorescence signal was read at λem = 405 nm (λexc = 320 nm). DMSO concentration in the final mixture was maintained below 5% (v/v) to guarantee no significant loss of enzyme activity.
Method b): stock solutions of tested compounds were prepared in DMSO and then diluted in 20 mM sodium acetate buffer pH 4.5. Both an aliquot of 20 μL of this last dilution and sodium acetate buffer as a blank, were pre-incubated with 20 μL of BACE-1 (17.2 nM, final concentration) in 20 mM sodium acetate pH 4.5 for 1 hour at room temperature. An aliquot of 20 μL of Invitrogen substrate (0.25 μM, final concentration) was then added and left to react for 60 min at 37°C. To stop the reaction, 20 μL of 2.5 M sodium acetate were added to each well. The fluorescence signal was read at λem = 590 nm, λexc = 544 nm.
Fluorescence intensities with and without inhibitors were registered and compared. The percent inhibition due to the presence of test compounds was calculated. The background signal was measured in control wells containing all the reagents, except hrBACE-1, and subtracted. The % inhibition due to the presence of test compound was calculated by the following expression: 100-(IFi/IFo × 100) where IFi and IFo are the fluorescence intensities obtained for hrBACE-1 in the presence and in the absence of inhibitor, respectively.41 Inhibition curve was obtained by plotting the % inhibition versus the logarithm of inhibitor concentration in the assay sample. The linear regression parameters were determined and the IC50 interpolated (GraphPad Prism 4.0, GraphPad Software Inc.).
For compounds that at 100 μM showed an inhibition lower than 50%, IC50 values were obtained by the following formula: IC50= [I](100/% inhibition 1), where [I] is the concentration of the tested inhibitor and % inhibition is the observed inhibition percentage.42 Further confirmation of the inhibiting properties of the reported compounds has also been assessed with different experimental methodologies developed by us and reported elsewhere.43
Supplementary Material
ACKNOWLEDGMENT
SC thanks Dr. Garrett M. Morris and Dr. Ruth Huey for valuable discussions and technical assistance.
Funding Sources Regione Campania L.R. 05/02 grant (to L.R.) and NIH 5R01 GM069832 (to A.J.O) are gratefully acknowledged for financial support.
ABBREVIATIONS
- VS
virtual screening
- EVS
ensemble virtual screening
- NCI
National Cancer Institute
- EWVS
energy-weighted grid virtual screening
- RMSD
root-mean square deviation
- PDB
protein data bank
- AD4
AutoDock4.2
- LOE
Lowest Overall Energy
- LEBC
Lowest Energy of Best Cluster
Footnotes
Author Contributions The manuscript was written through contributions of all authors. All authors have given approval to the final version of the manuscript.
Supporting Information. Additional tables describing the conformations of the X-ray BACE-1 structures, the structures of the used positive controls, 1H NMR and MS for the BACE-1 inhibitors reported in Table 2. This material is available free of charge via the Internet at http://pubs.acs.org.
REFERENCES
- (1).Teague SJ. Implications of protein flexibility for drug discovery. Nat. Rev. Drug. Discov. 2003;2:527–541. doi: 10.1038/nrd1129. [DOI] [PubMed] [Google Scholar]
- (2).Brooijmans N, Kuntz ID. Molecular recognition and docking algorithms. Annu. Rev. Biophys. Biomol. Struct. 2003;32:335–373. doi: 10.1146/annurev.biophys.32.110601.142532. [DOI] [PubMed] [Google Scholar]
- (3).Carlson HA. Protein flexibility is an important component of structure–based drug discovery. Curr. Pharm. Des. 2002;8:1571–1578. doi: 10.2174/1381612023394232. [DOI] [PubMed] [Google Scholar]
- (4).Teodoro ML, Kavraki LE. Conformational flexibility models for the receptor in structure based drug design. Curr. Pharm. Des. 2003;9:1635–1648. doi: 10.2174/1381612033454595. [DOI] [PubMed] [Google Scholar]
- (5).Ivetac A, McCammon JA. Molecular recognition in the case of flexible targets. Curr. Pharm. Des. 2011;17:1663–1671. doi: 10.2174/138161211796355056. [DOI] [PMC free article] [PubMed] [Google Scholar]
- (6).Leach AR. Ligand docking to proteins with discrete side–chain flexibility. J. Mol. Biol. 1994;235:345–356. doi: 10.1016/s0022-2836(05)80038-5. [DOI] [PubMed] [Google Scholar]
- (7).Desmet J, Wilson IA, Joniau M, De Maeyer M, Lasters I. Computation of the binding of fully flexible peptides to proteins with flexible side chains. FASEB J. 1997;11:164–172. doi: 10.1096/fasebj.11.2.9039959. [DOI] [PubMed] [Google Scholar]
- (8).Althaus EO, Kohlbacher HP, Lenhof P, Müller P. A combinatorial approach to protein docking with flexible side chains. J. Comput. Biol. 2002;9:597–612. doi: 10.1089/106652702760277336. [DOI] [PubMed] [Google Scholar]
- (9).Jiang F, Kim SH. “Soft docking”: matching of molecular surface cubes. J. Mol. Biol. 1991;219:79–102. doi: 10.1016/0022-2836(91)90859-5. [DOI] [PubMed] [Google Scholar]
- (10).Apostolakis J, Pluckthun A, Caflisch A. Docking small ligands in flexible binding sites. J. Comput. Chem. 1998;19:21–37. [Google Scholar]
- (11).Mangoni M, Roccatano D, Di Nola A. Docking of flexible ligands to flexible receptors in solution by molecular dynamics simulation. Proteins. 1999;35:153–162. doi: 10.1002/(sici)1097-0134(19990501)35:2<153::aid-prot2>3.0.co;2-e. [DOI] [PubMed] [Google Scholar]
- (12).Zhao Y, Sanner MF. Protein–ligand docking with multiple flexible side chains. J. Comput. Aided. Mol. Des. 2008;22:673–679. doi: 10.1007/s10822-007-9148-5. [DOI] [PMC free article] [PubMed] [Google Scholar]
- (13).Carlson HA, McCammon JA. Accommodating protein flexibility in computational drug design. Mol. Pharmacol. 2000;57:213–218. [PubMed] [Google Scholar]
- (14).Limongelli V, Marinelli L, Cosconati S, Braun HA, Schmidt B, Novellino E. Ensemble–docking approach on BACE–1: pharmacophore perception and guidelines for drug design. ChemMedChem. 2007;2:667–78. doi: 10.1002/cmdc.200600314. [DOI] [PubMed] [Google Scholar]
- (15).Ghosh AK, Brindisi M, Tang J. Developing β–secretase inhibitors for treatment of Alzheimer’s disease. J. Neurochem. 2012;120:71–83. doi: 10.1111/j.1471-4159.2011.07476.x. [DOI] [PMC free article] [PubMed] [Google Scholar]
- (16).Wolfe MS. Secretase Targets for Alzheimer’s Disease: Identification and Therapeutic Potential. J. Med. Chem. 2001;44:2039–2060. doi: 10.1021/jm0004897. [DOI] [PubMed] [Google Scholar]
- (17).Claussen H, Buning C, Rarey M, Lengauer T. FlexE: efficient molecular docking considering protein structure variations. J. Mol. Biol. 2001;308:377–395. doi: 10.1006/jmbi.2001.4551. [DOI] [PubMed] [Google Scholar]
- (18).Wei BQ, Weaver LH, Ferrari AM, Matthews BW, Shoichet BK. Testing a flexible–receptor docking algorithm in a model binding site. J. Mol. Biol. 2004;337:1161–1182. doi: 10.1016/j.jmb.2004.02.015. [DOI] [PubMed] [Google Scholar]
- (19).Ferrari AM, Wei BQ, Costantino L, Shoichet BK. Soft docking and multiple receptor conformations in virtual screening. J. Med. Chem. 2004;47:5076–5084. doi: 10.1021/jm049756p. [DOI] [PMC free article] [PubMed] [Google Scholar]
- (20).Osterberg F, Morris GM, Sanner MF, Olson AJ, Goodsell DS. Automated docking to multiple target structures: incorporation of protein mobility and structural water heterogeneity in AutoDock. Proteins. 2002;46:34–40. doi: 10.1002/prot.10028. [DOI] [PubMed] [Google Scholar]
- (21).Hong L, Koelsch G, Lin X, Wu S, Terzyan S, Ghosh AK, Zhang XC, Tang J. Structure of the protease domain of memapsin 2 (beta–secretase) complexed with inhibitor. Science. 2000;290:150–153. doi: 10.1126/science.290.5489.150. [DOI] [PubMed] [Google Scholar]
- (22).Ghosh AK, Devasamudram T, Hong L, De Zutter C, Xu X, Weerasena V, Koelsch G, Bilcer G, Tang J. Structure–based design of cycloamide–urethane–derived novel inhibitors of human brain memapsin 2 (beta–secretase) Bioorg. Med. Chem. Lett. 2005;15:15–20. doi: 10.1016/j.bmcl.2004.10.084. [DOI] [PubMed] [Google Scholar]
- (23).Baxter EW, Conway KA, Kennis L, Bischoff F, Mercken MH, Winter HL, Reynolds CH, Tounge BA, Luo C, Scott MK, Huang Y, Braeken M, Pieters SM, Berthelot DJ, Masure S, Bruinzeel WD, Jordan AD, Parker MH, Boyd RE, Qu J, Alexander RS, Brenneman DE, Reitz AB. 2–Amino–3,4–dihydroquinazolines as inhibitors of BACE–1 (beta–site APP cleaving enzyme): Use of structure based design to convert a micromolar hit into a nanomolar lead. J. Med. Chem. 2007;50:4261–4264. doi: 10.1021/jm0705408. [DOI] [PubMed] [Google Scholar]
- (24).Wångsell F, Nordeman P, Sävmarker J, Emanuelsson R, Jansson K, Lindberg J, Rosenquist S, Samuelsson B, Larhed M. Source Investigation of α–phenylnorstatine and α–benzylnorstatine as transition state isostere motifs in the search for new BACE–1 inhibitors. Bioorg. Med. Chem. 2011;19:145–155. doi: 10.1016/j.bmc.2010.11.042. [DOI] [PubMed] [Google Scholar]
- (25).Turner RT, 3rd, Hong L, Koelsch G, Ghosh AK, Tang J. Structural locations and functional roles of new subsites S5, S6, and S7 in memapsin 2 (beta–secretase) Biochemistry. 2005;44:105–112. doi: 10.1021/bi048106k. [DOI] [PubMed] [Google Scholar]
- (26).Patel S, Vuillard L, Cleasby A, Murray CW, Yon J. Apo and inhibitor complex structures of BACE (beta–secretase) J. Mol. Biol. 2004;343:407–416. doi: 10.1016/j.jmb.2004.08.018. [DOI] [PubMed] [Google Scholar]
- (27).Coburn CA, Stachel SJ, Li YM, Rush DM, Steele TG, Chen–Dodson E, Holloway MK, Xu M, Huang Q, Lai MT, Di Muzio J, Crouthamel MC, Shi XP, Sardana V, Chen Z, Munshi S, Kuo L, Makara GM, Annis DA, Tadikonda PK, Nash HM, Vacca JP, Wang T. Identification of a small molecule nonpeptide active site beta–secretase inhibitor that displays a nontraditional binding mode for aspartyl proteases. J. Med. Chem. 2004;47:6117–6119. doi: 10.1021/jm049388p. [DOI] [PubMed] [Google Scholar]
- (28).Ghosh AK, Kumaragurubaran N, Hong L, Lei H, Hussain KA, Liu CF, Devasamudram T, Weerasena V, Turner R, Koelsch G, Bilcer G, Tang J. Design, synthesis and X–ray structure of protein–ligand complexes: important insight into selectivity of memapsin 2 (beta–secretase) inhibitors. J. Am. Chem. Soc. 2006;128:5310–5311. doi: 10.1021/ja058636j. [DOI] [PMC free article] [PubMed] [Google Scholar]
- (29). http://dtp.nci.nih.gov/branches/dscb/div2_explanation.html.
- (30).Irwin JJ, Shoichet BK. ZINC—a free database of commercially available compounds for virtual screening. J. Chem. Inf. Model. 2005;45:177–182. doi: 10.1021/ci049714. [DOI] [PMC free article] [PubMed] [Google Scholar]
- (31).Huey R, Morris GM, Olson AJ, Goodsell DS. A semiempirical free energy force field with charge–based desolvation. J. Comput. Chem. 2007;28:1145–1152. doi: 10.1002/jcc.20634. [DOI] [PubMed] [Google Scholar]
- (32).Cosconati S, Forli S, Perryman AL, Harris R, Goodsell DS, Olson AJ. Virtual Screening with AutoDock: Theory and Practice. Expert. Opin. Drug. Discov. 2010;5:597–607. doi: 10.1517/17460441.2010.484460. [DOI] [PMC free article] [PubMed] [Google Scholar]
- (33).Tan L, Geppert H, Sisay MT, Gütschow M, Bajorath J. Integrating Structure– and Ligand–Based Virtual Screening: Comparison of Individual, Parallel, and Fused Molecular Docking and Similarity Search Calculations on Multiple Targets. ChemMedChem. 2008;3:1566–1571. doi: 10.1002/cmdc.200800129. [DOI] [PubMed] [Google Scholar]
- (34).Krüger DM, Evers A. Comparison of Structure- and Ligand-Based Virtual Screening Protocols Considering Hit List Complementarity and Enrichment Factors. ChemMedChem. 2010;5:148–158. doi: 10.1002/cmdc.200900314. [DOI] [PubMed] [Google Scholar]
- (35).Ryan AJ, Gray NM, Lowe PN, Chung C. Effect of Detergent on “Promiscuous” Inhibitors. J. Med. Chem. 2003;46:3448–3451. doi: 10.1021/jm0340896. [DOI] [PubMed] [Google Scholar]
- (36).Hong L, Koelsch G, Lin X, Wu S, Terzyan S, Ghosh AK, Zhang XC, Tang J. Structure of the protease domain of memapsin 2 (beta–secretase) complexed with inhibitor. Science. 2000;290:150–153. doi: 10.1126/science.290.5489.150. [DOI] [PubMed] [Google Scholar]
- (37).Stachel SJ, Coburn CA, Steele TG, Jones KG, Loutzenhiser EF, Gregro AR, Rajapakse HA, Lai MT, Crouthamel MC, Xu M, Tugusheva K, Lineberger JE, Pietrak BL, Espeseth AS, Shi XP, Chen–Dodson E, Holloway MK, Munshi S, Simon AJ, Kuo L, Vacca JP. Structure–based design of potent and selective cell–permeable inhibitors of human beta–secretase (BACE–1) J. Med. Chem. 2004;47:6447–6450. doi: 10.1021/jm049379g. [DOI] [PubMed] [Google Scholar]
- (38).Cosconati S, Marinelli L, Trotta R, Virno A, Mayol L, Novellino E, Olson AJ, Randazzo A. Tandem Application of Virtual Screening and NMR Experiments in the Discovery of Brand New DNA Quadruplex Groove Binders. J. Am. Chem. Soc. 2009;131:16336–16337. doi: 10.1021/ja9063662. [DOI] [PubMed] [Google Scholar]
- (39).Cosconati S, Marinelli L, La Motta C, Sartini S, Da Settimo F, Olson AJ, Novellino E. Pursuing Aldose Reductase Inhibitors through in Situ Cross–Docking and Similarity–Based Virtual Screening. J. Med. Chem. 2009;52:5578–5581. doi: 10.1021/jm901045w. [DOI] [PubMed] [Google Scholar]
- (40).Cosconati S, Hong JA, Novellino E, Carroll KS, Goodsell DS, Olson AJ. Structure–Based Virtual Screening and Biological Evaluation of Mycobacterium tuberculosis Adenosine 5′–Phosphosulfate Reductase Inhibitors. J. Med. Chem. 2008;51:6627–6630. doi: 10.1021/jm800571m. [DOI] [PMC free article] [PubMed] [Google Scholar]
- (41).Mancini F, De Simone A, Andrisano V. Beta–secretase as a target for Alzheimer’s disease drug discovery: an overview of in vitro methods for characterization of inhibitors. Anal. Biochem. 2011;400:215–225. doi: 10.1007/s00216-011-4963-x. [DOI] [PubMed] [Google Scholar]
- (42).Kornacker MG, Lai Z, Witmer M, Ma J, Hendrick J, Lee VG, Riexinger DJ, Mapelli C, Metzler W, Copeland RA. An inhibitor binding pocket distinct from the catalytic active site on human beta–APP cleaving enzyme. Biochemistry. 2005;44:1567–11573. doi: 10.1021/bi050932l. [DOI] [PubMed] [Google Scholar]
- (43).De Simone A, Mancini F, Cosconati S, Marinelli L, La Pietra V, Novellino E, Andrisano V. Human recombinant beta secretase immobilized enzyme reactor for fast hits’ selection and characterization from a virtual screening library. J. Pharm. Biomed. Anal. doi: 10.1016/j.jpba.2012.03.006. in press. ( http://dx.doi.org/10.1016/j.jpba.2012.03.006) [DOI] [PubMed] [Google Scholar]
Associated Data
This section collects any data citations, data availability statements, or supplementary materials included in this article.