

Abstract
Δ9-tetrahydrocannabinol (THC) is the illicit drug most frequently observed in accident and driving under the influence of drugs investigations. Whole blood is often the only available specimen collected during such investigations, yet few studies have examined relationships between cannabis effects and whole blood concentrations following cannabis smoking.
Nine male and one female heavy, chronic cannabis smokers resided on a closed research unit and smoked ad libitum one 6.8% THC cannabis cigarette. THC, 11-hydroxy-THC and 11-nor-9-carboxy-THC were quantified in whole blood and plasma. Assessments were performed before and up to 6 h after smoking, including subjective [visual analog scales (VAS) and Likert scales], physiological (heart rate, blood pressure and respirations) and psychomotor (critical-tracking and divided-attention tasks) measures.
THC significantly increased VAS responses and heart rate, with concentration-effect curves demonstrating counter-clockwise hysteresis. No significant differences were observed for critical-tracking or divided-attention task performance in this cohort of heavy, chronic cannabis smokers. The cannabis influence factor was not suitable for quantifying psychomotor impairment following cannabis consumption and was not precise enough to determine recent cannabis use with accuracy.
These data inform our understanding of impairment and subjective effects following acute smoked cannabis and interpretation of whole blood cannabinoid concentrations in forensic investigations.
Introduction
An estimated 125–203 million persons aged 15–64 worldwide smoked cannabis at least once in the previous year (1), with 16.7 million Americans and 18.1% of individuals aged 18–25 years smoking cannabis in the previous 30 days (2). Additionally, cannabis is the most common illicit substance detected in blood and oral fluid of nighttime drivers (3). Although impairment cannot be assumed from drug presence, detection windows in these matrices are relatively short for less than daily cannabis smokers (4–6), increasing impairment probability following a positive test.
The primary psychoactive chemical in cannabis, Δ9-tetrahydrocannabinol (THC), is metabolized in vivo to several phase I metabolites, most prominently the equipotent 11-hydroxy-THC (11-OH-THC) and non-psychoactive 11-nor-9-carboxy-THC (THCCOOH) (7–8). Several studies have investigated cannabinoid metabolism and urine, plasma and oral fluid pharmacokinetics following acute and chronic oral, smoked and intravenous THC administration (9–14). Recently, we investigated whole blood cannabinoid pharmacokinetics with direct liquid chromatography tandem mass spectrometry (LC–MS-MS) analysis for the first time, providing valuable data regarding cannabinoid detection in this matrix following cannabis smoking (15).
THC is detectable in plasma within seconds after the first puff of a cannabis cigarette, with dose-related tachycardia, subjective “high” and conjunctival injection (9, 10, 12, 16). Cannabis impairs psychomotor performance, cognition and driving ability in both driving simulators and on-the-road driving tests (17–25). Hunault et al. examined cognitive and psychomotor effects following smoked cannabis containing up to 69 mg THC and observed significant, dose-related impairing effects following paced smoking in primarily occasional cannabis smokers (26). Papafotiou examined cannabis-induced impairment in a driving simulator in cannabis smokers with unknown histories after one week of abstinence; significant impairment was observed 80 min but not 30 min after smoking a 1.74 or 2.93% THC cannabis cigarette (27). However, Ramaekers et al. studied effects of cannabis smoking (13% THC, 500 µg/kg) in heavy (>4 days/week) and occasional (≤1x/week) smokers and found significant impairment in tracking performance, divided attention, and inhibitory control in occasional, but not heavy smokers (28).
The cannabis influence factor (CIF), described by Daldrup as a predictor of cannabis-induced impairment, is calculated as molar blood [THC] + [11-OH-THC] divided by [THCCOOH] (29). A CIF > 10 was proposed to predict cannabis-induced impairment analogous to a 0.11 g/dL blood alcohol concentration. Menetrey et al. examined this model following controlled oral cannabis decoction (hemp extracted into hot milk) administration (30), yet none, to our knowledge, examined this following controlled cannabis smoking.
The present study examined relationships between whole blood cannabinoid concentrations and pharmacodynamic effects in heavy, chronic cannabis smokers. Cannabis-induced effects were determined in critical tracking and divided attention task performance, subjective and physiological measures, as well as the CIF, following cannabis smoking. These data should facilitate interpretation of whole blood cannabinoid results, often the only specimen available in driving under the influence of drugs (DUID), accident and other forensic investigations.
Materials and Methods
Participants
Participants provided written informed consent for this National Institute on Drug Abuse Institutional Review Board-approved protocol and this study was performed in accordance with the Declaration of Helsinki. Inclusion criteria were cannabis use at least twice monthly for three months before study entry, positive urine cannabinoid test, 18–45 years old, normal cardiac function and veins suitable for intravenous catheter placement. Clinically significant medical or psychiatric disease, history of clinically significant adverse event associated with cannabis intoxication, current interest in drug abuse treatment, pregnancy or nursing, or blood donation in the previous 30 days were exclusionary. Participants were heavy (>4 days/week) and chronic (>2 years) cannabis smokers admitted to the secure research unit 15–20 h before dosing; no cannabis use restrictions were enforced prior to admission. All participants underwent an immunoassay-based urine drug screen (iScreen™, Instant Technologies, Inc, Norfolk, VA) on admission and were negative for all substances other than THC. Cigarette smoking was permitted up to 30 min before and after 90 min following THC dosing.
Smoked cannabis administration and blood collection
The NIDA Chemistry and Physiological Systems Research Branch supplied cannabis cigarettes containing 6.8 ± 0.2% THC, 0.25 ± 0.08% CBD and 0.21 ± 0.02% CBN (w/w). Mean cigarette weight was 0.79 ± 0.16 g, yielding total THC, CBD and CBN content of 54, 2.0 and 1.7 mg per cigarette, respectively. Participants smoked a single cigarette ad libitum for 10 min while seated with legs elevated, and remained in this position during the data collection period. Whole blood and plasma were collected on ice into sodium heparin blood tubes via indwelling intravenous catheter 0.5 h before and 0.25, 0.5, 1, 2, 3, 4 and 6 h after the start of smoking. Blood collected for plasma was centrifuged (1,600 x g, 15 min) and plasma separated within 2 h.
Cannabinoid analysis
Cannabinoids were quantified by a previously validated LC–MS-MS method (31). Briefly, 1.5 mL acetonitrile was added to 0.5 mL specimen to precipitate proteins. After mixing and centrifugation, the supernatant was diluted and subjected to solid-phase extraction (SPE). Extracts were evaporated, reconstituted and chromatographed; detection was via electrospray ionization. Imprecision was < 10.5% coefficient of variation (CV), recovery was > 50.5% and bias within ± 13.1% of target across the linear range. Limits of quantification (LOQ) were 1.0 µg/L for THC, 11-OH-THC and THCCOOH.
Subjective scales
Visual analog scales (VAS) were presented on a computer screen –0.5, 0.25, 0.5, 1, 2, 3, 4 and 6 h after the start of smoking. Participants indicated the magnitude of “Good Drug Effect,” “High,” “Stoned,” “Stimulated,” “Sedated,” “Anxious” and “Restless” on a 100-mm line anchored with “not at all” and “most ever.” Position on the scale was converted to a percentage between 0 and 100.
5-point Likert scales for “Difficulty concentrating,” “Altered sense of time,” “Slowed or slurred speech,” “Body feels sluggish or heavy,” “Feel hungry,” “Feel thirsty,” “Shakiness/tremulousness,” “Nausea,” “Headache,” “Palpitations,” “Dizzy” and “Dry mouth or throat” were presented on a computer screen immediately following VAS. Participants selected the response best characterizing their condition: 1, none; 2, slight; 3, mild; 4, moderate; or 5, severe.
Cardiovascular measures
Blood pressure (systolic and diastolic), heart rate and respiratory rate were measured before and after smoking at –0.25, 0.5, 1, 1.5, 2, 2.5, 3, 4, 5 and 6 h.
Cannabis influence factor
CIF was calculated as 100 × ([THC] + [11-OH-THC])/[THCCOOH] (29, 30) for all whole blood and plasma samples; analytes detected below LOQ were considered to have 0.0 nmol/mL.
Impairment assessments
The “critical tracking task” (32) measures a participant's ability to control a displayed error signal in a first-order compensatory tracking task. Error is displayed as a horizontal deviation of a cursor from the midpoint on a horizontal, linear scale. Compensatory joystick movements null the error by returning the cursor to the midpoint. The frequency of cursor deviations, and, therefore, its velocity, increases as a stochastic, linear function of time. Control is lost at the point where the compensatory response lags the cursor's last movement by 180 degrees. The response frequency at this point is defined as the critical frequency or lambda-c (λc). The test includes five trials. The average of the middle three scores (i.e., deleting the highest and lowest) is taken as the final score. This 2-min task was performed before smoking and 1.5, 3 and 5.5 h after starting smoking.
The “divided attention task” (33) measures a participant's ability to divide attention between two simultaneous tasks. The primary task is the same as the critical tracking task described previously, with the exception that the velocity of the error signal is kept constant at 50% of the participant's optimal performance (λc/2). Tracking error is measured by the absolute distance (mm) between the cursor's position and the center of the scale. The secondary task involves monitoring 24 single-digit numbers (0–9) displayed in the four corners of a central screen that change asynchronously every five seconds. The participant is required to remove his/her foot from a pedal-switch as quickly as possible any time the target numeral “2” appears. Mean absolute tracking error (mm), number of correct detections (hits) and number of control losses are the primary performance measures. This 15-min task was performed before smoking and at 1.6, 3.1 and 5.6 h after starting smoking.
Participants were trained before the study session to achieve stable task performance and minimize practice effects. Critical tracking task training continued until participants performed with < 10% variance from the average measured over three trials. The divided attention task was practiced for 12 minutes, regardless of final performance.
Calculations and statistical analysis
SPSS 15.0 for Windows (SPSS, Chicago, IL) was utilized for statistical evaluations. GLM repeated-measures ANOVA were conducted to investigate changes in participants’ VAS scores over time, with a Huynh-Feldt epsilon correction applied to counter sphericity violations. Bonferroni post-hoc testing determined differences between specific time points. Wilcoxon signed-rank tests evaluated differences between whole blood and plasma CIF values at each time point. Areas within concentration-effect curves were calculated in a manner similar to Galeazzi et al. (34) by subtracting the total area under the lower limb of the curve from that under the upper limb, determined by the trapezoidal rule. P values ≤ 0.05 were considered significant. Other statistical calculations were performed with GraphPad Prism 5.2 for Windows (GraphPad Software, La Jolla, CA).
Results
Samples
Participant demographics and self-reported smoked cannabis histories are detailed in Table I. Ten participants (nine male, one female) completed the protocol. Age ranged from 18.5–45.7 years and BMI ranged from 18.1–32.0 kg/m2. Mean (standard deviation; SD) self-reported joints smoked in the previous 14 days was 11.7 (2.2), with a range of 10–168 joints. Only one scheduled blood sample (Participant I at 0.25 h) was not collected, due to catheter dislodgement.
Table I.
Demographics and Self-Reported Cannabis Smoking Characteristics for 10 Adult Cannabis Smokers*
| Subject | Sex | Race | Age (y) | BMI† (kg/m2) | Mean available dose‡ (μg/kg) | Days since last cannabis use | Typical joints/day | Days cannabis use/last 14 | Age 1st cannabis use (y) |
|---|---|---|---|---|---|---|---|---|---|
| A | M | White | 37.1 | 18.1 | 1,000 | 2 | 6 | 14 | 22 |
| B | M | African American | 26.5 | 30.6 | 560 | 3 | 2 | 10 | 16 |
| C | M | White | 45.7 | 32.0 | 480 | 1 | 5 | 14 | 12 |
| D | F | White | 27.7 | 22.3 | 980 | 1 | 6 | 8–9 | 15 |
| F | M | White | 34.1 | 23.0 | 720 | 2 | 1 | 10 | 16 |
| G | M | White | 22.2 | 22.9 | 560 | 1 | 12 | 14 | 15 |
| H | M | African American | 18.5 | 22.3 | 740 | 2 | 6 | 9 | 13 |
| I | M | African American | 41.5 | 25.5 | 690 | 3 | 6 | 12 | 19 |
| K | M | White | 22.5 | 20.9 | 710 | 4 | 2 | 13 | 16 |
| L | M | African American | 30.7 | 30.6 | 590 | 1 | 3 | 9 | 15 |
| Mean | 30.6 | 24.8 | 700 | 2.0 | 4.9 | 11.7 | 15.9 | ||
| SD | 8.9 | 4.7 | 170 | 1.1 | 3.2 | 2.2 | 2.8 |
*Adapted from Schwope et al. (15).
†BMI = weight (kg)/height2 (m).
‡Average amount of THC contained in cigarette (μg) divided by participant weight (kg).
Subjective effects following smoked cannabis
Cannabis smoking significantly increased “Good drug effect” [F(2.37, 21.36) = 17.6, P < 0.001], “High” [F(2.78, 25.02) = 26.03, P < 0.001], “Stoned” [F(2.94, 26.49) = 13.29, P < 0.001], “Stimulated” [F(3.25, 29.30) = 8.54, P < 0.001] and “Sedated” [F(4.70, 42.34) = 3.35, P = 0.014], but did not significantly change “Anxious” [F(4.82, 43.35) = 1.15, P = 0.349] or “Restless” [F(2.55, 22.91) = 2.58, P = 0.086] VAS scores.
Mean blood concentration-effect curves for each of the seven VAS scales are shown in Figures 1A–H. For all scales, observed peak THC blood concentration and peak VAS scores occurred 0.25 h after starting smoking, at the time of the first blood collection. Blood THC concentrations decreased rapidly, although subjective effects persisted. Starting approximately 1 h after smoking, subjective effects decreased linearly through 6 h, with THC concentrations changing more slowly during this period. This pharmacodynamic-pharmacokinetic relationship described a counterclockwise hysteresis for all VAS measures, demonstrating the lack of correlation between blood concentrations and observed effects until after the initial distribution phase.
Figure 1.

Median (inter-quartile range) whole-blood THC concentrations (A) and mean (SEM) hysteresis plots for seven VAS scales (B–H) following smoking of a 6.8% THC cannabis cigarette (n = 10). VAS scores are calculated as change from baseline (–0.5 h). Samples collected at –0.5, 0.25, 0.5, 1.0, 2.0, 3.0, 4.0 and 6.0 after starting smoking. Dotted line in THC plot indicates limit of quantification (1 µg/L). Arrows in hysteresis plots indicate samples collected over increasing time.
While group mean blood concentration-VAS relationships yielded consistent hysteresis effects, concentration-effect curves for individual subjects varied substantially (Figures 2A–L). All participants (except I) reported peak subjective “High” between 66 and 85; with peak whole blood THC concentrations at the time of these responses ranging from 13 (Participant A) to 63 µg/L (Participant L). There was no apparent relationship between hysteresis areas and age or self-reported frequency or chronicity of cannabis intake.
Figure 2.
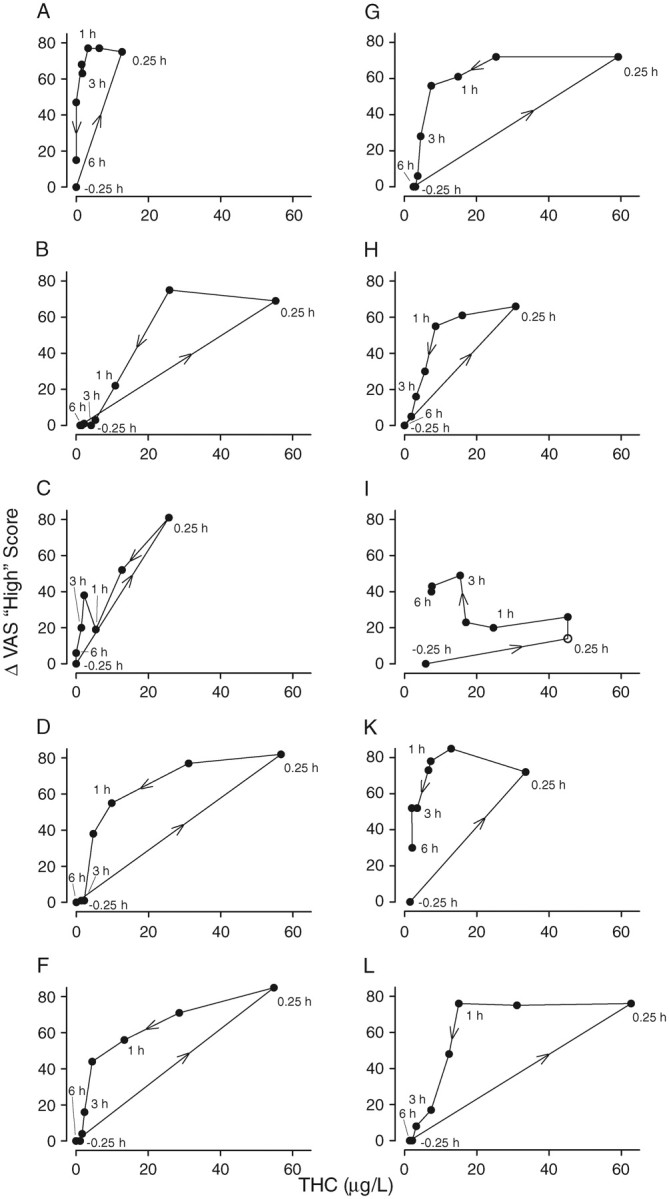
Individual (n = 10) hysteresis plots for “High” VAS scales following smoking of a 6.8% THC cannabis cigarette. VAS scores are calculated as change from baseline (–0.5 h). Samples collected at –0.5, 0.25, 0.5, 1.0, 2.0, 3.0, 4.0 and 6.0 after starting smoking (•), except for Participant I, which did not have blood at 0.25 h (o). Arrows in hysteresis plots indicate direction of plot.
Five-point Likert scales displayed varied effects. Participants reported significant increases compared to baseline for “Slowed or slurred speech” [F(2.10,18.9) = 4.35, P = 0.026], “Feel Hungry” [F(5.86, 52.7) = 22.0, P < 0.001], “Feel thirsty” [F(5.37, 48.3) = 19.2, P < 0.001], “Shakiness/tremulousness” [F(1.81, 16.3) = 4.19, P = 0.037] and “Dry mouth or throat” [F(6.34, 57.0) = 20.6, P < 0.001], with no significant increases observed for other Likert scales.
Cardiovascular measures
Cannabis smoking significantly increased heart rate only at 0.5 h [F(1, 9) = 11.99, P = 0.007]. Diastolic blood pressure decreased significantly only from 0.5 to 1 h, [F(1, 9) = 8.95, P = 0.015]. Systolic blood pressure and respiratory rate were unaffected at all times during the session.
Cannabis influence factor
CIF increased substantially immediately following cannabis smoking, reaching a median peak (range) of 150 (93–250) in whole blood and 170 (79–270) in plasma 0.25 h after starting smoking (Figure 3). CIF then rapidly decreased, although the rate of change lessened over time. Median (range) whole blood CIF was 13 (0.0–32) 4 h after smoking and 8.0 (0.0–27) 6 h after smoking; plasma CIF was 14 (6.9–34) at this final observation. Six-hour plasma CIF was significantly higher than baseline [F(1, 9) = 19.24, P = 0.002], although whole blood CIF was not [F(1, 9) = 4.35, P = 0.067]. No significant differences were observed between plasma and whole blood CIF at any time other than 6 h (T = 2, P = 0.037).
Figure 3.

Mean (SEM) CIF and VAS “High” score following ad libitum smoking of a 6.8% THC cannabis cigarette (n = 10). VAS score is calculated as change from baseline (–0.5 h). CIF calculated from molar whole blood concentrations as 100 × ([THC] + [11-OH-THC]) / [THCCOOH]. Samples collected at –0.5, 0.25, 0.5, 1.0, 2.0, 3.0, 4.0 and 6.0 after starting smoking. Dotted line at CIF = 10 indicates “impaired,” as proposed by Daldrup.
Critical tracking task/divided attention task
Cannabis smoking had no significant effects on critical tracking task performance in this population of almost-daily, chronic cannabis smokers (Figure 4). For the divided attention task, significant differences were observed between baseline and 3 h, F(3, 27) = 2.4, P = 0.022 for the number of correct identifications (hits) in the secondary peripheral stimuli task, although no significant differences were observed 1.5 h after smoking. No significant effects due to cannabis smoking were observed for control losses, reaction time or tracking error.
Figure 4.

Mean (SEM) values (n = 10) for lambda-c in the critical tracking task (CTT) and tracking error, hits and reaction time in the divided attention task (DAT) as a function of time after smoking ad libitum a single 6.8% THC cannabis cigarette. Samples collected after smoking at 1.5, 3 and 5.5 h for CTT and 1.6, 3.1 and 5.6 h for DAT; *P < 0.05 compared to baseline, repeated-measures ANOVA.
Discussion
The present study characterizes acute cannabis effects over 6 h after smoking a 6.8% THC cigarette containing approximately 54 mg THC in a sample of heavy, chronic cannabis smokers. Robust subjective and cardiovascular effects were observed, while psychomotor performance changes were modest. THC potency was selected to closely represent current mean illicit cannabis potency in seized US drugs, which increased from 3.4% in 1993 to 8.8% in 2008 (35). Thus, these data provide insight into the pharmacodynamics and pharmacokinetics of the higher-potency cannabis currently prevalent in the US.
As expected, smoking a single cannabis cigarette significantly increased positive effects such as “Good drug effect,” “High,” “Stoned,” “Stimulated” and “Sedated,” while having no significant effect on negative effects such as “Anxious” or “Restless.” The frequency and chronicity of cannabis smoking in our population may have minimized negative effects and adverse events.
When VAS subjective effects were compared to simultaneously collected whole blood THC concentrations, counter-clockwise hystereses were observed. Cocchetto et al. (36) first detailed hysteresis following cannabis smoking, indicating a delay in the onset of subjective effects as compared to plasma concentrations. Barnett et al. (37) also observed a counter-clockwise hysteresis for heart rate and THC plasma concentrations, and Chiang et al. (38) described differences in hysteresis areas for oral, smoked and intravenous THC based on differences in administration route or cannabis potency. In 1993, Cone and Huestis detailed hysteresis for “How much drug effect do you feel?” (measured by VAS) with multiple measurements of subjective effects and plasma concentrations obtained with a continuous blood withdrawal pump during cannabis smoking (10, 39). Data from the present study also documented a counter-clockwise hysteresis starting immediately after the end of smoking, and during the initial distribution and elimination phases.
Counter-clockwise hystereses are typically observed for drugs with a larger volume of distribution, drugs with active metabolites, or an indirect mechanism of drug action (40). Highly lipophilic THC, with 2- or 3-compartment pharmacokinetics and an equipotent metabolite (11-OH-THC), is a likely candidate for counter-clockwise hysteresis. Here, for the first time, we report hystereses for whole blood THC concentrations and several VAS scores, improving our understanding of subjective THC effects following ad libitum smoked cannabis. Yet, as demonstrated in Figures 2A–L, inter-individual variability is high for these concentration-effect curves. Hystereses may vary substantially depending on dose, experimental setting or prior chronicity or frequency of use (40).
Significant impairment differences were observed in tracking and divided attention tasks in frequent and occasional users following 500 µg/kg smoked cannabis (28). The authors suggested tolerance development to acute THC-induced impairment in the heavy smoker group, similar to the findings of Hart et al. (20). In the present study, we found minimal performance changes in critical tracking and divided attention tasks 1.5–5.5 h after smoking 700 µg/kg (range 480–1,000) THC (Table I). Most participants in the present study smoked cannabis almost daily for a mean (SD) of 7.2 (5.3) years, with several self-reporting numerous smoked joints per day. These findings support those reported by Ramaekers et al. and Hart et al., documenting significant subjective response and minimal impairment in driving-related psychomotor tasks in chronic daily cannabis smokers. Additional research is needed to determine whether tolerance develops to the impairment of complex driving skills in chronic daily cannabis smokers compared those who use cannabis occasionally.
Menetrey et al. investigated whole blood CIF following a cannabis decoction in milk containing 45.7 mg THC (30). A mean peak CIF of approximately 50 was achieved, decreasing to approximately 18 after 5.5 h, and 5 after 24 h. The present study examined CIF in whole blood and plasma following smoked cannabis intake, yielding peak median CIF of 150 and 170, respectively. CIF in whole blood and plasma were similar (Figure 3), with absolute CIF decreasing much more quickly than subjective “high.” This was expected, because blood cannabinoid concentrations decreased much more rapidly than subjective response (Figure 1A–H). Because we observed minimal impairment on tracking and divided attention tasks through 4 h after smoking, this model does not appear suitable for quantifying impairment following cannabis consumption in heavy, chronic cannabis smokers. Additionally, four participants had whole blood CIF > 10 in the baseline sample 0.5 h before smoking despite residence for more than 12 h on the closed clinical unit, precluding CIF as a definitive marker for recent cannabis intake.
As described by Schwope et al. (15), Mareck et al. (41), and Kelly et al. (42), detection of minor cannabinoids, CBD, CBN or THC-glucuronide may be beneficial in identifying recent cannabis intake. Our data indicated that these markers occurred during the period of strong subjective effects and potential impairment. Unfortunately, the frequent lengthy delay between cannabis smoking and sample collection during DUID and other investigations may preclude this approach, because concentrations may fall below current limits of quantification (15).
Concentration-effect curves for whole blood THC and subjective effects produced counter-clockwise hysteresis following ad libitum smoking of a single 6.8% THC cannabis cigarette. Despite whole blood THC concentrations of 13–63 µg/L 15 min after the start of cannabis smoking, little psychomotor impairment was observed, although there were robust cardiovascular and subjective responses. These data suggest differential tolerance to the psychomotor, but not other effects of THC in heavy, chronic cannabis smokers, as previously reported by others (20, 28). CIF did not accurately predict impairment or subjective response following a single cannabis cigarette, but a high value (≥ 30) may suggest recent cannabis intake. These data advance our understanding of whole blood pharmacodynamic-pharmacokinetic relationships following cannabis smoking in heavy, chronic cannabis smokers. Additional research is needed to provide insight into pharmacodynamic-pharmacokinetic relationships in occasional cannabis smokers, because impairment may differ with less frequent exposure.
Acknowledgments
We acknowledge Erin Karschner and Karl Scheidweiler for technical assistance in manuscript preparation and the NIDA Intramural Research Program clinical research team, especially Rebecca Price, John Etter, Janeen Nichels and Daniel Lipstein, for clinical support. This research was supported by the Intramural Research Program of the National Institute on Drug Abuse, National Institutes of Health.
References
- 1.United Nations Office on Drug and Crime. UN World Drug Report. 2011:11–18. [Google Scholar]
- 2.Substance Abuse and Mental Health Services Administration. Rockville, MD: Office of Applied Studies, NSDUH Series H-38A. Department of Health and Human Services (DHHS); 2010. Results from the 2009 national survey on drug use and health: National findings. [Google Scholar]
- 3.Compton R., Berning A. Washington, DC: NHTSA; 2009. Results of the 2007 national roadside survey of alcohol and drug use by drivers. [Google Scholar]
- 4.Huestis M.A., Henningfield J.E., Cone E.J. Blood cannabinoids. I. Absorption of THC and formation of 11-OH-THC and THCCOOH during and after smoking marijuana. Journal of Analytical Toxicology. 1992;16:276–282. doi: 10.1093/jat/16.5.276. [DOI] [PubMed] [Google Scholar]
- 5.Kauert G.F., Ramaekers J.G., Schneider E., Moeller M.R., Toennes S.W. Pharmacokinetic properties of delta9-tetrahydrocannabinol in serum and oral fluid. Journal of Analytical Toxicology. 2007;31:288–293. doi: 10.1093/jat/31.5.288. [DOI] [PubMed] [Google Scholar]
- 6.Niedbala R.S., Kardos K.W., Fritch D.F., Kardos S., Fries T., Waga J., et al. Detection of marijuana use by oral fluid and urine analysis following single-dose administration of smoked and oral marijuana. Journal of Analytical Toxicology. 2001;25:289–303. doi: 10.1093/jat/25.5.289. [DOI] [PubMed] [Google Scholar]
- 7.Matsunaga T., Iwawaki Y., Watanabe K., Yamamoto I., Kageyama T., Yoshimura H. Metabolism of delta-9-tetrahydrocannabinol by cytochrome P450 isozymes purified from hepatic microsomes of monkeys. Life Sciences. 1995;56:2089–2095. doi: 10.1016/0024-3205(95)00193-a. [DOI] [PubMed] [Google Scholar]
- 8.Watanabe K., Yamaori S., Funahashi T., Kimura T., Yamamoto I. Cytochrome P450 enzymes involved in the metabolism of tetrahydrocannabinols and cannabinol by human hepatic microsomes. Life Sciences. 2007;80:1415–1419. doi: 10.1016/j.lfs.2006.12.032. [DOI] [PubMed] [Google Scholar]
- 9.Benowitz N.L., Rosenberg J., Rogers W., Bachman J., Jones R.T. Cardiovascular effects of intravenous delta-9-tetrahydrocannabinol: Autonomic nervous mechanisms. Clinical Pharmacology & Therapeutics. 1979;25:440–446. doi: 10.1002/cpt1979254440. [DOI] [PubMed] [Google Scholar]
- 10.Huestis M.A., Sampson A.H., Holicky B.J., Henningfield J.E., Cone E.J. Characterization of the absorption phase of marijuana smoking. Clinical Pharmacology & Therapeutics. 1992;52:31–41. doi: 10.1038/clpt.1992.100. [DOI] [PubMed] [Google Scholar]
- 11.Milman G., Barnes A.J., Schwope D.M., Schwilke E.W., Darwin W.D., Goodwin R.S., et al. Disposition of cannabinoids in oral fluid after controlled around-the-clock oral THC administration. Clinical Chemistry. 2010;56:1261–1269. doi: 10.1373/clinchem.2009.141853. [DOI] [PMC free article] [PubMed] [Google Scholar]
- 12.Ohlsson A., Lindgren J.E., Wahlen A., Agurell S., Hollister L.E., Gillespie H.K. Plasma delta-9-tetrahydrocannabinol concentrations and clinical effects after oral and intravenous administration and smoking. Clinical Pharmacology & Therapeutics. 1980;28:409–416. doi: 10.1038/clpt.1980.181. [DOI] [PubMed] [Google Scholar]
- 13.Ramaekers J.G., Moeller M.R., van Ruitenbeek P., Theunissen E.L., Schneider E., Kauert G.F. Cognition and motor control as a function of Delta9-THC concentration in serum and oral fluid: Limits of impairment. Drug and Alcohol Dependence. 2006;85:114–122. doi: 10.1016/j.drugalcdep.2006.03.015. [DOI] [PubMed] [Google Scholar]
- 14.Schwilke E.W., Schwope D.M., Karschner E.L., Lowe R.H., Darwin W.D., Kelly D.L., et al. Delta9-tetrahydrocannabinol (THC), 11-hydroxy-THC, and 11-nor-9-carboxy-THC plasma pharmacokinetics during and after continuous high-dose oral THC. Clinical Chemistry. 2009;55:2180–2189. doi: 10.1373/clinchem.2008.122119. [DOI] [PMC free article] [PubMed] [Google Scholar]
- 15.Schwope D.M., Karschner K.L., Gorelick D.A., Huestis M.A. Identification of recent cannabis use: Whole blood and plasma free and glucuronidated cannabinoid pharmacokinetics following controlled smoked cannabis administration. Clinical Chemistry. 2011;57:1406–1414. doi: 10.1373/clinchem.2011.171777. [DOI] [PMC free article] [PubMed] [Google Scholar]
- 16.Hunault C.C., Mensinga T.T., de Vries I., Kelholt-Dijkman H.H., Hoek J., Kruidenier M., et al. Delta-9-tetrahydrocannabinol (THC) serum concentrations and pharmacological effects in males after smoking a combination of tobacco and cannabis containing up to 69 mg THC. Psychopharmacology (Berl) 2008;201:171–181. doi: 10.1007/s00213-008-1260-2. [DOI] [PubMed] [Google Scholar]
- 17.Chait L.D., Zacny J.P. Reinforcing and subjective effects of oral delta-9-THC and smoked marijuana in humans. Psychopharmacology (Berl) 1992;107:255–262. doi: 10.1007/BF02245145. [DOI] [PubMed] [Google Scholar]
- 18.Curran H.V., Brignell C., Fletcher S., Middleton P., Henry J. Cognitive and subjective dose-response effects of acute oral Delta-9-tetrahydrocannabinol (THC) in infrequent cannabis users. Psychopharmacology (Berl) 2002;164:61–70. doi: 10.1007/s00213-002-1169-0. [DOI] [PubMed] [Google Scholar]
- 19.Hall W., Solowij N. Adverse effects of cannabis. Lancet. 1998;352:1611–1616. doi: 10.1016/S0140-6736(98)05021-1. [DOI] [PubMed] [Google Scholar]
- 20.Hart C.L., van Gorp W., Haney M., Foltin R.W., Fischman M.W. Effects of acute smoked marijuana on complex cognitive performance. Neuropsychopharmacology. 2001;25:757–765. doi: 10.1016/S0893-133X(01)00273-1. [DOI] [PubMed] [Google Scholar]
- 21.Heishman S.J., Stitzer M.L., Bigelow G.E. Alcohol and marijuana: Comparative dose effect profiles in humans. Pharmacololgy Biochemisty and Behavior. 1988;31:1–8. doi: 10.1016/0091-3057(88)90244-4. [DOI] [PubMed] [Google Scholar]
- 22.Lamers C.T., Ramaekers J.G. Visual search and urban city driving under the influence of marijuana and alcohol. Human Psychopharmacology. 2001;16:393–401. doi: 10.1002/hup.307. [DOI] [PubMed] [Google Scholar]
- 23.Leweke M., Kampmann C., Radwan M., Dietrich D.E., Johannes S., Emrich H.M., et al. The effects of tetrahydrocannabinol on the recognition of emotionally charged words: An analysis using event-related brain potentials. Neuropsychobiology. 1998;37:104–111. doi: 10.1159/000026487. [DOI] [PubMed] [Google Scholar]
- 24.Ramaekers J.G., Berghaus G., van Laar M., Drummer O.H. Dose related risk of motor vehicle crashes after cannabis use. Drug and Alcohol Dependence. 2004;73:109–119. doi: 10.1016/j.drugalcdep.2003.10.008. [DOI] [PubMed] [Google Scholar]
- 25.Ramaekers J.G., Kauert G., van Ruitenbeek P., Theunissen E.L., Schneider E., Moeller M.R. High-potency marijuana impairs executive function and inhibitory motor control. Neuropsychopharmacology. 2006;31:2296–2303. doi: 10.1038/sj.npp.1301068. [DOI] [PubMed] [Google Scholar]
- 26.Hunault C.C., Mensinga T.T., Bocker K.B., Schipper C.M., Kruidenier M., Leenders M.E., et al. Cognitive and psychomotor effects in males after smoking a combination of tobacco and cannabis containing up to 69 mg delta-9-tetrahydrocannabinol (THC) Psychopharmacology (Berl) 2009;204:85–94. doi: 10.1007/s00213-008-1440-0. [DOI] [PubMed] [Google Scholar]
- 27.Papafotiou K., Carter J.D., Stough C. The relationship between performance on the standardised field sobriety tests, driving performance and the level of delta-9-tetrahydrocannabinol (THC) in blood. Forensic Science International. 2005;155:172–178. doi: 10.1016/j.forsciint.2004.11.009. [DOI] [PubMed] [Google Scholar]
- 28.Ramaekers J.G., Kauert G., Theunissen E.L., Toennes S.W., Moeller M.R. Neurocognitive performance during acute THC intoxication in heavy and occasional cannabis users. Journal of Psychopharmacology. 2009;23:266–277. doi: 10.1177/0269881108092393. [DOI] [PubMed] [Google Scholar]
- 29.Daldrup T., Meininger I. Begutachtung der Fahrtuchtigkeit unter Cannabis im Strafverfahren. In: Berghaus G., Kruger H.P., editors. Cannabis im Strassenverkehr. Stuttgart, Germany: Gustav Fischer Verlag; 1998. pp. 181–204. [Google Scholar]
- 30.Menetrey A., Augsburger M., Favrat B., Pin M.A., Rothuizen L.E., Appenzeller M., et al. Assessment of driving capability through the use of clinical and psychomotor tests in relation to blood cannabinoids levels following oral administration of 20 mg dronabinol or of a cannabis decoction made with 20 or 60 mg delta9-THC. Journal of Analytical Toxicology. 2005;29:327–338. doi: 10.1093/jat/29.5.327. [DOI] [PubMed] [Google Scholar]
- 31.Schwope D.M., Scheidweiler K.B., Huestis M.A. Direct quantification of cannabinoids and cannabinoid glucuronides in whole blood by liquid chromatography–tandem mass spectrometry. Analytical and Bioanalytical Chemistry. 2011;401:1273–1283. doi: 10.1007/s00216-011-5197-7. [DOI] [PMC free article] [PubMed] [Google Scholar]
- 32.Jex H.R., McDonnell J.D., Phatak A.V. IEEE Transactions on Human Factors in Electronics HFE-7. New York, NY; 1966. A “critical” tracking task for manual control research; pp. 138–145. [Google Scholar]
- 33.Moskowitz H. Laboratory studies of the effects of alcohol on some variables related to driving. Journal of Safety Research. 1973;5:185–199. [Google Scholar]
- 34.Galeazzi R.L., Benet L.Z., Sheiner L.B. Relationship between the pharmacokinetics and pharmacodynamics of procainamide. Clinical Pharmacology & Therapeutics. 1976;20:278–289. doi: 10.1002/cpt1976203278. [DOI] [PubMed] [Google Scholar]
- 35.Mehmedic Z., Chandra S., Slade D., Denham H., Foster S., Patel A.S., et al. Potency rends of Δ9-THC and other cannabinoids in confiscated cannabis preparations from 1993 to 2008. Journal of Forensic Sciences. 2010;55:1209–1217. doi: 10.1111/j.1556-4029.2010.01441.x. [DOI] [PubMed] [Google Scholar]
- 36.Cocchetto D.M., Owens S.M., Perez-Reyes M., Di Guiseppi S., Miller L.L. Relationship between plasma delta-9-tetrahydrocannabinol concentration and pharmacologic effects in man. Psychopharmacology (Berl) 1981;75:158–164. doi: 10.1007/BF00432179. [DOI] [PubMed] [Google Scholar]
- 37.Barnett G., Chiang C.W., Perez-Reyes M., Ownes S.M. Kinetic study of smoking marijuana. Journal of Pharmacokinetics and Biopharmaceutics. 1982;10:495–506. doi: 10.1007/BF01059033. [DOI] [PubMed] [Google Scholar]
- 38.Chiang C.W., Barnett G. Marijuana effect and delta-9-tetrahydrocannabinol plasma level. Clinical Pharmacology & Therapeutics. 1984;36:234–238. doi: 10.1038/clpt.1984.168. [DOI] [PubMed] [Google Scholar]
- 39.Cone E.J., Huestis M.A. Relating blood concentrations of tetrahydrocannabinol and metabolites to pharmacologic effects and time of marijuana usage. Therapeutic Drug Monitoring. 1993;15:527–532. doi: 10.1097/00007691-199312000-00013. [DOI] [PubMed] [Google Scholar]
- 40.Bellissant E., Sébille V., Paintaud G. Methodological issues in pharmacokinetic-pharmacodynamic modelling. Clinical Pharmacokinetics. 1998;35:151–166. doi: 10.2165/00003088-199835020-00004. [DOI] [PubMed] [Google Scholar]
- 41.Mareck U., Haenelt N., Geyer H., Guddat S., Kamber M., Brenneisen R., et al. Temporal indication of cannabis use by means of THC glucuronide determination. Drug Test Analysis. 2009;1:505–510. doi: 10.1002/dta.106. [DOI] [PubMed] [Google Scholar]
- 42.Kelly P., Jones R.T. Metabolism of tetrahydrocannabinol in frequent and infrequent marijuana users. Journal of Analytical Toxicology. 1992;16:228–235. doi: 10.1093/jat/16.4.228. [DOI] [PubMed] [Google Scholar]