

Abstract
Introduction:
In 2010, the U.S. Food and Drug Administration (FDA) developed 36 proposed health warnings for cigarette packages, from which 9 were subsequently selected for implementation. The current study aimed to evaluate the perceived efficacy of the 36 proposed FDA warnings.
Methods:
Web-based surveys were conducted with 783 adult smokers and 510 youth in United States. Participants were randomized to view and rate two sets of 6–7 warnings, each set corresponding to one of nine health effect statements required under the Tobacco Control Act. Warnings included all 36 FDA-proposed warnings and additional warnings for comparison.
Results:
Youth and adults rated individual warnings similarly; in all cases where differences were found, youth perceived warnings as more effective. Comparisons on specific elements indicated that warnings were perceived as more effective if they were: full color (vs. black and white), featured real people (vs. comic book style), contained graphic images (vs. nongraphic), and included a telephone “quitline” number or personal information. Few sociodemographic differences were observed in overall perceived effectiveness: younger respondents, non-White respondents, and smokers intending to quit rated warnings higher.
Conclusions:
Seven of the nine health warnings selected by the FDA for implementation were among the proposed warnings rated as most effective in the current study. However, the warning(s) added for comparison were rated higher than the FDA-selected warning for five of the nine sets, suggesting some warnings could be improved for greater impact. The findings support the inclusion of a telephone “quitline” number and reinforce the importance of depicting “real” people and health effects.
Introduction
Tobacco use is responsible for one in ten global deaths and is the second major cause of mortality in the world (World Health Organization, 2008). In the United States, more than 400,000 people die every year from tobacco use (Centers for Disease Control and Prevention [CDC], 2008). Despite this, more than 45 million Americans continue to smoke (CDC, 2010).
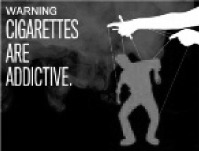
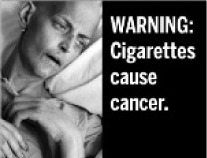
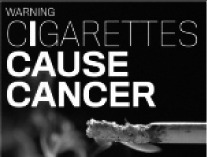
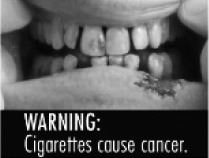
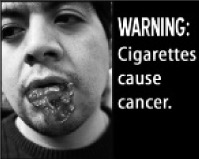
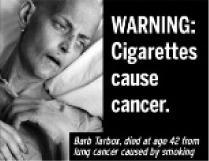
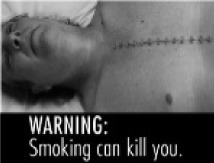
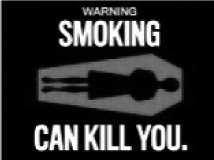
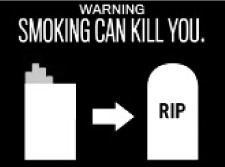
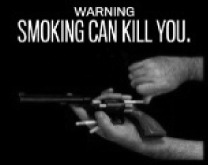
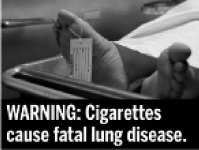
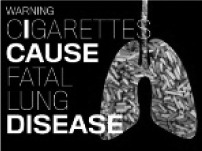
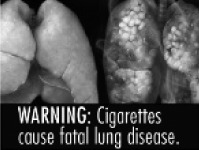
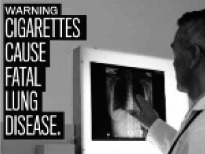
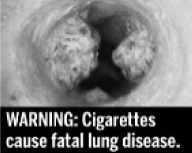
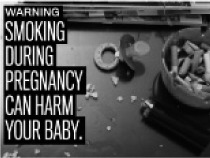
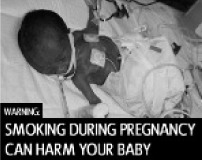
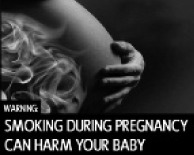
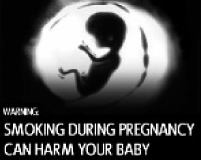
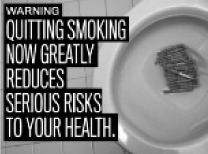
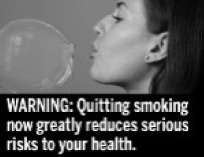
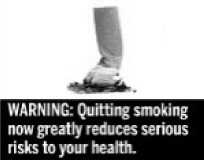
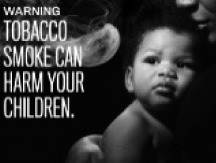
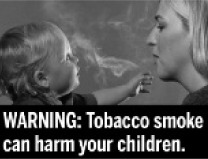
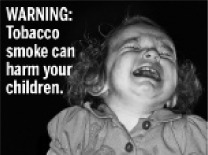
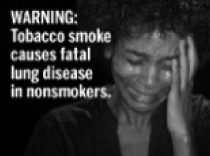
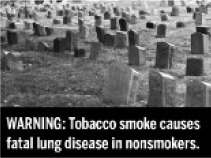
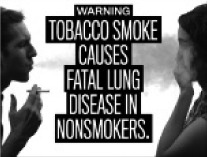
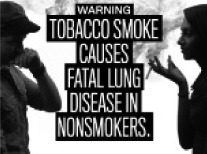
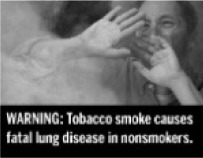
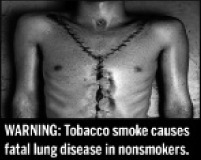
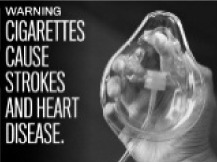
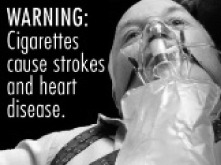
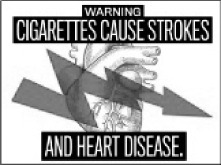
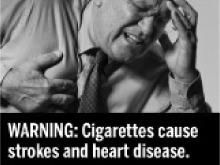
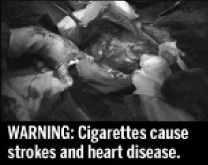
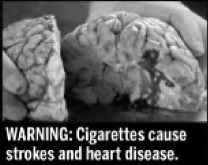
The introduction of the Family Smoking Prevention and Tobacco Control Act in 2009 represents an important landmark for tobacco control in United States. The Act granted the Food and Drug Administration (FDA) authority to regulate tobacco products and signaled a new era of federal-level tobacco control policy (Deyton, Sharfstein, & Hamburg, 2010). New pictorial health warnings for tobacco packages were among the first regulations to be announced under the Act. Cigarette packages will be required to display one of nine color graphic (i.e., pictorial) warnings on the top 50% of the “front” and “back” of cigarette packages—see Figure 1. The warnings were originally scheduled to be implemented by September 2012, although legal challenges from tobacco companies have delayed this timeline. The new warnings represent a significant change from the current warnings, implemented in 1984, which consist of four text-only messages displayed on the side of packs.
Figure 1.

Proposed pictorial health warnings on cigarette packs in the United States.
To date, more than 45 countries have implemented pictorial health warnings similar to the proposed U.S. warnings (Hammond, 2009). Research suggests that large pictorial warnings on cigarette packs have broad reach among smokers and nonsmokers, can increase perceptions of risk, and may discourage youth from smoking (Hammond, 2011). Comprehensive warnings may also promote smoking cessation and help recent quitters to maintain abstinence (Hammond, 2011).
Previous research indicates that the pictorial component of health warnings is the most important determinant of the general salience and impact of health warnings (Decima Research, 2009; Hammond, 2011). For example, qualitative testing in Australia (Elliott & Shanahan [E&S] Research, 2003), New Zealand (BRC Marketing & Social Research, 2004), and Canada (Decima Research, 2009; Les Etudes de Marche Createc, 2006) indicates that the images, rather than the text message, are primarily responsible for eliciting emotional reactions and positive evaluations of health warnings. These qualitative findings are supported by experimental research, including a U.S. study that found that pictorial warnings were associated with greater negative emotions, and that these emotions were associated with more negative attitudes toward smoking (Peters et al., 2007).
In 2010, the FDA engaged an advertising firm to develop content for the proposed warnings. A total 36 warnings were developed (U.S. Department of Health and Human Services [USDHHS], 2010), from which the “final” set of nine warnings was selected following a consultation period (USDHHS, 2011). The primary objective of the current study was to evaluate the efficacy of the 36 proposed FDA warnings for each of the nine “statements” or health effects specified in the Act. Specific aims included testing the impact of color (vs. black and white images), the use of comic book style (vs. “real” people), the use of graphic images, the inclusion of a 1–800 “quitline” number, and the inclusion of personal “testimonial” information. The study also compared the proposed U.S. health warnings with an “international” set of health warnings developed in other jurisdictions.
Methods
Sample and Recruitment
Data were collected using a web-based survey of U.S. respondents conducted in December 2010. Respondents were recruited via email from a consumer panel through Global Market Insite, Inc. (GMI). Additional information on the GMI panel is available online (http://www.gmi-mr.com). Respondents included adult smokers (19 years or older and smoked at least one cigarette in the last month) and youth (aged 16–18, including both smokers and nonsmokers). All respondents provided ethical consent. For youth under 18, parental consent was provided. Respondents were compensated with points from the survey firm (equivalent to ∼$3 USD) in appreciation of their participation. The study was reviewed by and received ethics clearance from the Office of Research Ethics at the University of Waterloo. A complete description of the study protocol is available at http://www.tobaccolabels.ca/study/countries/usa/.
Health Warning Labels
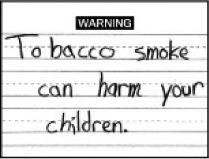
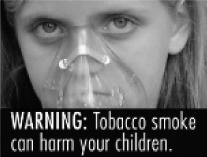
Nine “sets” of health warnings were tested, one for each of the nine statements required under the Tobacco Control Act. Each set included a total of six or seven warnings: each of the “proposed” FDA warnings and at least one additional warning for comparative purposes. The additional warnings used the same text as the FDA-proposed warnings, but with a different image. The images were either variations of the proposed FDA warnings designed specifically for the current study (e.g., black and white versions, or adding a quitline number) or were drawn from “international” health warnings implemented in another country or developed for other research. The number of additional warnings was determined by how many warnings were proposed by the FDA for that topic, bringing the total number to six (with the exception of one set, where the FDA proposed six; this set had one additional warning, bringing the total to seven). Table 2 shows the health warnings tested in the study: a total of 36 FDA warnings and 19 additional warnings.
Table 2.
Mean Effectiveness Index Ratings and Rankings of Health Warning Messages
| Addiction (n = 341) |
 FDA, G
|
 FDA
FDA
|
 FDA
FDA
|
 FDA, CS
|
 R
R
|

|
||
| Adult (n = 198) | Overall effectiveness | 7.4a | 3.7b | 3.6b | 5.1cd | 5.5c | 4.9d | |
| % ranked “most effective” | 79.7 | 2.2 | 5.5 | 1.1 | 4.8 | 8.1 | ||
| Youth (n = 143) | Overall effectiveness | 7.8a | 4.6b | 4.3b | 5.3c | 5.8c | 5.3c | |
| % ranked “most effective” | 87.1 | 2.2 | 0.7 | 1.4 | 2.9 | 5.8 | ||
| Cancer (n = 180) |
 FDA, G
|
 FDA
FDA
|
 FDA, G
|
 FDA
FDA
|
|
 P
P
|
||
| Adult (n = 70) | Overall effectiveness | 6.6ab | 4.8c | 7.4d | 4.8c | 7.4d | 7.1bd | |
| % ranked “most effective” | 5.9 | 5.9 | 14.7 | 1.5 | 42.6 | 30.4 | ||
| Youth (n = 110) | Overall effectiveness | 7.3a | 4.9b | 7.9c | 5.3b | 8.3c | 7.7ac | |
| % ranked “most effective” | 1.9 | 1.0 | 25.7 | 1.9 | 38.9 | 33.0 | ||
| Death (n = 257) |
 FDA, G
|
 FDA
FDA
|
 FDA, G
|
 FDA
FDA
|
|

|
||
| Adult (n = 154) | Overall effectiveness | 6.6a | 5.1b | 5.9c | 4.8b | 5.0b | 6.0c | |
| % ranked “most effective” | 44.4 | 3.6 | 14.7 | 2.9 | 21.3 | 15.4 | ||
| Youth (n = 103) | Overall effectiveness | 7.2a | 4.9b | 6.3c | 4.7b | 5.9c | 6.2c | |
| % ranked “most effective” | 49.5 | 2.2 | 14.0 | 3.2 | 23.4 | 11.6 | ||
| Lung cancer (n = 170) |
 FDA, G
|
 FDA
FDA
|
 FDA, G
|
 FDA
FDA
|

|
|
||
| Adult (n = 66) | Overall effectiveness | 6.1a | 5.0b | 7.5c | 4.6b | 6.0a | 7.2c | |
| % ranked “most effective” | 7.8 | 0 | 51.5 | 0 | 7.8 | 33.3 | ||
| Youth (n = 104) | Overall effectiveness | 5.8a | 5.0bd | 7.2c | 4.5d | 5.5ab | 7.2c | |
| % ranked “most effective” | 10.2 | 2.0 | 33.3 | 2.0 | 10.1 | 45.0 | ||
| Pregnancy (n = 283) |
 FDA, CS
|
 FDA
FDA
|
 BW
BW
|
 R
R
|
|
|
||
| Adult (n = 198) | Overall effectiveness | 5.3ab | 5.3ab | 5.0a | 6.6c | 5.2ab | 5.6b | |
| % ranked “most effective” | 5.3 | 6.5 | 0.5 | 76.6 | 5.3 | 6.9 | ||
| Youth (n = 85) | Overall effectiveness | 5.3a | 5.3a | 5.3a | 7.4b | 5.7a | 5.8a | |
| % ranked “most effective” | 1.2 | 1.2 | 1.2 | 84.7 | 4.8 | 7.1 | ||
| Quitting (n = 324) |
 FDA
FDA
|
 FDA
FDA
|
 FDA
FDA
|
 BW
BW
|
|
 Q
Q
|
||
| Adult (n = 200) | Overall effectiveness | 4.6ab | 4.6ab | 3.8c | 3.8c | 4.5a | 4.9b | |
| % ranked “most effective” | 4.3 | 20.4 | 3.8 | 3.8 | 23.5 | 45.7 | ||
| Youth (n = 124) | Overall effectiveness | 4.4a | 4.6a | 3.6b | 3.6b | 4.5a | 4.7a | |
| % ranked “most effective” | 2.6 | 21.7 | 4.3 | 2.6 | 16.5 | 53.0 | ||
| SHS—Children (n = 408) |
 FDA
FDA
|
 FDA, R
|
 FDA, CS
|
 FDA
FDA
|
 FDA
FDA
|
 FDA
FDA
|

|
|
| Adult (n = 281) | Overall effectiveness | 5.2a | 5.8b | 5.8b | 4.8c | 4.2d | 5.6b | 5.7b |
| % ranked “most effective” | 7.3 | 25.7 | 29.6 | 7.7 | 1.5 | 17.7 | 13.3 | |
| Youth (n = 127) | Overall effectiveness | 5.5ab | 6.1c | 6.1c | 5.3b | 4.2d | 5.9ac | 6.0ac |
| % ranked “most effective” | 6.7 | 23.5 | 24.4 | 10.1 | 2.5 | 20.5 | 14.2 | |
| SHS—Lung disease (n = 286) |
 FDA
FDA
|
 FDA
FDA
|
 FDA
FDA
|
 FDA
FDA
|
 FDA
FDA
|
|
||
| Adult (n = 193) | Overall effectiveness | 4.8ab | 5.1a | 4.6b | 4.4b | 4.5b | 6.7c | |
| % ranked “most effective” | 5.1 | 6.1 | 2.9 | 2.3 | 4.0 | 81.0 | ||
| Youth (n = 93) | Overall effectiveness | 5.8ab | 6.4a | 5.9ab | 5.8ab | 5.7b | 7.8c | |
| % ranked “most effective” | 3.4 | 10.1 | 7.8 | 3.3 | 1.1 | 75.6 | ||
| Stroke & heart disease (n = 298) |
 FDA
FDA
|
 FDA
FDA
|
 FDA
FDA
|
 FDA
FDA
|
|
|
||
| Adult (n = 187) | Overall effectiveness | 4.7a | 6.0b | 4.8a | 5.3c | 6.6d | 6.4bd | |
| % ranked “most effective” | 2.3 | 16.8 | 6.5 | 7.0 | 48.9 | 21.3 | ||
| Youth (n = 111) | Overall effectiveness | 5.0ab | 6.4c | 4.8a | 5.6b | 7.7d | 7.2d | |
| % ranked “most effective” | 0.9 | 9.1 | 2.8 | 5.5 | 57.8 | 25.2 |
Note . BW = black & white; CS = comic style; FDA = FDA-developed; G = graphic; P = personal information; Q = quitline information; R = “real” comparison. Superscript letters denote significant differences (at p < .05) for all pairwise comparisons within the warning set, using linear mixed effects models with Tukey adjustment for multiple comparisons. Warnings within the same set with the same superscript letter are not significantly different from one another. Bolded scores denote a significant difference (at p < .05) between adults and youth for that particular warning, using t tests, adjusting for multiple comparisons using the Benjamini–Hochberg adjustment.
Health Warning Ratings
After completing questions on sociodemographics and smoking behavior, respondents viewed a series of health warning images. Each respondent was randomly assigned to view warnings from two of nine health effects tested in the study. Due to a technical flaw in the program, the second set of warnings assigned to respondents was not assigned at random from the remaining eight sets. For example, for a respondent randomly assigned to see Set 3 first (all sets received an arbitrary number for the purposes of programing), the second set of warnings was randomly assigned from sets 4 through 9 only, rather than Sets 1, 2, and 4–9. Therefore, the number of participants who viewed each set of warnings not balanced, as indicated in Table 2. Within each set, warnings were presented in random order. Respondents rated each warning while the image appeared on screen. After all warnings within a set were rated one at a time, respondents ranked the warnings within a set on overall effectiveness.
Measures
Sociodemographics and Smoking Status
Demographic variables included age (continuous), sex, race/ethnicity, annual net household income, and education level for adults (Low = high school or less, Medium = technical/trade/community college or some university, and High = university degree or higher). Smoking status was determined based on the item “In the last 30 days, how often did you smoke cigarettes?”, and classified as daily smoker (“Every day”), nondaily smoker (“At least once a week” or “At least once in the last month”), or nonsmoker (“Not at all”; only for youth). All adults had smoked 100 cigarettes in their lifetime. Quit intentions among smokers were assessed by asking “Are you planning to quit smoking cigarettes … within the next month, within the next 6 months, sometime in the future, or are you not planning to quit?”, and recoded as “not planning to quit” or “planning to quit” (any of the first three options).
Health Warning Ratings and Rankings
Respondents rated each health warning using a scale of 1–10 (where 1 = not at all and 10 = extremely) for a series of outcomes (e.g., increase concern about health risks, motivate smokers to quit, prevent youth from smoking, and overall effectiveness). Internal consistency of the four outcome measures was tested on a subset of responses (the first warning labels viewed by participants) and was demonstrated to be very high (Cronbach’s α = .93). Therefore, a single index of warning label effectiveness was created by calculating the mean rating of the four measures. Information on all of the ratings and measures assessed in the study is available at http://www.tobaccolabels.ca/study/countries/usa/. Whereas “ratings” refer to the mean index effectiveness ratings (out of 10), the “ranking” refers to the percentage of respondents who ranked that warning most effective relative to the other warnings in the set.
Analyses
All analyses were conducted using SAS v. 9.2 software (SAS Institute, Inc., Cary, NC). Mean effectiveness ratings were calculated for the 55 individual health warnings tested in the study. Linear mixed effects (LME) models (Laird & Ware, 1982) were used to test all pairwise differences between individual warnings within each of the nine health effect sets (separately for the adult and youth samples), adjusting for multiple comparisons using the Tukey correction. Differences between the adult and youth mean scores for each individual warning were examined using t tests, adjusting for multiple comparisons using the Benjamini–Hochberg adjustment (Benjamini & Hochberg, 1995). LME models were also used to examine difference in ratings of effectiveness for specific comparisons across the health effect sets (noted below). In this study, individuals rated several warnings and these ratings are correlated within individuals. LME models are well suited for the analysis of correlated data (Fitzmaurice, Laird, & Ware, 2004). In LME models, fixed effects represent the average effects of covariates on the entire population, while random intercepts represent how the mean response of any given individual differs from that of the overall population. Thus, random intercepts (fitted in all LME models) adjust for the fact that some individuals will rank all warning labels they are exposed to higher than average, whereas others will rank them lower.
To examine specific elements of warning label content that were of particular interest, five separate LME models were estimated in which index effectiveness scores served as the outcome, using specific subsets of warnings. The first model examined black and white versus full-color warnings, comparing two black-and-white warnings (for quitting and pregnancy) with full-color versions of the same warnings. The second model examined the “comic book style” used in some warnings, by comparing three of these warnings (for addiction, secondhand smoke effects on children, and pregnancy) with versions using similar “real” images. The third model examined the impact of adding quitline information, by comparing the FDA-proposed version of one of the quitting warnings with an additional version that had quitline information added. The fourth model examined the impact of adding personal information (name and personal narrative), by comparing the FDA-proposed version of one of the cancer warnings with an additional version that had personal information added. A fifth model examined graphic content by comparing the seven FDA warnings that included graphic, fear-arousing images (for addiction, cancer [two], death [two], and lung cancer [two]) with the 29 FDA warnings featuring nongraphic images. All models included fixed effect variables that adjusted for age group (adult vs. youth), sex, smoking status (daily smoker, nondaily smoker, nonsmoker), previous warning set seen (no set or which one of the eight other sets), and where applicable, health effect set viewed (where warnings from more than one set were included), and presentation order (i.e., which image in a set was seen first). All models included a random intercept term and the fifth model also included a random slope parameter for the effect of graphic content. As an additional step, to examine potential sociodemographic differences in the specific content comparisons noted above, each of the models was repeated to test two-way interaction terms between each of the specific effects and age group, sex, and smoking status, respectively.
The final set of models examined ratings of effectiveness by sociodemographic variables. LME models were conducted separately for adults and youth due to differences in demographic questions by age group and the inclusion of nonsmokers in the youth sample; the subsample of youth smokers was also analyzed separately. Covariates for the adult models included age, sex, race/ethnicity, income, education level, smoking frequency (daily/nondaily), and quit intentions (any/none). Covariates for the youth analysis included age, sex, race/ethnicity, and smoking status (daily smoker, nondaily smoker, nonsmoker); the smoker subsample dropped smoking status and also included smoking frequency and quit intentions.
Results
Sample
The total sample included 783 adult smokers (19 years and older) and 510 youth aged 16–18 (including both smokers and nonsmokers). Sample demographics and smoking characteristics are presented in Table 1.
Table 1.
Sample Demographics and Smoking Characteristics
| Adults (n = 783) | Youth (n = 510) | |
| % (n) | % (n) | |
| Sex | ||
| Male | 48.5 (380) | 52.4 (267) |
| Female | 51.5 (403) | 47.6 (243) |
| Age (mean) | 47.2 (SD = 12.5) | 16.6 (SD = 0.6) |
| Education level | ||
| Low (high school or less) | 24.9 (195) | |
| Medium (technical/trade/community college or some university) | 44.6 (349) | |
| High (completed university/postgraduate degree) | 30.5 (239) | |
| Grade 9 or lower | 11.8 (60) | |
| Grade 10 | 33.2 (169) | |
| Grade 11 | 36.5 (186) | |
| Grade 12/completed high school or more | 18.4 (94) | |
| Income level (annual net household income) | ||
| Low (<$30,000) | 24.0 (188) | |
| Medium ($30,00059,999) | 38.8 (304) | |
| High (≥$60,000) | 35.0 (274) | |
| Refused | 2.2 (17) | |
| Race/ethnicity | ||
| White | 85.7 (671) | 77.1 (393) |
| Black | 5.6 (44) | 9.2 (47) |
| Hispanic or Latino | 2.0 (16) | 5.5 (28) |
| Asian or Pacific Islander | 2.0 (16) | 4.3 (22) |
| Other/mixed | 4.2 (33) | 3.7 (19) |
| Smoking status/frequency | ||
| Daily smoker | 86.3 (676) | 13.5 (69) |
| Nondaily smoker | 13.7 (107) | 17.3 (88) |
| Nonsmoker | 0 | 69.2 (353) |
| Cigarettes per daya (mean) | 17.7 (SD = 9.9; n = 670) | 11.3 (SD=9.5; n = 67) |
| Cigarettes per weeka (mean) | 19.2 (SD = 20.8; n = 78) | 17.3 (SD = 18.3; n = 59) |
| Cigarettes per montha (mean) | 9.6 (SD = 12.9; n = 24) | 7.7 (SD = 8.8; n = 27) |
| Quit intentionsb | ||
| Within the next month | 10.8 (81) | 20.3 (30) |
| Within the next 6 months | 24.6 (185) | 22.3 (33) |
| Sometime in the future | 38.8 (292) | 35.1 (52) |
| Not planning to quit | 25.8 (194) | 22.3 (33) |
Note. aFor daily/weekly/monthly smokers, respectively.
Among smokers (adults n = 783; youth n = 157).
Ratings of Individual Warnings Within Sets
Table 2 shows the 55 individual health warnings tested in the study across the nine health effects. The mean effectiveness ratings for each warning are shown for youth (smokers and nonsmokers) and adults, along with significant differences between individual warnings within each health effect set and between adults and youth for each of the 55 warnings (Table 2). Adjusting for multiple comparisons, significant differences between adults and youth were observed for 11 of the 55 warnings: in all of these cases, youth rated the warning higher than adults.
Table 2 also presents the percentage of respondents who selected each of the warnings as the most effective in the ranking task, within each warning set. The rating and ranking measures are typically show the same pattern: for all sets, the warning with the greatest proportion of respondents ranking it as “most effective” also had the highest average effectiveness score.
Specific Warning Label Content Comparisons
To examine the effect of full color compared with black and white warnings, two pairs of warnings (for quitting and pregnancy) were included in an LME model, controlling for the presentation order of each pair. As indicated by the statistically significant fixed effect term for full color versus black and white warnings (F(1, 570) = 8.5, p = .004), index scores for full-color warnings were, on average, 0.19 points higher than black and white warnings (adjusted means of 4.60 and 4.40, respectively).
To examine the effect of comic book style compared with real people, three pairs of warnings (for addiction, secondhand smoke effects on children, and pregnancy) were included in an LME model, controlling for the presentation order of each pair. As indicated by the statistically significant fixed effect term for comic book style versus real warnings (F(1, 1242) = 72.5, p < .0001), index scores for comic book style warnings were, on average, 0.74 points lower than real warnings (adjusted means of 5.52 and 6.25, respectively).
A separate LME model compared one pair of warnings (for quitting) where one warning featured the addition of quitline information, controlling for the presentation order. The index scores for the warning featuring quitline information were, on average 0.44 points higher (F(1, 321) = 22.8, p < .0001) than for the same warning without quitline information (adjusted means 4.79 and 4.35, respectively).
Similarly, an LME model compared one pair of warnings (for cancer) where one featured the addition of personal information, controlling for the presentation order. The index scores for the warning featuring personal information were, on average 0.37 points higher (F(1, 173) = 8.6, p = .004) than for the same warning without personal information (adjusted means 7.69 and 7.33, respectively).
Within the subset of FDA warnings (additional warnings excluded), a separate LME model examined the effect of using graphic images in warnings (seven warnings, for addiction, cancer (2), death (2), and lung cancer (2)). The index scores for graphic warnings were, on average, 2.31 points higher (F(1, 823) = 1048.2, p < .0001) than warnings without graphic content (adjusted means of 7.36 and 5.04, respectively). Unlike the models described above, which included pairs of warnings, the majority of individuals in this model rated multiple warning labels of interest, making it possible to include a random slope parameter for the effect of graphic content (in addition to the random intercept parameter included in all models). This random slope parameter was statistically significant (p < .001), indicating substantial variation between individuals in this 2.31-point difference (e.g., some individuals rated graphic warnings much higher, while others rated them lower than nongraphic).
Sociodemographic Differences in Ratings
Interactions with Sociodemographic Variables for Specific Content Comparisons
Interactions were tested between sex, age group, and smoking status for each of the specific content comparisons within each of the five models described above. Specific contrasts were tested for comparisons of interest, and all p values were adjusted for multiple comparisons using the Bonferroni correction. The were no significant interactions with any of the sociodemographic variables for the effect of black and white versus full color, personal information versus none, or comic book style versus real on average effectiveness scores. Smoking status significantly modified the effect of adding quitline information (F(2, 319) = 3.1, p = .046), such that adding quitline information significantly increased the average effectiveness score among both daily smokers (by 0.37 points, adjusted p = .004) and nondaily smokers (by 0.80 points, adjusted p ≤ .0001), but not among nonsmokers. Sex significantly modified the effect of graphic images versus not (F(1, 822) = 4.13, p = .04); although both males and females rated the graphic warnings higher than the nongraphic warnings, this difference was greater among females (graphic warnings rated 2.44 points higher among females vs. 2.18 among males).
Adults
An LME model was conducted with the adult sample to examine whether average index effectiveness score was associated with age, sex, race/ethnicity, education level, income level, smoking frequency (daily/nondaily), and quit intentions (any/none), while adjusting for health effect set. Age was significantly associated with scores (F(1, 502) = 9.8, p = .002), with younger adults rating warnings higher (b = −0.013). Race was also significantly associated (F(1, 738) = 9.7, p = .002), with higher scores among minority race respondents than white respondents (adjusted means 5.89 and 5.24, respectively). Smokers who intended to quit rated the warnings significantly higher (F(1, 738) = 43.9, p < .0001) than those with no quit intentions (adjusted means 6.11 and 5.01, respectively). Sex, income, education, and smoking status were not significantly associated with index rating scores (although education and smoking status approached significance at p = .07).
Youth
Similarly, a separate LME model was conducted with the youth sample to examine whether average index effectiveness score was associated with age, sex, race/ethnicity, and smoking status (daily smoker, nondaily smoker, nonsmoker), while adjusting for health effect set. Race was also significantly associated (F(1, 502) = 9.8, p = .002), with higher scores among minority race respondents than white respondents (adjusted means 6.54 and 5.91, respectively). Sex, age, and smoking status were not significantly associated with index rating scores.
When the subsample of youth smokers was examined in a model including age, sex, race/ethnicity, smoking frequency (daily/nondaily), and quit intentions (any/none), only quit intentions were significantly associated, with smokers who intended to quit rating the warnings significantly higher (F(1, 142) = 14.7, p = .0002) than those with no quit intentions (adjusted means 6.57 and 5.06, respectively).
Discussion
The pictorial health warnings proposed by the FDA will become one of the country's most high profile public health campaigns once implemented. However, the impact of the new health warnings will be determined to a large extent by the individual messages and images displayed in the warnings. The proposed set of images, from which the nine health warnings were drawn, represented a range of themes, including novel approaches such as the use of “comic book style” warnings. Findings from the current study provide an empirical test of the images developed for U.S. cigarette packages, as well as an indication of the extent to which messages may resonate with different subpopulations more than others.
The current study adds to the evidence that more graphic warnings are perceived as more effective. Research has consistently demonstrated that warnings with graphic, fear-arousing content are rated more highly by smokers and nonsmokers (BRC Marketing & Social Research, 2004; Decima Research, 2009; Elliott & Shanahan [E&S] Research, 2003; Hammond, 2011; Les Etudes de Marche Createc, 2006). Population-based survey data also suggest that graphic warnings are most likely to be recalled by smokers after implementation relative to other pictorial themes (Wardle et al., 2010).
The current findings suggest that “comic book style” or “cartoon style” themes should be used with caution. “Cartoon” warnings for addiction and the risks of smoking during pregnancy were rated as significantly less effective than parallel images of “real” people depicting the same message. Presumably, these warnings were intended to reach younger demographics or potentially those with lower educational levels. It is, therefore, notable that both of these groups rated cartoons as less effective. A third “cartoon” warning on the risks of secondhand smoke fared somewhat better, but was no more effective than a similar “real” warning. Although it is possible that cartoon style warnings may be effective for communicating abstract themes or messages that are difficult to depict, the findings suggest that cartoons are likely to be less effective at communicating actual health effects and that warnings featuring “real” images are likely to be more engaging and credible.
Adding personal information in a “testimonial” style, including name, age, and a personal statement increased the perceived effectiveness of the warnings, although only moderately so. This is consistent with previous evidence suggesting that depicting real stories may help to increase credibility and emotional engagement (de Wit, Das, & Vet, 2008; Kreuter et al., 2007). Adding a telephone quitline number and the words “You CAN quit!” also significantly increased perceived effectiveness of the warning. This is consistent with evidence from the United Kingdom, the Netherlands, Australia, and Brazil where including quitline numbers on packages significantly increased their use (Cavalcante, n.d.; Miller, Hill, Quester, & Hiller, 2009; U.K. Department of Health, 2006, 2007; Willemsen, Simons, & Zeeman, 2002; Wilson, Li, Hoek, Edwards, & Peace, 2010). Not surprisingly, full-color images were also rated as more effective than warnings featuring black and white images. This is consistent with previous research on the importance of color in health warnings (Braun, Kline, & Silver, 1995).
Sociodemographic differences in the perceived effectiveness of warnings were observed for age and minority status. Differences between youth and adults were observed for approximately one-quarter of the warnings tested and, in all of these cases, youth rated warnings as significantly more effective than adults. Even among adults, younger respondents gave higher effectiveness ratings. Warnings were also rated as significantly more effective by minority race respondents compared with white respondents, as well as by smokers who intended to quit compared with smokers not intending to quit, among both youth and adults. Sex, income, education, and smoking status were not significantly associated with index rating scores. These findings suggest that the health warnings proposed by the FDA may not exhibit the differential effects across socioeconomic groups typically found for many health interventions, in which more disadvantaged groups and younger age groups are less responsive. Indeed, the findings are consistent with other studies of health warnings, which suggest that the most effective ratings perform equally well among subgroups and typically outperform even those messages targeted at a particular target audience (Hammond, 2011).
Strengths and Limitations
The current study did not use probability-based sampling techniques to select a representative sample of adults and youth from United States As a result, the study sample is likely to be more educated and have a higher socioeconomic profile than the general population. The sample was intended to provide a reasonably heterogeneous cross-section for random allocation to experimental conditions. There was a technical issue in the program that resulted in the second set of warnings assigned not completely at random, and consequently the number of respondents viewing each set was unbalanced. In spite of this, there were no systematic differences in the characteristics of respondents across the eight warning sets that were viewed first, and the set viewed first was controlled for in all analyses. In addition, the study setting in which participants rated a series of warnings after viewing the warnings for a brief amount of time does not replicate the repeated exposures of health warnings in “real life.” Although stimuli in this study were shown to participants on a computer screen, the results found here are generally consistent with another study that used a similar methodology but showed people mock packs with warnings (Thrasher et al., 2012). However, there is no way to replicate “real-world” exposure to health warnings in an experimental study, and the current study uses the conventional methodology for evaluating media campaign concepts and materials prior to implementation.
Conclusions and Implications
The nine warnings selected for implementation by the FDA include many of those that were rated most effective out of the 36 warnings developed. The final set also includes the quitline number on all nine warnings, suggesting that their effectiveness will be increased. However, the current findings also demonstrate that some warnings could be improved for greater impact.
Future research should include “post-implementation” studies capable of examining the relative impact of the nine selected health warnings after their implementation. Such studies should consider measures of health warning recall and changes in beliefs about the health risks of smoking, similar to research conducted in other jurisdictions (Hammond, 2011). Additional research is particularly important given that the health warnings are being challenged by five U.S. tobacco companies, who have received an injunction. The companies have argued that the current health warnings “have not only produced effectively universal awareness of the health risks of smoking, but that most consumers in fact overestimate the seriousness of the health risks associated with smoking.” (RJ Reynolds et al. v. US FDA, 2011, p. 20) The complainants also argue that there is no empirical evidence that the proposed pictorial warnings will have any greater impact than text-only warnings. This underlines the need for additional evidence, including the impact of pictorial warnings on health knowledge and behavior in the “real world.”
Funding
This work was supported by the National Institutes of Health (grant number 1 P01 CA138-389-01), and the U.S. National Cancer Institute (grant number P50 CA111236). Additional support was provided by the Propel Centre for Population Health Impact, a Canadian Institutes of Health Research New Investigator Award (to DH), and a Canadian Cancer Society Research Institute Junior Investigator Award (to DH).
Declaration of Interests
The authors have no conflicts of interest to declare.
Acknowledgments
The International Packaging Study research team also includes: Melanie Wakefield (Cancer Council Victoria), Geoffrey Fong and Mark Zanna (University of Waterloo), and Maansi Bansal-Travers, Ernesto Sebrie, and Michael Cummings (Roswell Park Cancer Institute). Project support was provided by Samantha Daniel, Health Behaviour Laboratory, University of Waterloo and Matt Grey, Propel Centre for Population Health Impact, University of Waterloo.
References
- Benjamini Y, Hochberg Y. Controlling the false discovery rate: A practical and powerful approach to multiple testing. Journal of the Royal Statistical Society. Series B (Statistical Methodology) 1995;57:289–300. [Google Scholar]
- Braun CC, Kline PB, Silver NC. The influence of color on warning label perceptions. International Journal of Industrial Ergonomics. 1995;15:179–187. doi:10.1016/0169-8141(94)00036-3. [Google Scholar]
- BRC Marketing & Social Research. Smoking health warnings Stage 1: The effectiveness of different (pictorial) health warnings in helping people consider their smoking-related behaviour. 2004. Prepared for the New Zealand Ministry of Health. [Google Scholar]
- Cavalcante TM. Labelling and packaging in Brazil. National Cancer Institute, Health Ministry of Brazil,. World Health Organization; n.d.. Retrieved from http://www.who.int/tobacco/training/success_stories/en/best_practices_brazil_labelling.pdf. [Google Scholar]
- Centers for Disease Control and Prevention. Smoking-attributable mortality, years of potential life lost, and productivity losses—United States, 2000-2004. Morbidity & Mortality Weekly Report. 2008;57:1226–1228. [PubMed] [Google Scholar]
- Centers for Disease Control and Prevention. Vital signs: Current cigarette smoking among adults aged ≥ 18 years—United States, 2009. Morbidity and Mortality Weekly Report. 2010;59:1135–1140. [PubMed] [Google Scholar]
- de Wit JBF, Das E, Vet R. What works best: Objective statistics or a personal testimonial? An assessment of the persuasive effects of different types of message evidence on risk perception. Health Psychology. 2008;27:110–115. doi: 10.1037/0278-6133.27.1.110. doi:10.1037/0278-6133.27.1.110. [DOI] [PubMed] [Google Scholar]
- Decima Research. Testing of health warning messages and health information messages for tobacco products executive summary. 2009. Prepared for Health Canada. [Google Scholar]
- Deyton L, Sharfstein J, Hamburg M. Tobacco product regulation—A public health approach. New England Journal of Medicine. 2010;362:1753–1756. doi: 10.1056/NEJMp1004152. doi:10.1056/NEJMp1004152. [DOI] [PubMed] [Google Scholar]
- Elliott & Shanahan (E&S) Research. Developmental research for New Australian health warnings on tobacco products Stage 2. 2003. Prepared for the Australian Population Health Division Department of Health and Ageing, Commonwealth of Australia. Retrieved from http://www.health.gov.au/internet/main/publishing.nsf/Content/474DA5DAC70608F2CA2571A1001C7DFE/$File/warnings_stage2.pdf. [Google Scholar]
- Fitzmaurice GM, Laird NM, Ware JH. Applied longitudinal analysis. Hoboken, New Jersey: John Wiley & Sons; 2004. Chapter 8: Linear mixed effects models; pp. 187–235. [Google Scholar]
- Hammond D. Tobacco labelling and packaging toolkit: A guide to implementing FCTC Article 11. 2009. Retrieved from http://www.tobaccolabels.ca/toolkit. [Google Scholar]
- Hammond D. Health warning messages on tobacco products: A review. Tobacco Control. 2011;20:327–337. doi: 10.1136/tc.2010.037630. doi:10.1136/tc.2010.037630. [DOI] [PubMed] [Google Scholar]
- Kreuter MW, Green MC, Cappella J, Slater MD, Wise ME, Storey D, et al. Narrative communication in cancer prevention and control: A framework to guide research and application. Annals of Behavioral Medicine. 2007;33:221–235. doi: 10.1007/BF02879904. doi:10.1007/BF02879904. [DOI] [PubMed] [Google Scholar]
- Laird NM, Ware JH. Random-effects models for longitudinal data. Biometrics. 1982;38:963–974. doi:10.2307/2529876. [PubMed] [Google Scholar]
- Les Etudes de Marche Createc. Final report: Qualitative testing of health warnings messages. 2006. Prepared for the Tobacco Control Programme, Health Canada. [Google Scholar]
- Miller CL, Hill DJ, Quester PG, Hiller JE. Impact on the Australian Quitline of new graphic cigarette pack warnings including the Quitline number. Tobacco Control. 2009;18:228–234. doi: 10.1136/tc.2008.028290. doi:10.1136/tc.2008.028290. [DOI] [PMC free article] [PubMed] [Google Scholar]
- Peters E, Romer D, Slovic P, Jamieson KH, Wharfield L, Mertz CK, et al. The impact and acceptability of Canadian-style cigarette warning labels among U.S. smokers and nonsmokers. Nicotine & Tobacco Research. 2007;9:473–481. doi: 10.1080/14622200701239639. doi:10.1080/14622200701239639. [DOI] [PubMed] [Google Scholar]
- R. J. Reynolds Tobacco Company, Lorillard Tobacco Company, Commonwealth Brands Inc., Liggett Group Llc, and Santa Fe Natural Tobacco Company Inc. v. United States Food and Drug Administration. Plaintiffs’ motion for preliminary injunction. [Case 1:11-cv-01482-RJL Document 11]. Civil Action No. 11-01482 (RCL). (U.S. District Court, District of Columbia, 2011) [Google Scholar]
- Thrasher JF, Arillo-Santillán E, Villalobos V, Perez-Hernandez R, Hammond D, Carter J, et al. Can cigarette package warning labels address smoking-related health disparities? Field experiments among Mexican smokers to assess the impact of textual content. 2012 Cancer Causes & Control. doi: 10.1007/s10552-012-9899-8. [Google Scholar]
- U.K. Department of Health. Consultation on the introduction of picture warnings on tobacco packs. 2006. Retrieved from http://www.dh.gov.uk/assetRoot/04/13/54/96/04135496.pdf. [Google Scholar]
- U.K. Department of Health. Consultation on the introduction of picture warnings on tobacco packs: Report on consultation. 2007. Retrieved from http://www.dh.gov.uk/en/Consultations/Responsestoconsultations/DH_077960. [Google Scholar]
- U.S Department of Health and Human Services. Required warnings for cigarette packages and advertisements; Proposed rule. Federal register, 75(218) 2010. pp. 69524–69565. Federal Register Online. Government Printing Office, FR Doc No: 2010-28538. Retrieved from http://www.fda.gov/TobaccoProducts/Labeling/CigaretteProductWarningLabels/ucm2024177.htm. [Google Scholar]
- U.S Department of Health and Human Services. Required Warnings for Cigarette Packages and Advertisements; Final Rule. Federal Register, 76(120) 2011. pp. 36628–36777. Federal Register Online. Government Printing Office, FR Doc No: 2011-15337. Retrieved from http://www.regulations.gov/#!documentDetail;D=FDA-2010-N-0568-0251. [PubMed] [Google Scholar]
- Wardle H, Pickup D, Lee L, Hall J, Pickering K, Grieg K, et al. Evaluating the impact of picture health warnings on cigarette packets: Final Report. National Centre for Social Research; 2010. Retrieved from http://phrc.lshtm.ac.uk/papers/PHRC_A6-08_Final_Report.pdf. [Google Scholar]
- Willemsen MC, Simons C, Zeeman G. Impact of the new EU health warnings on the Dutch quit line. Tobacco Control. 2002;11:382. doi: 10.1136/tc.11.4.381. doi:10.1136/tc.11.4.381. [DOI] [PMC free article] [PubMed] [Google Scholar]
- Wilson N, Li J, Hoek J, Edwards R, Peace J. Long-term benefit of increasing the prominence of a quitline number on cigarette packaging: 3 years of Quitline call data. New Zealand Medical Journal. 2010;123:109–111. doi:10.1093/ntr/ntq092. [PubMed] [Google Scholar]
- World Health Organization. WHO report on the Global Tobacco Epidemic, 2009. Geneva, Switzerland: Author; 2008. Retrieved from http://www.who.int/tobacco/mpower/2009/en. [Google Scholar]