Abstract
Non-invasive brain stimulation is one of very few potential therapies for medically refractory epilepsy. However, its efficacy remains suboptimal and its therapeutic value has not been consistently assessed. This is in part due to the non-optimized spatio-temporal application of stimulation protocols for seizure prevention or arrest, and incomplete knowledge of the neurodynamics of seizure evolution. Through simulations, this study investigated EEG-guided, stochastic interference with aberrantly coordinated neuronal networks, to prevent seizure onset or interrupt a propagating partial seizure, and prevent it from spreading to large areas of the brain. Brain stimulation was modeled as additive white or band-limited noise, and simulations using real EEGs and data generated from a network of integrate-and-fire neuronal ensembles were used to quantify spatio-temporal noise effects. It was shown that additive stochastic signals (noise) may destructively interfere with network dynamics and decrease or abolish synchronization associated with progressively coupled networks. Furthermore, stimulation parameters, particularly amplitude and spatio-temporal application, may be optimized based on patient-specific neurodynamics estimated directly from non-invasive EEGs.
Index Terms: Non-invasive brain stimulation, epilepsy, EEG, noise, destructive interference
I. Introduction
Brain stimulation, including non-invasive transcranial magnetic (TMS) or transcranial direct current stimulation (tDCS), and invasive vagus nerve or deep brain stimulation, has been proposed and/or applied for therapeutic purposes in medically refractory epilepsy [5], [6], [12], [17], [24], [50], [51], [56]. More than 1% of the US population suffers from some form of epilepsy, and almost one third of patients have pharmacologically uncontrollable seizures. Neurostimulation is one of the very few potential therapies, but despite promising results on relatively small patient cohorts, it remains sub-optimal and of limited efficacy. A few clinical studies have shown that repetitive TMS may arrest ongoing seizures [38], [44], [45]. Although optimization of invasive stimulation following implantation is limited to tuning its frequency and intensity, non-invasive stimulation allows both temporal and spatial optimization, since it can target any cortical area underlying the scalp location of application. Thus, spatio-temporal stimulation parameters may be selected based on patient-specific baseline and seizure-related neurodynamics, with the aim to prevent seizure occurrence or arrest ongoing seizures before they spread to large areas of the brain, causing disabling clinical symptoms. Consequently, non-invasive stimulation has the flexibility to be adapted to a patient’s specific seizure characteristics and brain dynamics, via its integration with electrophysiological monitoring, such as scalp EEG.
The lack of optimized stimulation protocols may be due to two predominant factors: 1) the dynamics and heterogeneity of seizure evolution are not well understood, which in turn makes it difficult to identify an optimum stimulation time, frequency, location and neurodynamic target, and 2) the neuromodulatory effects of brain stimulation are not completely characterized, which makes it difficult to identify an optimum protocol that can target specific processes in the epileptic brain, e.g., increased excitability, reduced inhibition, or aberrant network synchronization [33], [39], [56]. A wide range of brain areas and the peripheral nervous system have been targeted for therapeutic stimulation in epilepsy, in both animal and human studies, with variable success. These studies are summarized in [1]. Targeted brain areas include the cerebellum, e.g., [11]–[13], [32], [53], thalamic nuclei, e.g., [18], [37], the basal ganglia [4], [15], [59], the hippocampus [6], [49], [57], and the cortex, targeted both by invasive and non-invasive stimulation, e.g., TMS. A few TMS protocols, particularly low-frequency repetitive TMS, have been applied for therapeutic purposes in epilepsy with mixed results [9], [19], [50]. TMS may also be proconvulsant, e.g. [43], which highlights the need for very careful optimization of its parameters for therapeutic purposes. A few animal and clinical studies have also proposed tDCS for seizure control [30], [34], [54]. Finally, vagal nerve stimulation is also promising [3], [5], [7], [20], [24], [39].
Several studies on non-invasive brain stimulation in epilepsy have targeted a specific mechanism of seizure evolution, e.g, aberrant neuronal excitation. However, with incomplete knowledge of the neuromodulatory effects of different stimulation protocols, it has proved to be very difficult to consistently suppress seizure-related activity. One potential mechanism of stimulation action that remains unexplored is modulation of neuronal noise. Stimulation may increase non-oscillatory, stochastic neural activity, which may in turn destructively interfere with aberrantly synchronized neuronal networks to reduce their coupling strength, and ultimately prevent further synchronization and seizure onset or propagation. In unrelated TMS-EEG studies in healthy adults, we have found that low-frequency single-pulse TMS, i.e., trains of single pulses delivered over primary motor cortex (M1) with an inter-pulse interval of ~10 s, modulates stochastic neural activity in the brain (unpublished). Furthermore, a few previous studies have investigated the effect of TMS as a neuronal noise generator and signal suppressor [25], [26], [46]. Also, in a series of invasive studies, sub-acute and/or high-frequency stimulation has been shown to suppress local epileptogenesis and reduce seizure frequency [40], [56]–[58]. However, to the best of our knowledge, interference of stimulation-induced noise with epileptic activity has not been consistently investigated.
This study investigated the role of responsive (EEG-guided), spatio-temporally specific noise, representing stimulation-induced stochastic activity during seizure evolution, using clinical scalp EEG data and simulations. The effects of additive white or band-limited noise both prior to clinical onset and during early seizure propagation, were assessed. It was hypothesized that non-invasive, possibly sub-threshold stimulation triggered by seizure-specific changes in the EEG, modulates/increases stochastic neural activity, which destructively interferes with seizure-induced aberrant network synchrony to disrupt seizure evolution. A few quantitative studies have shown that control of network synchronization prior to clinical onset may prevent seizure occurrence [22]. In addition, computational studies have investigated the effects of noise on coordinated neural activity and have shown that controlled noise inputs may abolish neuronal oscillations and/or coordinated firing, particularly in single neuron models [8], [23], [36], [41], [42], [62].
II. Methods
Stimulation-induced stochastic activity was modeled as an additive white or band-limited (colored) noise input. Brain dynamics were either measured by scalp EEGs, or simulated by a network of connected nodes, each corresponding to an ensemble of coupled neurons. Seizure-related changes in network coordination were quantified by information theoretic measures, previously shown to be specifically modulated by seizure precursors [48]. Ictal propagation parameters were directly estimated from EEG signals and were used for ‘tuning’ the noise parameters. In all analyses the following model was assumed for measurements yi(t) at electrode i = 1, … 20 (in the 10–20 clinical EEG system):
| (1) |
| (2) |
where τ is the time point(s) at which local and/or global network coordination exceeds a patient-specific threshold of baseline connectivity, possibly reflecting the transition from nonictal to preictal intervals, and is directly estimated from the EEG. νk(t) is the additive noise input that represents the stimulation, and is non-zero only at t = τ. Repeated stimulation may be required for seizure prevention, i.e., there may be multiple τs estimated from the data. k represents the spatial location of the stimulation, discretized by the electrode positions. The noise term εi ~
 (0, σi) represents system noise (assumed to be Gaussian) unrelated to neural activity, e.g., measurement noise. Finally, EEG signals yi(t) encode contributions from multiple sources sj(t) in the brain, with different strengths aj(t) and at different locations in the brain r⃗j. These may be difficult to decouple and were modeled as the aggregate of all sources. In the preictal and ictal intervals, one or more may correspond to epileptic sources.
A. Data
Continuous scalp EEGs were recorded at Beth Israel Deaconess Medical Center, Boston MA, in the Clinical Neurophysiology Laboratory of the Comprehensive Epilepsy Center. These data were part of inpatient studies typically spanning several days. Six patients, age 24–37 years (μ=27.5, σ=4.9 years) with diagnosed focal epilepsy and at least one seizure were included in the study. Table I summarizes patient demographics and data details.
TABLE I.
Patient clinical demographics.
| Patient # | Age (yrs) | Etiology | Seizure focus | # Recording hrs | # Seizures |
|---|---|---|---|---|---|
| 1 | 37 | Cryptogenic | L/R temporal | 248 | >10 |
| 2 | 28 | Head injury | L temporal | 193.5 | 7 |
| 3 | 25 | Cryptogenic | L/R/simult-bilat. temporal | 40 | 4 |
| 4 | 24 | Brain malformation | L temporal | 48 | 1 |
| 5 | 27 | Cryptogenic | R/L temporal | 137.5 | 6 |
| 6 | 24 | Cryptogenic | R/simult-bilat. temporal | 365.5 | 5 |
The data were recorded with a standard international 10–20 EEG system (20 electrodes) and a referential montage (with channel Cz as reference), and were sampled at 500 Hz. Continuous recordings often include intervals where patients are disconnected from the recording system. These intervals were removed from the data prior to the analysis. Power-line noise was attenuated with a stopband filterbank, centered at the 60 Hz harmonics of the noise, in the range 60–250 Hz, with a 1 Hz bandwidth for center frequencies ≤ 150 and a 2 Hz bandwidth for center frequencies > 150 Hz. Third order elliptical filters (20 dB attenuation in the stopband, 0.5 dB ripple in the passband) were used. Signals were filtered in both forward and reverse directions to eliminate potential phase distortions due to the non-linear phase of the IIR filter. Artifacts associated with eye blinking and muscle movement were suppressed using a stopband-type matched filter [47].
1) EEG segment selection
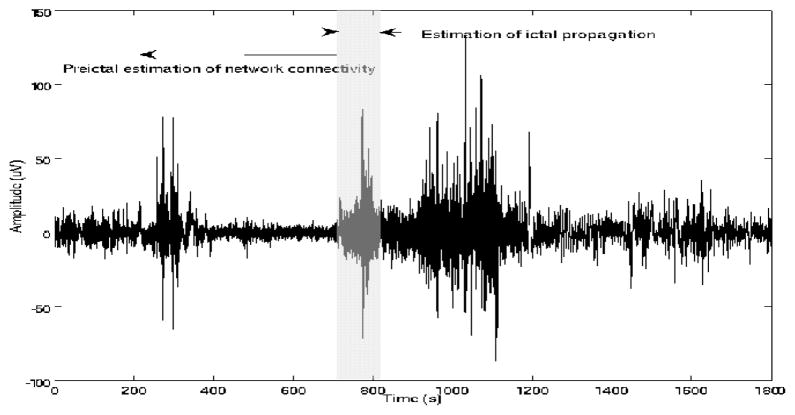
A board-certified neurologist (B.S.C.) identified all ictal onset and offset times, according to standard clinical methods of visual EEG interpretation. For each patient and seizure, multiple ictal and corresponding preictal EEG segments were selected for analysis, ending at clinical onset and starting at the earlier time interval in which information measures of network coordination exceeded the nonictal (baseline) connectivity thresholds (Table II). 2) For estimation of these thresholds, continuous nonictal segments at least 12 hrs removed from any ictal event were analyzed for each patient. These were typically 30–240 min long, and included both periods of wakefulness and sleep. Thus, a range of nonictal connectivity thresholds, rather than a single threshold, was estimated for each patient. Ictal segments were used to identify the primary propagation direction from estimated time delays. The data selection is summarized in Figure 1.
TABLE II.
Nonictal conditional mutual information and interaction information thresholds ([min(t+Tk){mini,j (I(yi(t, t + Tk), yj(t, t + Tk)|cij (t, t + Tk)): ∀i, j, (t, t + Tk))}, max(t+Tk){maxi,j (I(yi(t, t + Tk), yj (t, t + Tk)|cij (t, t + Tk)): ∀i, j, (t, t + Tk))}] over all segments and channels) for each patient. These estimates were obtained from EEGs 30–240 min long, which included periods of wakefulness and/or sleep.
| Patient # | Conditional Mut. Info. | Interaction Info. |
|---|---|---|
| 1 | [0.01, 1.91] | [−0.025,0.125] |
| 2 | [0.04, 2.02] | [−0.05,0.33] |
| 3 | [0.8, 2.14] | [−1.1, 2.29] |
| 4 | [0.14, 3.2] | [−0.05, 1.17] |
| 5 | [0.02, 1.69] | [−0.073, 0.41] |
| 6 | [0.71,1.89] | [−2.31,1.6] |
Fig. 1.
EEG signal segmentation for estimation of 1) preictal network coordination and 2) ictal propagation (from ictal segment (shaded).
B. Estimation of network coordination
Network interactions in the nonictal, preictal and ictal intervals were estimated using two information theoretic measures, conditional mutual information and interaction information. Information theoretic measures of network coordination may be more robust to noise in EEG signals than coherence and correlation measures, particularly at frequencies >100 Hz. In a recent study, both parameters have been shown to be modulated by presumably preictal seizure-related activity at frequencies >100 Hz [48]. Thus, EEGs were separately low-and high-pass filtered with a frequency cutoff at 100 Hz, using a 3rd order elliptical filter, as previously described. Both information measures were first estimated from nonictal EEGs, to establish corresponding connectivity thresholds, and then continuously in preictal intervals, to identify time points (τ in the model in Equation 2) at which network interactions exceeded these thresholds. EEGs were then perturbed at these times. Information parameters were re-calculated to assess the interference of noise with network connectivity.
Conditional mutual information
I(X, Y |Z), measures the reduction in the uncertainty of random variable X due to the knowledge of random variable Y conditioned on a third process Z [14].
| (3) |
where p(·) are joint/conditional probability density functions (pdf). In a previous study, we have shown that at frequencies >100 Hz, quantifiable changes in conditional mutual information between EEGs precede seizure onset [48]. This parameter has also been used to measure directional coupling between other electrophysiological signals [55]. Here, mutual information was conditioned on the global (spatially averaged) EEG cross-correlation, as a measure of global connectivity, i.e., Z = C̄i,j(t+Tk), i, j = 1, …, 20 at time interval (t, t+Tk) with Tk the length of the analysis window.
Interaction information
ΔI, the difference between conditional and unconditioned mutual information was also estimated. It has been shown that in the preictal interval, there is a quantifiable influence of the global connectivity ‘state’ of the brain, measured by the mean cross-correlation between EEGs, on pairwise interactions, measured by mutual information [48].
| (4) |
where is the mutual information between X and Y, and p(·) are marginal or joint pdfs, which are non-stationary given the variable dynamics of the EEG. The reliability of information theoretic measures depends on the estimation of these pdfs. All signals were first segmented according to the criterion of Minimum Description Length (MDL) [10]. The optimum analysis window length Tk was found to be ~5s. Although there are different ways of estimating the above pdfs, non-parametric (here Gaussian kernel-based) are reliable and robust to noise approaches [60], [61].
Nonictal mutual information and conditional information thresholds for each patient are summarized in Table II. Interaction information can take both positive and negative values, reflecting facilitation/enhancement and inhibition, respectively, of pairwise coordination by the conditioning process.
C. Estimation of dominant EEG frequencies
In addition to white noise, the effects of band-limited noise were also investigated. Although stimulation-induced stochastic activity may interfere destructively with seizure-related activity (preictal and/or ictal), another potential mechanism of stimulation-induced neuromodulation is stochastic resonance, a type of constructive interference that may lead to signal enhancement rather than degradation, and which is undesirable for suppression of seizure-related activity. Thus, band-limiting the noise signal, so as to avoid signal enhancement at the dominant frequencies of the EEG, was also examined. For each EEG signal, its dominant frequencies were estimated from the peaks of its short-time Fourier Transform, calculated using a 5s sliding window. Peaks with power levels at least 5 dB higher than noise were selected. In general, ~10–15 dominant EEG frequencies were estimated for each signal. Stopband filterbanks, with bands centered at these frequencies were then constructed, and Gaussian noise was filtered to obtain corresponding colored noise signals.
D. Estimation of seizure propagation from EEG time delays
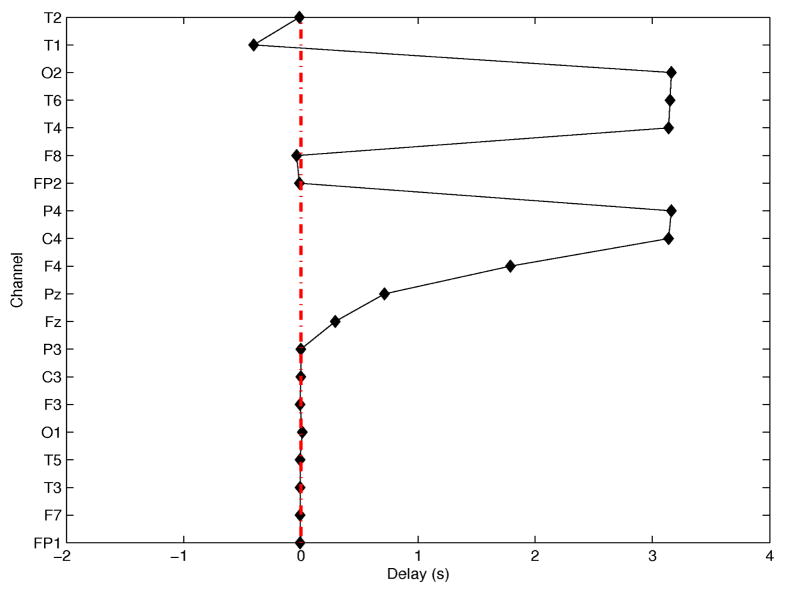
During seizure propagation scalp EEGs are contaminated by coupled arrivals from secondary or unrelated sources, with frequency content in the same range as seizure signals. Thus, these contributions need to be decomposed from the EEG, so that time delays may be estimated from the component associated with the primary propagation path. For stimulation purposes, i.e., not for source localization, an approximate estimate of the primary propagation direction may be sufficient. A simple way to decouple contributions to EEG signals from primary and secondary propagation paths is via Principal Component Analysis (PCA). Although there may not be a one-to-one mapping between the number of propagation paths that contribute to EEG signals and the number of principal components, the first ictal principal component was assumed to correspond to the contribution of the primary propagation path. Following decomposition, ictal ‘events’, i.e., waveforms from which delays were estimated, were identified using a square-law detector [16], [28]. Delays were estimated using the approach in [29]. A detailed description of this process is beyond the scope of this study, but an example of time delays estimated from EEGs in the first 10s of an ictal segment, using channel T3 as reference, is shown in Figure 2. In this example, the seizure is propagating from left temporal regions (possibly in the vicinity of channel T1, based on its earliest arrival and negative delay) to the right hemisphere, particularly channels T4, T6 and C4, F4, based on their large positive delays. In scalp EEG it is sometimes difficult to resolve shorter delays, e.g., here within the left hemisphere. Realistic time delays in the range of those obtained from patient EEGs were used to simulate progressively synchronizing networks.
Fig. 2.
Time delays (in s) as a function of EEG channels, using T3 as the reference channel.
E. Simulations
1) Network of integrate-and-fire (IF) neuronal ensembles
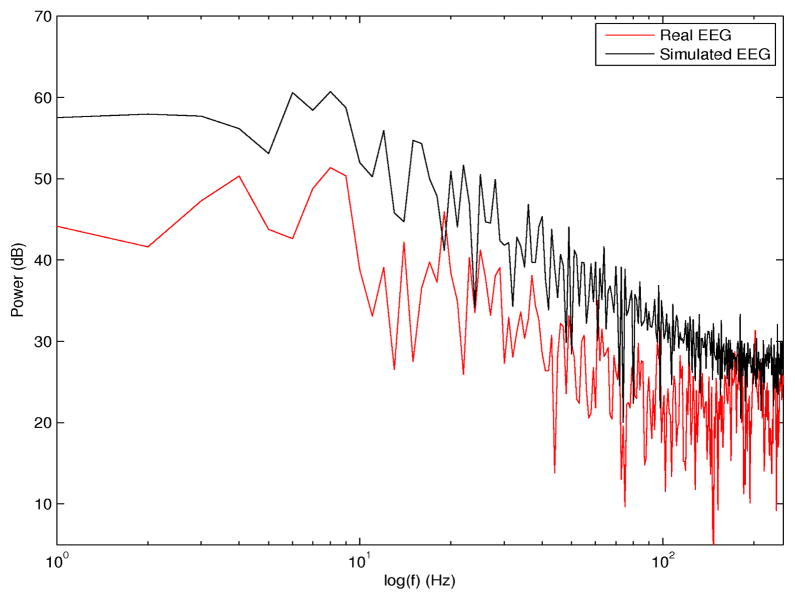
A network of 20 nodes, each corresponding to an ensemble of 5000 leaky IF neurons with noise were simulated to represent the global brain network sampled by scalp EEG. Neurons/ensembles were connected with delayed, i.e., time-varying connections (both excitatory and inhibitory synaptic conductances were included in the model, as described in [52]). Time delays for neurons within individual nodes were in the range 0–20 ms. Time delays between nodes were in the range of estimated time delays between EEG signals at or right before ictal onset, in the range 0–4000 ms. The goal of these simulations was to describe ictal (rather than preictal) neurodynamics. Specifically, to simulate propagated activation in particular directions, the output voltage of one node was converted into current and used as an input (in addition to the synaptic input) to the next node in the direction of propagation. In previous studies it has been shown that networks of I/F neurons (with no leakage) and delayed, connections converge to phase locked oscillations [21]. Representative signals of scalp EEGs were obtained by averaging the voltages of all N=5000 neurons for each node i, i.e., . Although this may not be the optimum model for the epileptic brain during seizure evolution, given the diversity and complexity of seizure dynamics, it is a simple model that partially captures these dynamics and may be used to investigate external network perturbations [35], [52]. Additive noise was introduced at specific time points in the simulation and distinct location(s), to assess the potential noise interference. In the model, the input resistance (Rin) was assumed to be 5 MΩ, the membrane time constant τ=8 ms, and a distinct spiking threshold θ was assumed for each node, with θ ≥ 8 mV. The power spectrum of a simulated EEG signal from this model, as the output of the ensemble of 5000 neurons at a single node, and corresponding spectrum of a real preictal EEG from one scalp electrode are superimposed in Figure 3. There is excellent agreement between the respective distributions of signal energy across frequencies in the two spectra (correlation coefficient ρ=0.86, p <0.00001).
Fig. 3.
Simulated EEG spectrum (black) and superimposed real scalp EEG spectrum (red). Both signals were sampled at 500 Hz.
2) Additive noise to real data
Scalp EEGs were contaminated by white or band-limited noise signals, at discrete time points prior to seizure onset and during the ictal interval. Noise was applied uniformly across channels, to simulate the very rapid propagation of the stimulation signal in the brain. As these were ‘off-line’ simulations on already collected data, it was impossible to assess the effects of stochastic interference on neural dynamics. Only relative effects at the time of perturbation could be measured. However, based on the underlying network connectivity, noise signals with different amplitudes and applied at different times, resulted in differential effects across the network. Although an external perturbation may target non-linear interactions between neuronal ensembles, there is currently no clear consensus on the non-linearity of these interactions prior to seizure onset. Also, it is unknown whether TMS/tDCS stimulation itself may be a linear or non-linear external input, resulting in a linear or non-linear perturbation of neural dynamics. Thus, given the uncertainty associated with these processes, linear addition of noise to real data allows us to assess at least potential first order effects of a stochastic perturbation on network coordination.
III. Results
We investigated the effects of varying i) the noise amplitude proportionally to the maximum EEG amplitude, ii) temporal specificity of the perturbation on network connectivity measured by mutual information parameters, iii) spatial specificity in the direction of the primary seizure propagation path, and iv) band-limiting the noise.
A. Noise perturbations of EEG signals
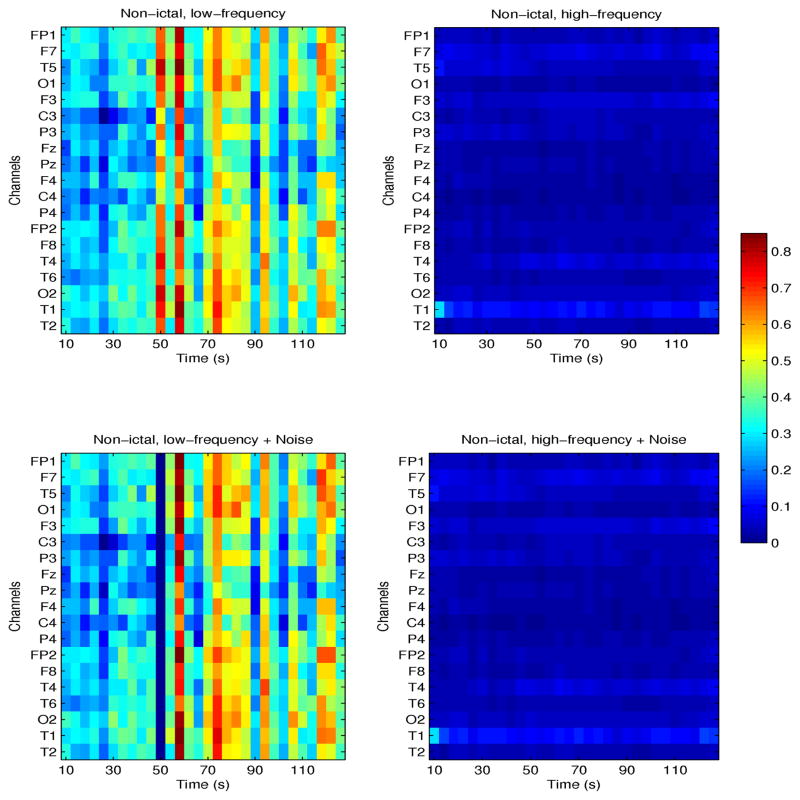
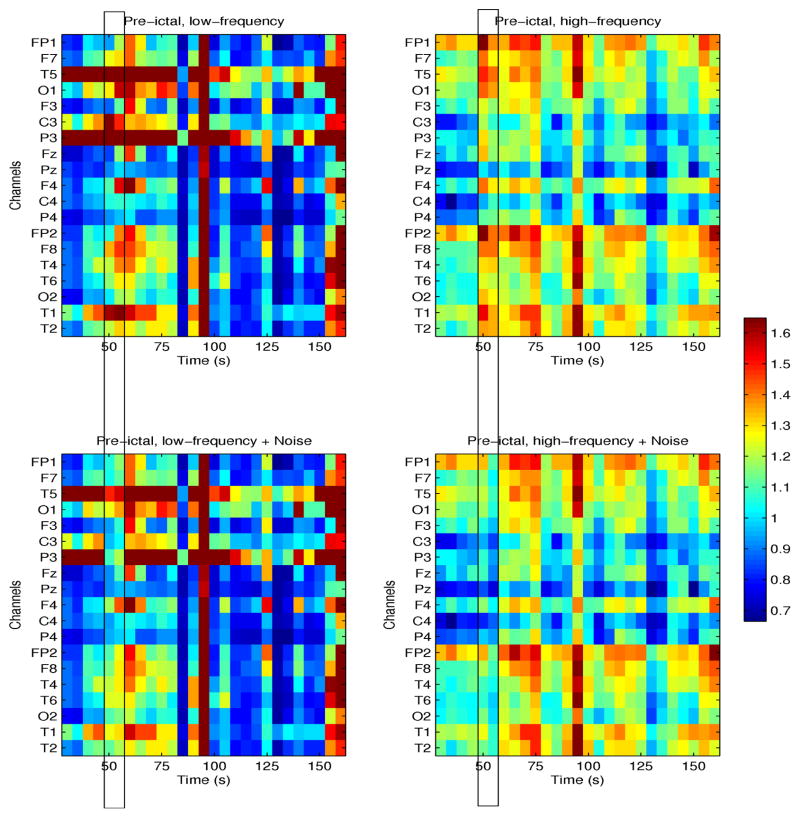
Figures 4 and 5 show the effects of time-specific noise addition on conditional mutual information (CMI) estimated from nonictal and preictal EEG signals, respectively, at frequencies ≤100 Hz (left plots) and >100 Hz (right plots). Both examples are from one patient (patient # 4) with seizures originating in the left temporal lobe. CMI between channel T3 and all others is shown as a function of time, in these segments, 120s and 150s long, respectively. Note that in the nonictal interval, neuronal networks may be weakly coupled, as re-flected by low values of CMI particularly at high frequencies, but may spontaneously and transiently coordinate, typically at frequencies <80 Hz, as shown in Figure 4, at times 50–55s, and 70–80s. Following addition of white noise at time t=50s, with amplitude 10% of the maximum EEG amplitude, CMI decreased from ~0.7 to ~0. This is expected, as noise interference may abolish weak coupling between signals.
Fig. 4.
Nonictal CMI for one patient with seizures originating in the left temporal lobe. CMI between channel T3 and all others, at frequencies ≤100 Hz (left plots) and >100 Hz (right plots) is shown. Corresponding parameters following addition of white noise are shown in the bottom plots.
Fig. 5.
Preictal CMI for one patient with seizures originating in the left temporal lobe. CMI between channel T3 and all other, at frequencies ≤100 Hz (left plots) and >100 Hz (right plots) is shown. Corresponding parameters following noise perturbation at time 50–55s are shown in bottom plots.
In contrast to its nonictal variation, preictal CMI at high frequencies was significantly higher with a distinct spatial structure, i.e., channel clusters (Fp1, F7, T7, F3, 01) and corresponding channels in the right hemisphere appeared to transiently synchronize with T3 but not with central and parietal channels. Similar results were obtained in other patients. At lower frequencies, CMI was higher only between individual channels, e.g., T3 and T5, and also T3 and P3, and bilaterally in frontal/temporal channels in the last 10–15s of the interval, i.e., prior to clinical onset. In this example, noise amplitude was twice that of the EEG, and thus proportionally significantly higher than the amplitude of the nonictal perturbation, resulting in a comparable mean decrease in CMI. Thus higher network synchronization in the preictal interval may require the parameters of the noise to be adjusted accordingly, in order to decouple the network to its baseline level.
1) Variation of noise amplitude
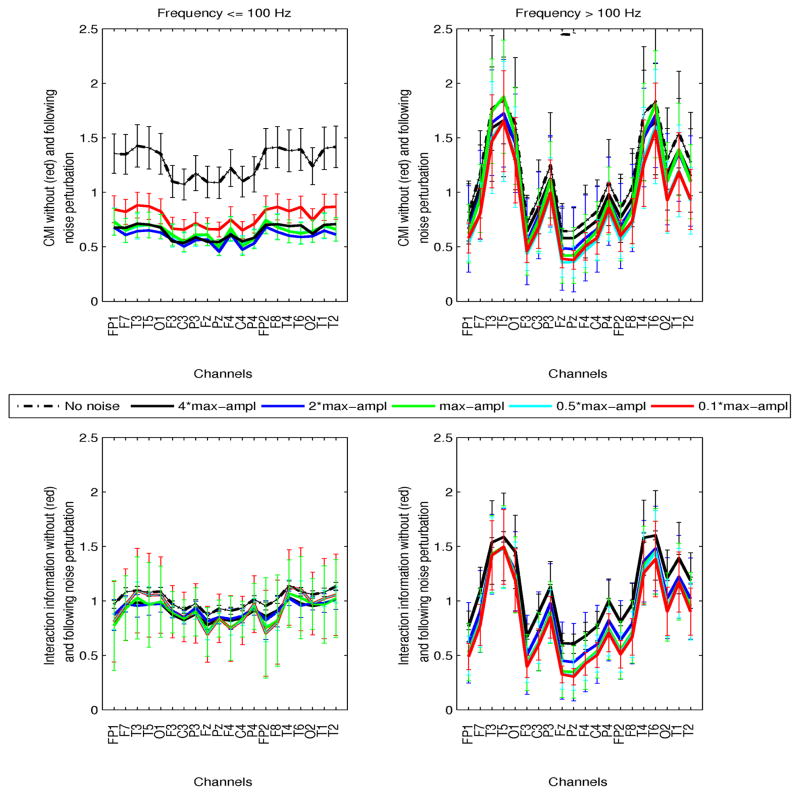
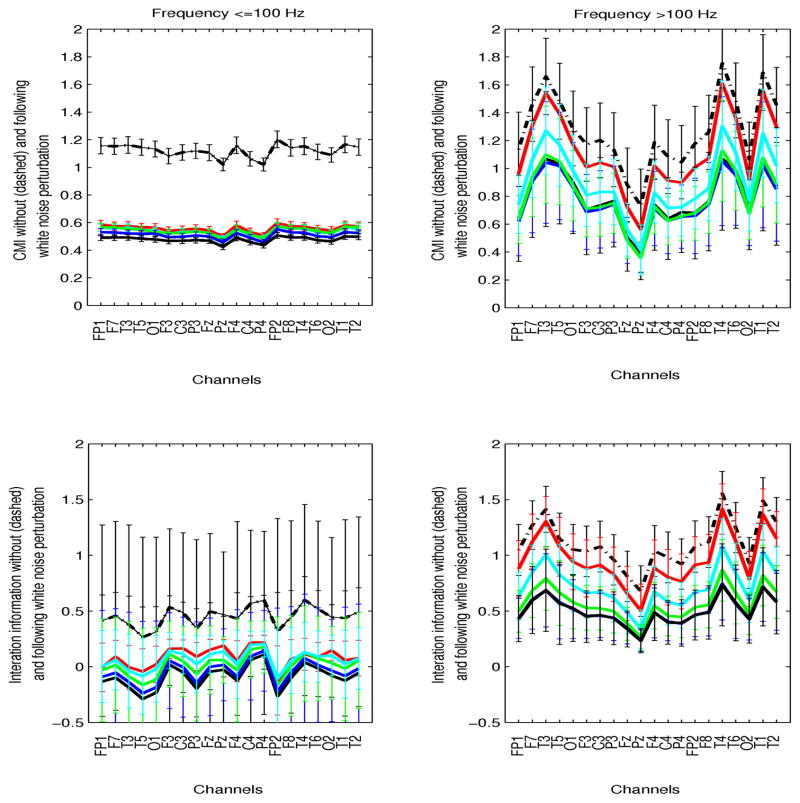
This was investigated both in preictal and ictal intervals. The time of perturbation was selected as the 5s interval at which maximum mean pairwise CMI (averaged over all channels) exceeded the nonictal parameter ranges. Although in preictal intervals this time varied significantly between patients and segments, in ictal segments in was consistently in the first 20–30s of the seizure. Simulations using 5 noise levels, at 10, 50, 100, 200, 400% of the maximum EEG amplitude at the time of interference were performed at both frequency ranges. Figures 6 and 7 show preictal and ictal CMI and interaction information (II), prior to and following noise perturbation as a function of EEG channel, at frequencies ≤100 Hz (left plots) and >100 Hz (right plots). The results from all perturbations are superimposed (red: noise at 10% EEG amplitude, cyan:50%, green:100%, blue:200%, black:400%, and the black dashed curves correspond to the parameter variation prior to noise addition). The inter- and intra-patient variability of these measures at their respective times of perturbation are superimposed to averaged parameters (solid curves). Specifically, for each channel, CMI and II between that channel and all others were averaged, and these results were then averaged a second time over all patients/segments.
Fig. 6.
Preictal conditional mutual information (CMI, top plots) and interaction information (II, bottom plots) as a function of channels, at frequencies ≤100 Hz (left plots) and >100 Hz (right plots) is shown. For each channel, information parameters were averaged over all pairwise values between that channel and all others. Inter-patient variability is superimposed. Values prior to noise perturbation (black dashed line), and following addition of white noise with amplitudes 0.1 (red), 0.5 (cyan), 1 (green), 2 (blue), 4(black) times the maximum amplitude of the signal are superimposed. Noise was added to each signal at the time interval of maximum mean CMI.
Fig. 7.
Mean conditional (CMI, top plots) and interaction (II, bottom plots) ictal information as a function of channels, at frequencies ≤100 Hz (left plots) and >100 Hz (right plots) is shown. Inter-patient variability is superimposed to averaged parameters over patients. Values prior to noise perturbation (black dashed line), and following addition of white noise with amplitudes 10% (red), 50% (cyan), 100% (green), 200% (blue), 400% (black) the amplitude of the EEG are superimposed.
At frequencies ≤100 Hz, preictal CMI decreased significantly following noise addition, but differential changes due to distinct noise levels were statistically insignificant (p > 0.8). At higher frequencies, despite increased CMI relative to its nonictal values, no significant noise perturbation effects were estimated, suggesting potentially complex high frequency network coordinations, which may not be interrupted by linear additive noise. Note that the distribution of CMI across channels appeared spatially specific in this frequency range, with left and right temporal channels being significantly more synchronized than central and parietal (all patients had temporal lobe seizures). High-frequency activity has been associated with both the epileptogenic zone and seizure activity in general, e.g., [2], [27], [31], among many others. Finally, interaction information appeared unaffected by noise addition in both frequency ranges (p ≥ 0.54).
Corresponding ictal information parameters were also estimated. Increased network coordination across the EEG spectrum have been consistently observed in this interval. At low frequencies, CMI decreased significantly following noise addition irrespective of its amplitude. At high frequencies, increasing the noise amplitude resulted in progressively decreased CMI. However, despite significant differences in mean CMI between unperturbed and highly perturbed signals (with noise amplitude 100–400% of the EEG), due to significant inter-patient variability, statistical significance could not be established. Noise-induced changes in interaction information were also insignificant in both frequency ranges across channels, irrespective of propagation path and the noise level. These results indicate that simple noise addition during ictal evolution may be insufficient to disrupt seizure propagation at high frequencies, but effectively affects lower-frequency network interactions. Network simulations using the IF neuronal model were also performed, to assess the effect of noise interference on ongoing seizures.
2) Variation of noise bandwidth
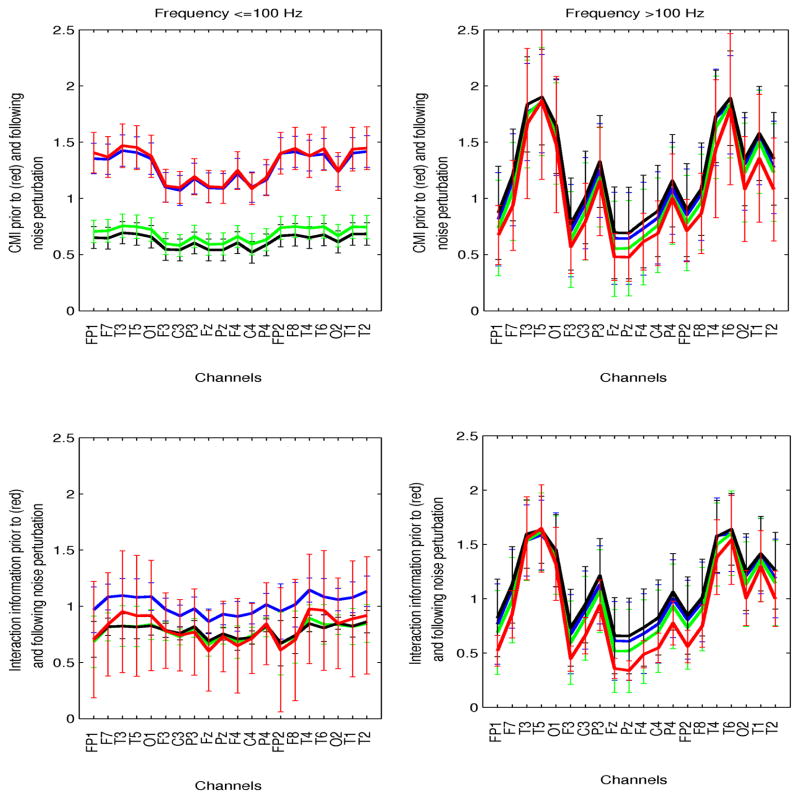
No differential effects on network interactions were estimated when noise was stopband-filtered at the fundamental EEG frequencies, or high-pass filtered at 100 Hz. Statistical significant network perturbations were observed at lower frequencies when noise was low-pass filtered at those frequencies. The results corresponding to preictal signals are summarized in Figure 8. In all cases, the noise amplitude was 400% of the EEG amplitude. Both white and low-passed noise decreased CMI at frequencies ≤100 Hz but not at high frequencies. Perturbations with high-frequency noise resulted in no changes in CMI irrespective of the frequency range.
Fig. 8.
Preictal conditional and interaction information (CMI, II) as a function of the noise bandwidth: white noise (black), bandlimited at frequencies ≤100 Hz (green), bandlimited at >100 (blue). The unperturbed CMI and II are superimposed (red). Parameters are shown in the two frequency ranges (left: ≤100 Hz, right:>100 Hz).
B. Neurodynamic perturbations in network simulations
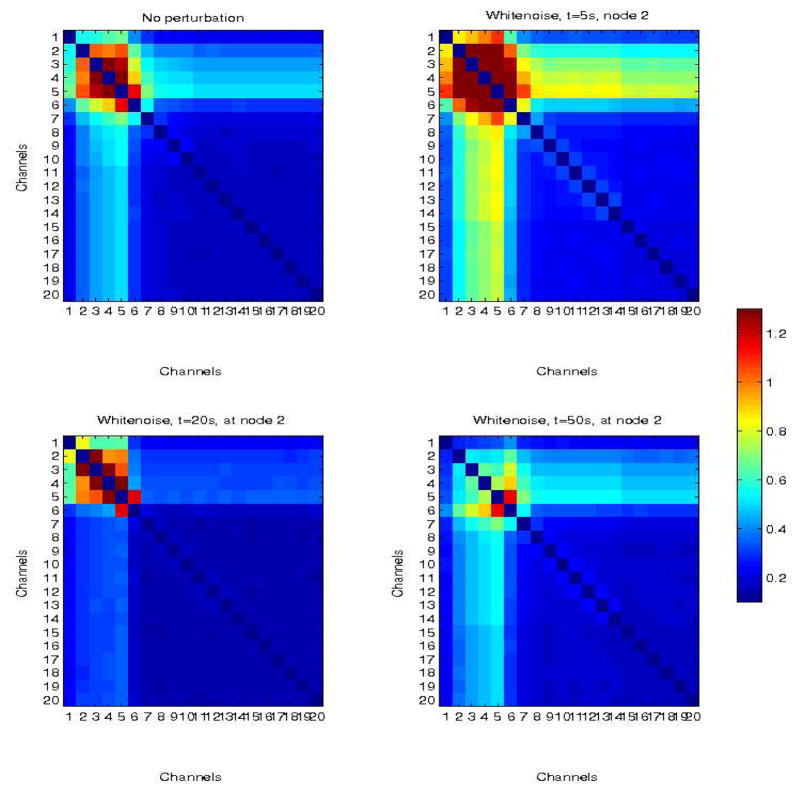
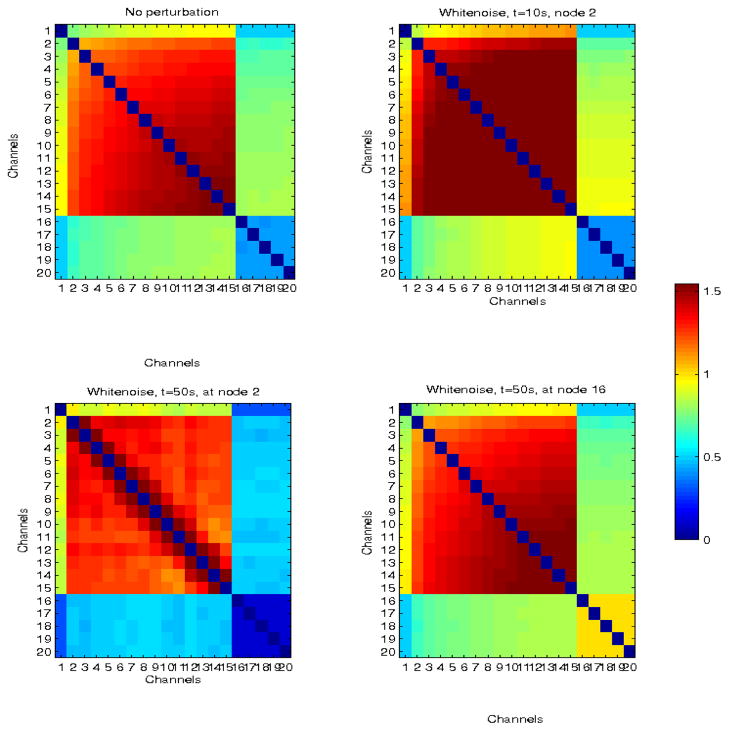
We simulated two ictal propagation scenarios, one in which propagation was limited to a small subnetwork, and the other where propagation spread to a large part of the network. In both cases, CMI was used to quantify inter-node synchronization. The analysis focused on CMI estimates at ≤100 Hz, since measurable effects of additive noise were found in real EEG perturbations in this frequency range. Furthermore, abnormally coordinated networks in the ictal interval at frequencies <100 Hz, induced by seizure propagation, have been reported in many studies. Figures 9 and 10 show two examples of a small (n=5) and a large (n=15) network, perturbed with white noise at different times and nodes. Inter-node CMI, averaged over time is shown. In both cases, network dynamics were simulated for 120 s, and additive noise with the same maximum amplitude (5 nA) and duration (500–1000 ms) was used to perturb the network.
Fig. 9.
Simulated network in which propagation is limited to nodes 1–5 (top left panel). There is also limited propagation in adjacent nodes (6,7) due to connectivity between nodes 5–6 and 6–7, but the remaining nodes are only weakly coupled (the baseline), with CMI≤0.3. Top right panel corresponds to the network response to a white noise perturbation at node 2, at time t=5s from the beginning of the simulation. Bottom left and right panels correspond to perturbations at times t = 20 s and t = 50 s, respectively.
Fig. 10.
Simulated larger network with delayed neural propagation from nodes 1 to 15 (top left panel). The top right panel corresponds to the network response to white noise perturbation at node 2, at time t = 5 s. Bottom left and right panels correspond to perturbations at times t = 50s also at node 2, and at t = 50 s at node 16 (outside the sub-network involved in propagation).
When noise was added to the network at t = 5 s, it enhanced synchronization between connected nodes, an example of constructive interference, possibly due to the timing of the perturbation early in the evolution of network dynamics. The same noise signal was used to perturb the network at 20 s and 50 s, at the same location. Network interactions decreased at 20 s but pairwise CMI between adjacent nodes (2–3, 3–4, 4–5, 5–6) remained high. However, at 50 s, CMI decreased significantly, to the range of baseline values for weakly coupled nodes, (with the exception of node pair 5–6).
Similarly, noise addition to the larger network at t = 10 s increased the rate of network coordination and absolute CMI, whereas interference at 50 s resulted in decreased coordination, with the exception of pairs of adjacent nodes (2–3,3–4, …,15–16). In this particular example, no single perturbation caused the network to return to its baseline of weakly coupled nodes. Furthermore, noise addition at 50 s but at node 16, i.e., outside the sub-network involved in primary propagation, resulted only in a uniform increase of the overall CMI, and thus correlation, in adjacent nodes. Thus, only spatio-temporally specific additive white noise resulted in a destructive interference with propagation-induced network coordination. Band-limiting the noise did not change the results significantly.
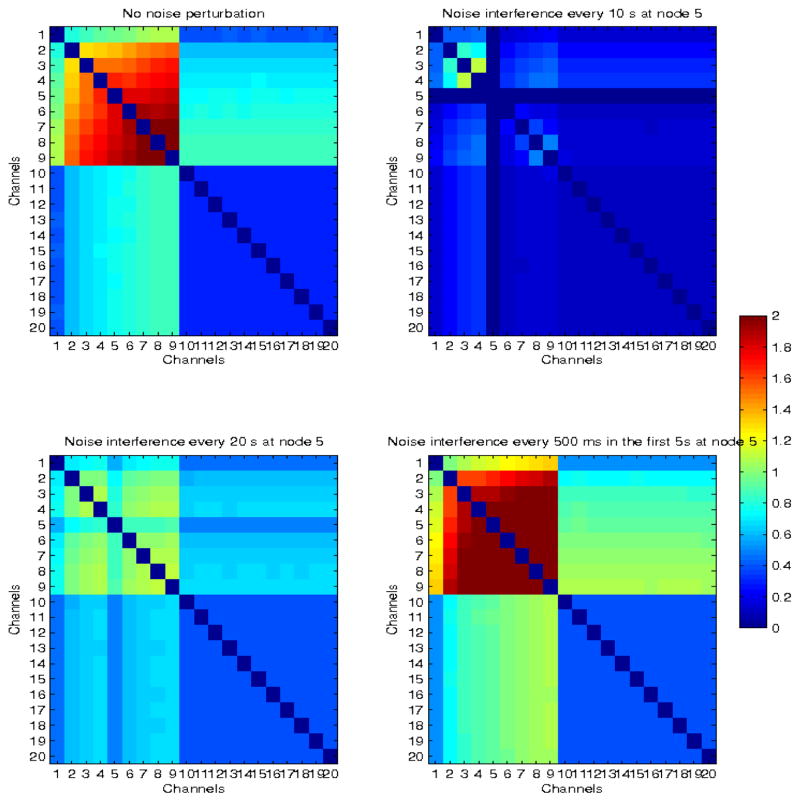
Finally, we also examined the frequency of noise perturbation. Figure 11 shows an example of a network, where propagation is restricted to the first 9 nodes (top left panel), and to which white noise (with the same parameters as before) was added at different frequencies: every 10s at node 5 for the entire duration of the simulation (top right panel), every 20 s (bottom left panel) and every 500 ms in the first 5 s of the simulation (bottom right panel). In the first case, the subnetwork was almost completely decoupled (CMI~0), in the second case propagation appeared to be interrupted and network coordination decreased significantly, but in the last case of high frequency, short-duration early interference, network coupling was enhanced, as in the previous two examples. These results suggest that the time, frequency and location of noise application need to be carefully selected for destructive interfere with network synchronization, rather than facilitation.
Fig. 11.
Simulated network with delayed neural propagation from nodes 1 to 9 (top left panel). The modulated network when white noise was added every 10s in node 5, for the entire duration of the stimulation (top right panel), every 20s in node 5 (bottom left panel), and every 500 ms in the first 5s (bottom right panel), are also shown.
IV. Discussion
We have modeled stochastic interference, one of potentially several effects of brain stimulation, as a noise perturbation to neuronal dynamics. We have used simulations both with real EEG and model-based data to assess the effects of variable amplitude, time, frequency, and location of noise interference on conditional mutual information and interaction information, both measures of network coordination. In the case of real EEG, simulations were performed off-line and thus changes in network interactions could be estimated only at the time of interference. To investigate the on-line effect of noise interference on network dynamics, a network of leaky integrate and fire neuronal ensembles was simulated with time-varying (delayed) connections, to describe neuronal propagation. Although both seizure neurodynamics and the neuromodulatory effects of brain stimulation are not completely understood, and thus it may not be possible to develop optimal models for either, this study used simplified models to i) test the hypothesis of destructive interference of noise with a propagating network, ii) assess the effects of variable noise on network coordination. The results from this study provide important insights into stochastic neuronal interference, a potentially important neuromodulatory mechanism of non-invasive stimulation, which has been previously suggested but remains relatively unexplored.
Noise perturbations of real EEG showed that nonictal networks may be decoupled by introducing low-amplitude noise. Similarly, at frequencies ≤100 Hz, preictal and ictal network coordination at the time of noise application decreased significantly and uniformly across channels. In contrast, perturbation of high-frequency preictal and ictal EEGs resulted in insignificant changes in network coordination, suggesting that linear additive noise may not be an appropriate perturbation to disrupt seizure-induced neural synchrony at high-frequencies. Therefore, additive stimulation-induced stochastic interference may interrupt aberrant neural synchrony at seizure onset or during propagation, but a different stimulation interference is necessary to disrupt preictally coordinated networks, particularly at high frequencies. Band-limiting the noise had no distinct effects on network perturbations from those induced by white noise.
In simulations, noise was introduced to IF subnetworks of different size, to represent partial (limited) propagation vs seizures spreading to large areas of the brain. Irrespective of the size of the network, very early noise interference had a constructive rather than destructive effect, resulting in increasingly synchronized networks. This may be due to noise becoming coupled to local neuronal activity. Stochastic interference at later intervals significantly decreased network coupling, although in larger networks synchronization between pairs of adjacent nodes remained high. Evidently the dynamics of real seizures may be faster than these simulated networks, and thus stimulation in the first few seconds of a seizure may correspond to the partial network evolution observed at ~50s in simulations. Stimulation at nodes outside the subnetwork where propagation occurred had no effect on that network, but only increased local interactions in the neighborhood of the perturbed node. Finally, the frequency of the interference was also investigated. Sustained noise perturbations every 10–25 s resulted in significant decoupling between nodes. In contrast, noise perturbations at 500 ms intervals early in the simulation resulted in increased network coupling.
These results demonstrate that it is possible to optimize stimulation parameters when the targeted mechanism of neuromodulation is stochastic interference rather than decreased/increased excitation/inhibition during seizure propagation, which may be more difficult to trigger. Optimization of these parameters needs to be guided by patient specific neurodynamics measured by non-invasive recordings. EEG-based source localization is limited by the spatial resolution of these recordings (~2–4 cm between adjacent electrodes in the clinical 10–20 EEG system). Consequently the error in source localization and corresponding error in the direction of propagation may be in the range 1–2 cm. Currently, the resolution of non-invasive stimulation such as TMS is also of the same order (~7 mm to several cm), depending on the shape of the magnetic coil. Therefore, current stimulation protocols may not be able to target the source location with greater precision. Nevertheless, the resolution of non-invasive stimulation allows it to target seizure propagation, rather than source localization, with sufficient precision to destructively interfere with rapidly spreading seizure activity in large areas of the brain. Results from this study indicate that the spatio-temporal specificity and frequency of the stimulation, rather than just precise knowledge of the source location, are critical for destructively interfering with aberrant network coordination. Evidently these results need to be validated via experimental studies of EEG-guided stimulation, to assess the effects of non-invasive stimulation, which may not be just uniformly added white noise, and may also be modulated by the presence of the skull and scalp and the electrical/anatomical anisotropy of the brain. Nevertheless, this study provides important insights into the effects of noise on neuronal propagation and coordination, as well an approach for tuning the stimulation parameters according to neurophysiological information.
Acknowledgments
The authors would like to thank Larry Gruber at Beth Israel Deaconess Medical Center, for his help with the EEG data. This work was supported in part by a Harvard Catalyst pilot grant (CS), NIH R01 NS073601 (BC), the Harvard Clinical and Translational Science Center (NIH UL1 RR 025758) and financial contributions from Harvard University and its affiliated academic health care centers. The content is solely the responsibility of the authors.
Biographies

Catherine Stamoulis (M’09) received the SB (1993), SM (1994) and PhD (1997) degrees from the Massachusetts Institute of Technology (MIT), Cambridge MA. She is currently an Assistant Professor of Radiology at Harvard Medical School, and also holds appointments in the Departments of Radiology, Neurology and the Clinical Research Center at Children’s Hospital Boston.
Her current research is in computational neuroscience and biomedical signal and image processing, with applications to neurological disorders and a focus on epilepsy. Her research interests are in the areas of mathematical modeling of neural dynamics and neurostatistics.

Bernard S Chang received the AB (1993) and MMSc (2005) degrees from Harvard University, Cambridge, MA, and MD (1997) degree from New York University, New York, NY. He is currently an Associate Professor of Neurology at Harvard Medical School and is a member of the Comprehensive Epilepsy Center at Beth Israel Deaconess Medical Center in Boston, MA. In his research, he uses imaging, neurophysiological, and brain stimulation techniques to explore the mechanisms of epilepsy and cognitive problems in patients who are born with developmental malformations of the cerebral cortex.
Contributor Information
Catherine Stamoulis, Email: caterina@mit.edu, caterina.stamoulis@childrens.harvard.edu, Departments of Radiology and Neurology and Clinical Research Center, Children’s Hospital Boston and Harvard Medical School, Boston, MA 02115, USA.
Bernard S. Chang, Department of Neurology Beth Israel Deaconess Medical Center and Harvard Medical School, Boston, MA 02215
References
- 1.Al-Otaibi FA, Hamani C, Lozano AM. Neuromodulation in Epilepsy. Neurosurgery. 2011;69:957–979. doi: 10.1227/NEU.0b013e31822b30cd. [DOI] [PubMed] [Google Scholar]
- 2.Andrade-Valenca LP, Dubeau F, Mari F, Zelmann R, Gotman J. Interictal scalp fast oscillations as a marker of the seizure onset zone. Neurology. 2011;77:524–531. doi: 10.1212/WNL.0b013e318228bee2. [DOI] [PMC free article] [PubMed] [Google Scholar]
- 3.Ardesch JJ, Buschman HP, Schimmel LJ. Vagus nerve stimulation for medically refractory epilepsy: a long-term follow up study. Seizure. 2007;16(7):579–585. doi: 10.1016/j.seizure.2007.04.005. [DOI] [PubMed] [Google Scholar]
- 4.Benabid AL, Minotti L, Koudsie A, et al. Anti-epileptic effect of high-frequency stimulation of the subthalamic nucleus (corpus luysi) in a case of medically intractable epilepsy caused by focal dysplasia: a 30-month follow-up: technical case report. Neurosurgery. 2002;50(16):1385–1391. doi: 10.1097/00006123-200206000-00037. [DOI] [PubMed] [Google Scholar]
- 5.Ben-Menachem E, Manon-Espaillat R, Ristanovic R, et al. Vagus nerve stimulation for treatment of partial seizures: 1. A controlled study of effect on seizures. Epilepsia. 1994;35(3):616–626. doi: 10.1111/j.1528-1157.1994.tb02482.x. [DOI] [PubMed] [Google Scholar]
- 6.Boon P, Vonck K, De H, et al. Deep brain stimulation patients with refractory temporal lobe epilepsy. Epilepsia. 2007;48:1551–1560. doi: 10.1111/j.1528-1167.2007.01005.x. [DOI] [PubMed] [Google Scholar]
- 7.Boon P, Vonck K, Vandekerckhove T, et al. Vagus nerve stimulation for medically refractory epilepsy; efficacy and cost-benefit analysis. Acta Neurochir. 1999;141(5):447–452. doi: 10.1007/s007010050324. [DOI] [PubMed] [Google Scholar]
- 8.Brunel N, Hansel D. How noise affects the synchronization properties of recurrent networks of inhibitory neurons. Neural Comput. 2006;18:1066–1110. doi: 10.1162/089976606776241048. [DOI] [PubMed] [Google Scholar]
- 9.Cantello R, Rossi S, Varrasi C, et al. Slow repetitive TMS for drug-resistant epilepsy: clinical and EEG findings of a placebo-controlled trial. Epilepsia. 2007;48(2):366–374. doi: 10.1111/j.1528-1167.2006.00938.x. [DOI] [PubMed] [Google Scholar]
- 10.Chapeau-Blondeau F, Rousseau D. The minimum description length principle for probability density estimation by regular histograms. Physica A. 2009;388:3969–3984. [Google Scholar]
- 11.Cooke PM, Snider RS. Some cerebellar influences on electrically-induced cerebral seizures. Epilepsia. 1955;4(1):19–28. doi: 10.1111/j.1528-1157.1955.tb03170.x. [DOI] [PubMed] [Google Scholar]
- 12.Cooper IS, Amin I, Upton A, et al. The effect of chronic cerebellar stimulation upon epilepsy in man. Trans Am Neurol Assoc. 1973;98:192–196. [PubMed] [Google Scholar]
- 13.Cooper IS, Amin I, Riklan M, et al. Chronic cerebellar stimulation in epilepsy. Clinical and anatomical studies. Arch Neurol. 1976;33(8):559–570. doi: 10.1001/archneur.1976.00500080037006. [DOI] [PubMed] [Google Scholar]
- 14.Cover TM, Thomas JA. Elements of Information Theory. 2. Willey; 2006. [Google Scholar]
- 15.Dinner DS, Neme S, Nair D, et al. EEG and evoked potential recording from the subthalamic nucleus for deep brain stimulation of intractable epilepsy. Clin Neurophysiol. 2002;113(9):1391–1402. doi: 10.1016/s1388-2457(02)00185-2. [DOI] [PubMed] [Google Scholar]
- 16.Emerson RC. First probability densities for receivers with square law detectors. J of Appl Phys. 1953;24(9):1168–1176. [Google Scholar]
- 17.Fisher RS. Direct brain stimulation is an effective therapy for epilepsy. Neurology. 2011;77(13):1220–1221. doi: 10.1212/WNL.0b013e3182312000. [DOI] [PubMed] [Google Scholar]
- 18.Fisher R, Salanova V, Witt T, et al. Electrical stimulation of the anterior nucleus of thalamus for treatment of refractory epilepsy. Epilepsia. 2010;51(5):899–908. doi: 10.1111/j.1528-1167.2010.02536.x. [DOI] [PubMed] [Google Scholar]
- 19.Fregni F, Otachi PT, Do Valle A, et al. A randomized clinical trial of repetitive transcranial magnetic stimulation in patients with refractory epilepsy. Ann Neurol. 2006;60(4):447–455. doi: 10.1002/ana.20950. [DOI] [PubMed] [Google Scholar]
- 20.George R, Salinsky M, Kuzniecky R, et al. Vagus nerve stimulation for treatment of partial seizures: long-term follow up on first 67 patients exiting a controlled study. Epilepsia. 1994;35(3):637–43. doi: 10.1111/j.1528-1157.1994.tb02484.x. [DOI] [PubMed] [Google Scholar]
- 21.Gerstner W. Rapid phase locking in systems with pulse-coupled oscillations with delays. Phys Rev Lett. 1996;76(10):1755–1758. doi: 10.1103/PhysRevLett.76.1755. [DOI] [PubMed] [Google Scholar]
- 22.Good LB, Sabasan S, Marsh T, et al. Control of synchronization of brain dynamics leads to control of epileptic seizures in rodents. Int J Neural Syst. 2009;19(3):173–196. doi: 10.1142/S0129065709001951. [DOI] [PMC free article] [PubMed] [Google Scholar]
- 23.Gutkin B, Jost J, Tuckwell HC. Random perturbations of spiking activity in a pair of coupled neurons. Theory Biosci. 2008;127(2):135–139. doi: 10.1007/s12064-008-0039-7. [DOI] [PMC free article] [PubMed] [Google Scholar]
- 24.Handforth A, DeGiorgio CM, Schachter SC, et al. Vagus nerve stimulation therapy for partial-onset seizures: a randomized active-control trial. Neurology. 1998;51:48–55. doi: 10.1212/wnl.51.1.48. [DOI] [PubMed] [Google Scholar]
- 25.Harris JA, Clifford CW, Miniussi C. The functional effect of transcranial magnetic stimulation: signal suppression or neural noise generation. J Cogn Neurosci. 20(4):734, 740. doi: 10.1162/jocn.2008.20048. [DOI] [PubMed] [Google Scholar]
- 26.Ruzzoli M, Abrahamyan A, Clifford CW, et al. The effect of TMS on visual motion sensitivity: an increase in neural noise or a decrease in signal strength. J Neurophysiol. 2011;106(1):138–43. doi: 10.1152/jn.00746.2010. [DOI] [PubMed] [Google Scholar]
- 27.Jacobs J, et al. High frequency oscillations (80–500 Hz) in the preictal period in patients with focal seizures. Epilepsia. 2009;50(7):1780–1792. doi: 10.1111/j.1528-1167.2009.02067.x. [DOI] [PMC free article] [PubMed] [Google Scholar]
- 28.Kac M, Siegert AJF. On the theory of noise in radio receivers with square law detectors. J of Appl Phys. 1947;18:383–397. [Google Scholar]
- 29.Knapp CH, Carter GC. The generalized correlation method for estimation of time delay. IEEE Trans Acoust Speech, Signal Proc. 1976;SP-24:320–327. [Google Scholar]
- 30.Kamida T, Kong S, Eshima N, et al. Transcranial direct current stimulation decreases convulsions and spatial memory deficits following pilocarpine-induced status epilepticus in immature rats. Behav Brain Res. 2010;2:217(1):99–103. doi: 10.1016/j.bbr.2010.08.050. [DOI] [PubMed] [Google Scholar]
- 31.Kobayashi K, et al. Detection of seizure-associated high-frequency oscillations above 500 Hz. Epilepsy Res. 2010;88:2–3. 139–144. doi: 10.1016/j.eplepsyres.2009.10.008. [DOI] [PMC free article] [PubMed] [Google Scholar]
- 32.Krauss GL, Fisher RS. Cerebellar and thalamic stimulation for epilepsy. Adv Neurol. 1993;63:231–245. [PubMed] [Google Scholar]
- 33.Lee KH, Hitti FL, Chang SY, et al. High frequency stimulation abolishes thalamic network oscillations: an electrophysiological and computational analysis. J Neural Eng. 2011;8(4):046001. doi: 10.1088/1741-2560/8/4/046001. [DOI] [PMC free article] [PubMed] [Google Scholar]
- 34.Liebetanz D, Klinker F, Hering D, et al. Anticonvulsant effects of transcranial direct-current stimulation in the rat cortical ramp model of focal epilepsy. Epilepsia. 2006;47(7):1216–1224. doi: 10.1111/j.1528-1167.2006.00539.x. [DOI] [PubMed] [Google Scholar]
- 35.Lytton WW. Computer modeling of epilepsy. Nat Rev Neurosci. 2008;9(8):626–537. doi: 10.1038/nrn2416. [DOI] [PMC free article] [PubMed] [Google Scholar]
- 36.Massoler C, Torrent MC, Garcia-Ojalvo J. Interplay of subthreshold activity, time-delayed feedback and noise, in neuronal firing patterns. Phys Rev E. 2008;78:014907. doi: 10.1103/PhysRevE.78.041907. [DOI] [PubMed] [Google Scholar]
- 37.Mirski MA, Rossell LA, Terry JB, Fisher RS. Anticonvulsant effect of anterior thalamic high frequency electrical stimulation in the rat. Epilepsy Res. 1997;28(2):89–100. doi: 10.1016/s0920-1211(97)00034-x. [DOI] [PubMed] [Google Scholar]
- 38.Misawa S, Kuwabara S, Shibuya K, et al. Low-frequency transcranial magnetic stimulation for epilepsia partialis continua, due to cortical dysplasia. J Neurol Sci. 2005;15:234(1–2):37–39. doi: 10.1016/j.jns.2005.03.035. [DOI] [PubMed] [Google Scholar]
- 39.Nichols JA, Nichols AR, Smirnakis SM, et al. Vagus nerve stimulation modulates cortical synchrony and excitability through the activation of muscarinic receptors. Neuroscience. 2011;189:207–214. doi: 10.1016/j.neuroscience.2011.05.024. [DOI] [PubMed] [Google Scholar]
- 40.Osorio I, Overman J, Giftakis J, Wilkinson SB. High frequency thalamic stimulation for inoperable mesial temporal epilepsy. Epilepsia. 2007;48:1561–1571. doi: 10.1111/j.1528-1167.2007.01044.x. [DOI] [PubMed] [Google Scholar]
- 41.Postnova S, Finke C, Jin W, et al. A computational study of the interdependencies between neuronal impulse pattern, noise effects and synchronization. J Physiol Pair. 2010;104(3–4):176–189. doi: 10.1016/j.jphysparis.2009.11.022. [DOI] [PubMed] [Google Scholar]
- 42.Ritt JT. Evaluation of entrainment of a non-linear oscillator to white noise. Phys Rev E. 2003;68:041915. doi: 10.1103/PhysRevE.68.041915. [DOI] [PubMed] [Google Scholar]
- 43.Rossi S, Hallett M, Rossini PM, et al. Safety, ethical considerations, and application guidelines for the use of TMS in clinical practice and research. Clin Neurophysiol. 2009;120(12):2008–2039. doi: 10.1016/j.clinph.2009.08.016. [DOI] [PMC free article] [PubMed] [Google Scholar]
- 44.Rotenberg A, Bae EH, Takeoka M, et al. Repetitive transcranial magnetic stimulation in the treatment of epilepsia partialis continua. Epilepsy Behav. 2009;14(1):253–257. doi: 10.1016/j.yebeh.2008.09.007. [DOI] [PMC free article] [PubMed] [Google Scholar]
- 45.Rotenberg A, Depositatior-Cabacar D, Bae EH, et al. Transient suppression of seizures by repetitive transcranial magnetic stimulation in a case of Rasmussen’s encephalitis. Epilepsy Behav. 2008;13(1):260–2. doi: 10.1016/j.yebeh.2007.12.022. [DOI] [PMC free article] [PubMed] [Google Scholar]
- 46.Ruzzoli M, Abrahamyan A, Clifford CW, et al. The effect of TMS on visual motion sensitivity: an increase in neural noise or a decrease in signal strength. J Neurophysiol. 2011;106(1):138–143. doi: 10.1152/jn.00746.2010. [DOI] [PubMed] [Google Scholar]
- 47.Stamoulis C, Chang BS. Application of Matched-Filtering to Extract EEG Features and Decouple Signal Contributions from Multiple Seizure Foci in Brain Malformations. IEEE Proc 4th Int Conf Neural Eng. 2009;1:514–517. doi: 10.1109/NER.2009.5109346. [DOI] [PMC free article] [PubMed] [Google Scholar]
- 48.Stamoulis C, Gruber LJ, Schomer DL, Chang BS. High-frequency neuronal network modulations encoded in scalp EEG precede the onset of focal seizures. Epilepsy Behav. 2012;23(4):471–80. doi: 10.1016/j.yebeh.2012.01.001. [DOI] [PMC free article] [PubMed] [Google Scholar]
- 49.Tellez-Zenteno JF, McLachlan RS, Parrent A, et al. Hippocam-pal electrical stimulation in mesial temporal lobe epilepsy. Neurology. 2006;66(10):1490–1494. doi: 10.1212/01.wnl.0000209300.49308.8f. [DOI] [PubMed] [Google Scholar]
- 50.Theodore WH. Transcranial magnetic stimulation in epilepsy. Epilepsy Curr. 2003;3(6):191–97. doi: 10.1046/j.1535-7597.2003.03607.x. [DOI] [PMC free article] [PubMed] [Google Scholar]
- 51.Theodore WH, Fisher RS. Brain stimulation for epilepsy. Lancet Neurol. 2004;3(2):111–118. doi: 10.1016/s1474-4422(03)00664-1. [DOI] [PubMed] [Google Scholar]
- 52.Ursino M, La Cara GE. Travelling waves and EEG patterns during epileptic seizure: analysis with integrate-and-fire-neurons. J Theoret Biol. 2006;242:171–187. doi: 10.1016/j.jtbi.2006.02.012. [DOI] [PubMed] [Google Scholar]
- 53.Van Buren JM, Wood JH, Oakley J, Hambrecht F. Preliminary evaluation of cerebellar stimulation by double-blind stimulation and biological criteria in the treatment of epilepsy. J Neurosurg. 1978;48(3):407–416. doi: 10.3171/jns.1978.48.3.0407. [DOI] [PubMed] [Google Scholar]
- 54.Varga ET, Terney D, Atkins MD, et al. Transcranial direct current stimulation in refractory continuous spikes and waves during slow sleep: a controlled study. Epilepsy Res. 2011 doi: 10.1016/j.eplepsyres.2011.07.016. in press. [DOI] [PubMed] [Google Scholar]
- 55.Vejmelka M, Palus M. Inferring the directionality of coupling with conditional mutual information. Phys Rev E. 2008;77:026214. doi: 10.1103/PhysRevE.77.026214. [DOI] [PubMed] [Google Scholar]
- 56.Velasco M, Velasco F, Velasco AL, et al. Sub-acute electrical stimulation of the hippocampus blocks intractable temporal lobe seizures and paroxysmal EEG activities. Epilepsia. 2000;41:158–169. doi: 10.1111/j.1528-1157.2000.tb00135.x. [DOI] [PubMed] [Google Scholar]
- 57.Velasco AL, Velasco F, Velasco M, et al. Electrical stimulation of the hippocampal epileptic foci for seizure control: a double-blind, long-term follow-up study. Epilepsia. 2007;48(10):1895–1903. doi: 10.1111/j.1528-1167.2007.01181.x. [DOI] [PubMed] [Google Scholar]
- 58.Velasco F, Velasco M, Velasco AL, et al. Central nervous system neuromodulation for the treatment of epilepsy. II. Mechanisms of action and perspectives. Neurochirurgie. 2008;54(3):428–435. doi: 10.1016/j.neuchi.2008.02.033. [DOI] [PubMed] [Google Scholar]
- 59.Vesper J, Steinhoff B, Rona S, et al. Chronic high-frequency deep brain stimulation of the STN/SNr for progressive myoclonic epilepsy. Epilepsia. 2007;48(10):1984–1989. doi: 10.1111/j.1528-1167.2007.01166.x. [DOI] [PubMed] [Google Scholar]
- 60.Vicente R, Wibral M, Lindner M, Pipa G. Transfer entropy - a model-free measure of effective connectivity for the neurosciences. J Comput Neurosci. 2010;30(1):45–67. doi: 10.1007/s10827-010-0262-3. [DOI] [PMC free article] [PubMed] [Google Scholar]
- 61.Victor J. Binless strategies for estimation of information from neural data. Phys Rev E. 2002;66:051903. doi: 10.1103/PhysRevE.66.051903. [DOI] [PubMed] [Google Scholar]
- 62.Wang S, Liu F, Wang W, Yu Y. Impact of spatially correlated noise on neuronal firing. Phys Rev E. 2004;69:011909. doi: 10.1103/PhysRevE.69.011909. [DOI] [PubMed] [Google Scholar]


