Abstract
This paper reports a pulse inversion chirp coded tissue harmonic imaging (PI-CTHI) method for visualizing small animal hearts that provides fine spatial resolution at a high frame rate without sacrificing the echo signal to noise ratio (eSNR). A 40 MHz lithium niobate (LiNbO3) single element transducer is employed to evaluate the performance of PI-CTHI by scanning tungsten wire targets, spherical anechoic voids, and zebrafish hearts. The wire phantom results show that PI-CTHI improves the eSNR by 4 dB from that of conventional pulse inversion tissue harmonic imaging (PI-THI), while still maintaining a spatial resolution of 88 and 110 μm in the axial and lateral directions, respectively. The range side lobe level of PI-CTHI is 11 dB lower than that of band-pass filtered CTHI (or F-CTHI). In the anechoic sphere phantom study, the contrast-to-noise ratio of PI-CTHI is found to be 2.7, indicating a 34% enhancement over conventional PI-THI. Due to such improved eSNR and contrast resolution, blood clots in zebrafish hearts can be readily visualized throughout heart regeneration after 20% of the ventricle is removed. Disappearance of the clots in the early stages of the regeneration has been observed for 7 days without sacrificing the fish.
Keywords: High frequency ultrasound, Chirp coded excitation, Tissue harmonic imaging, Zebrafish
INTRODUCTION
Zebrafish hearts have been studied to gain clinically relevant information of human heart diseases3 and considered as an ideal genetic model for in vivo experiments because of (1) their fully sequenced genome along with well preserved gene function and (2) the ability of heart regeneration after resection.20 Immediately after the ventricle is amputated, blood clots form and are transformed into fibrin clumps. Optical imaging methods have frequently been employed to visualize the regeneration process of adult zebrafish that require sacrificing the fish before imaging, making further follow-up impossible.12 In studying zebrafish hearts non-invasively, imaging modalities such as MRI, CT and ultrasound need to have high spatial resolution8 to allow the visualization of cardiac anatomy. Among these imaging methods, high frequency ultrasound imaging (>20 MHz) is the only real time imaging technique capable of achieving a high frame rate, which is crucial for observing rapid heart movement.9 The size of a zebrafish heart is typically only 1 mm2 and heart boundaries are difficult to discriminate from the surrounding tissues in ultrasound images due to the similar echo characteristics of adjacent tissues. An ultrasound imaging mode capable of both high contrast/spatial resolution and enhanced echo signal to noise ratio (eSNR) is essential for monitoring amputated zebrafish hearts.
Tissue harmonic imaging (THI) techniques can be employed for enhancing degraded image quality at fundamental frequencies e.g., to suppress artifacts and improve lateral resolution.10 For small animal ultrasound imaging, Cherin et al.5 used ultrasound biomicroscopy (UBM) to image mouse kidneys with THI. They demonstrated that THI exhibited better tissue boundary delineation and reflection artifact suppression than imaging at the fundamental frequency of 40 MHz. However, THI may suffer from reduced dynamic range and degraded axial resolution due to increased attenuation at the harmonic frequency and the use of multiple cycled bursts.2
In order to enhance the eSNR of THI without compromising other image qualities including spatial resolution, frequency modulated bursts known as chirp coded excitations have often been implemented by transmitting elongated burst signals and compressing the echoes using matched filters,6,18 where the transmitted signals are time-inverted and convolved with the echoes. Borsboom et al.4 demonstrated a 10 dB increase in eSNR using chirp coded THI (CTHI) from short burst THI. The range sidelobe level (RSLL) however, was found to increase because of spectral overlaps between harmonic and fundamental signals,1 creating shadows around a flow phantom. Hence the RSLL was measured with hydrophones to compare the performance between CTHI variants, such as band-pass filtered CTHI (F-CTHI), pulse inversion CTHI (PI-CTHI), and amplitude modulated CTHI (A-CTHI).22 The study showed that PI-CTHI produced the lowest RSLL by minimizing the fundamental signals.
Therefore, in this paper, a PI-CTHI technique, which alternately sends out a pulse inversion pair to a designated location to eliminate the residual fundamental signal that ultimately elevates RSLL, is proposed with a high frame rate UBM system developed in the authors’ laboratory.19 Note that high frequency chirp coded excitation needs arbitrary waveform generators (AWG) which are not commercially available for array scanners. In the mechanical scanning system, however, the slight phase difference of received echoes is unavoidable between the inverted pair due to the transducer’s movement. The error is minimized by optimizing beam sequence and acquisition timing. The imaging performance is quantitatively evaluated with respect to the eSNR and the contrast to noise ratio (CNR) by scanning tungsten wires and spherical voids embedded in tissue specimens. With PI-CTHI, the amputation-induced clotting in zebrafish has been non-invasively monitored before and after heart resection for 7 days without sacrificing the fish. This in vivo experiment without sacrificing the fish may not be achieved by other small animal imaging modalities.
METHODS
System Configuration
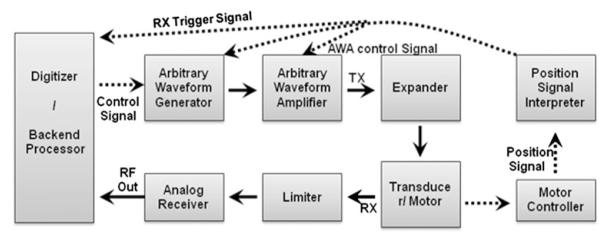
The custom-designed high frame rate UBM system for PI-CTHI consists of an arbitrary waveform amplifier (AWA), an AWG, a motor controller, an analog receiver, and a backend processing software.19 Figure 1 depicts imaging and control signal routes indicated by solid and dashed lines, respectively. A step motor sweeps for sector imaging at a frame rate of as high as 68 Hz, and a motor controller takes the position signal from a positioning sensor within the ultrasound probe. The position signal is interpreted by a position signal interpreter which commands trigger signals. Once the transducer translates its position from right to left, trigger signals for imaging vectors are generated by referring to the position signals. The transmitted pulse types are programmed into AWG by a field-programmable gate array (FPGA) (Spartan-3E, Xilinx, USA).
FIGURE 1.
Block diagram of a custom-designed high frame rate PI-CTHI UBM system.
Received RF signals are first amplified by a low noise pre-amplifier (AD8331, Analog Devices, USA), followed by an AWA (LN1000, Amplifier Research, USA). The resultant gain is 61 dB within the amplifier’s bandwidth ( = 95 MHz). The back-end system installed in a desktop computer includes a 14-bit analog to digital converter (ADC) (CS14200, GaGe Applied Technologies Inc., Canada) where pre-amplified echoes imported from the front-end system are digitized at a 200 MHz sampling rate. The sampled signal is transferred back to the back-end LabVIEW software that saves 100 scan lines of data per sweep of the transducer.
PI-CTHI Sequence
A pair of pulse-inverted scan lines is alternately fired from the AWG at a pulse repetition frequency (PRF) of 45 kHz until 100 scan lines are collected within a sector angle of 6°. For PI-CTHI, a pair of Hanning windowed chirp signals are synthesized with a MATLAB program (R2010b, Mathworks, USA) using Eq. (1) and later programmed into the AWG.
| (1) |
where Chirp_In and Chirp_Out denote the pulse inversion pair and fi is the lowest frequency of the chirp, α is the rate of the frequency increase per second, and WHanning is the Hanning window function. The purpose of such a gating function is to reduce inherent RSLLs in chirp coded excitation imaging.13 The duration of the chirp is 1 μs for the near field imaging. Table 1 shows the frequency range of the chirp used in this study. Conventional sinusoidal bursts are also programmed in the AWG. To compare the images acquired by both short burst and coded excitation methods, the voltage level of all the programmed bursts are set to have equivalent magnitudes.
TABLE 1.
Transmitted waveform types for ultrasound measurements
| Imaging type | Phantom measurement | In vivo study |
|---|---|---|
| PI-CTHI | 10–30 MHz | 12.5–37.5 MHz |
| C-Fundamental | 20–60 MHz | 25–75 MHz |
| PI-THI | 3 Cycle 25 MHz | 3 Cycle 25 MHz |
| Fundamental | 2 Cycle 50 MHz | 2 Cycle 50 MHz |
Pulse Decoding
A signal representing each scan line is acquired by summing up the neighboring pair of pulse-inverted beam lines, before being compressed by a matched filter as expressed in Eq. (2)15 below.
| (2) |
The compressed signal is then time-inverted and convolved with the original signal to restore the spatial resolution.
Motion Artifact Rejection
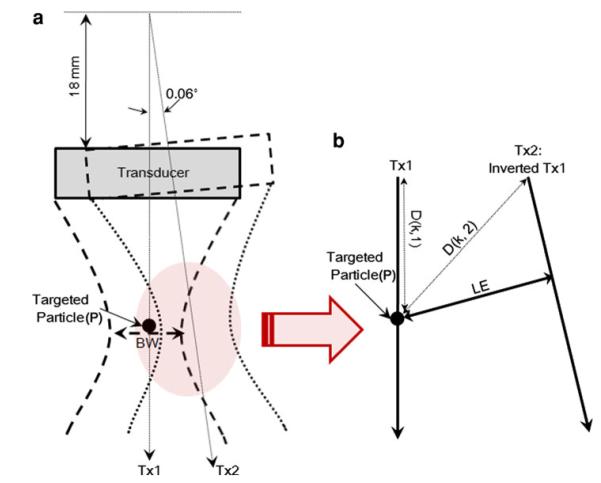
Pulse inversion beam pairs may not be capable of fully eliminating the fundamental frequency signal in mechanical sector scanning because of the transducer movement. Figure 2 depicts parameters to be considered as a transducer changes its position to scan a target at a point P. A 40 MHz LiNbO3 transducer, focused at 6 mm, has a 50% bandwidth and its aperture size is 3 mm.23 Given the sound speed c in a medium, the time difference Δt between Tx1 and Tx2 beams depends on the axial distance from the transducer’s aperture to the target and caused by the variation in path length, as given in Eq. (3).
| (3) |
where k is an index number along the depth; D(k,1) and D(k,2) are path lengths of the kth samples on Tx1 and Tx2. The lateral distance between the pair of pulse inversion beams is determined by
| (4) |
where FD represents the focal distance, AS the aperture size, λ the wavelength, LE the location error between two incident sites, and θ the angle between two adjacent lines. Note that the distance from the rotational axis of the motor to the transducer is 18 mm. The estimated path difference is 0.2 μm at the focus, negligible compared to the wavelength ( = 38 μm) at 40 MHz. To increase the correlation between the pulse inversion pair, the beams forming each harmonic scan line are acquired before LE exceeds the half of the BW, as illustrated in Fig. 2. From Eq. (4), the ideal BW of the transducer is 76 μm and the maximum acquisition angle is 0.09° between two adjacent scan lines. As a result, the included angle of our system is 0.06° and the resulting LE is 25 μm. The maximum depth is 17 mm. Since no vector can be inserted between the pulse inversion pair to accomplish a 10 mm depth of view, multi-beam harmonic imaging approach7 developed for IVUS may not be appropriate for high frame rate UBMs.
FIGURE 2.
Variables associated with motor movements in a sector UBM. (a) The transducer is rotated by 0.06°. The shadowed area is magnified as shown in (b).
The pulsing sequence and the timing strategy are optimized at the focus by scanning 20 μm thick tungsten wires immersed in de-ionized water. The axial brightness profiles in the wire images are compared with respect to the sweeping speed of 30 Hz (slow) and 68 Hz (fast). In case of 6° sector scanning at PRF = 45 kHz, for instance, 200 beam lines are acquired for slow sweeping and only 100 lines for fast sweeping mode. Under these scanning conditions, the acquired imaging data is processed with the proposed method (summation of the two adjacent beam lines) and the multi-beam harmonic imaging approach, and a PI-CTHI scan line is formed according to Eq. (5) below.
| (5) |
where SL(n) is the nth PI-CTHI scan line and BL(n) is the nth received beam line before summation. The acquired axial brightness profiles are shown in Fig. 3. In the slow speed condition with the multi-beam method, the RSLL is similar to or slightly decreased from that of PI-CTHI. In contrast, the RSLL is increased in the fast speed condition with both approaches. Therefore the multi-beam approach may not perform effectively under the fast speed condition unless all the beams meet the criterion given by Eq. (4).
FIGURE 3.
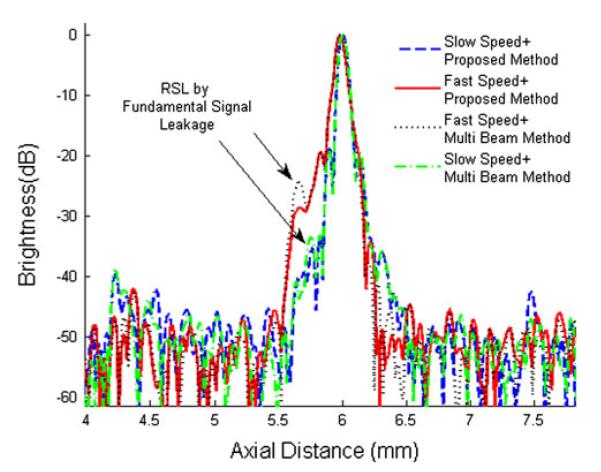
Axial brightness profiles of wire target images depending on the scanning speed of 30 Hz (slow) and 68 Hz (fast). Note that RSL is range side lobe.
Wire and Sphere Phantom
A wire phantom consists of five tungsten wires of the same diameter. Those diagonally-aligned wires are placed 1.5 and 0.65 mm apart, both axially and laterally. Note that the center wire is located at the focus. The wire phantom images are obtained through 2–9.7 mm in depth, and the eSNR is analyzed by Eq. (6) below.
| (6) |
Prior to the analysis, a reference image frame is acquired at ambient noise level. The symbols, σ(·) and abs(·) are the standard deviation and the absolute value of an image frame. The RSLL are measured at fundamental and harmonic frequencies.
A spherical void (or cyst) phantom17 is used for evaluating the contrast resolution, where 530 μm diameter anechoic cysts are randomly distributed in a tissue mimicking phantom. The phantom is made from a mixture of high-grade agarose (A4679, Sigma-Aldrich Corporation, USA), preservative (Liquid Germall Plus, International Specialty Products, USA), propylene glycol (P355, Fisher Scientific, USA), whole bovine milk, and 3.5 μm glass beads. The measured sound speed and attenuation coefficient in the phantom are 1540 m/s and 0.14 dB/cm/MHz1.39.
The contrast resolution is quantified with the CNR, the logarithmic difference between mean values of image kernels inside and outside an object, as expressed in Eq. (7).14
| (7) |
where μc is the mean intensity of the object in dB, and μb and σb are the mean and the standard deviation of the intensity of the surrounding background.
Small Animal Experiment
Zebrafish heart scans are performed in accordance with protocols approved by the Institutional Animal Care and Use Committee (IACUC) at the University of Southern California. An adult zebrafish is anesthetized for 30 s by submerging it in 0.08% tricaine solution (MS-222, Sigma-Aldrich, USA) before scales around the zebrafish heart are removed. The fish are then placed in 0.04% tricaine solution at room temperature with its ventral side facing upwards, as the transducer scanning on top of the abdomen. During the scanning, the amputation site is placed as closely to focus of the transducer (6 mm) as possible. The frame rate is 68 fps at a PRF of 45 kHz. Note that the phase shift between the pulse inversion pair due to the heart contraction is minute (less than 0.02 μm although the amount of the motion is assumed to be 1 mm, close to the size of heart) at such a high PRF. After the heart images are taken in the sagittal plane, 20% of ventricular heart tissues of six zebrafish are amputated. The ultrasound images are acquired 1 (two fish), 3 (two fish), and 7 (two fish) days after the heart amputation (dpa). The fish are sacrificed immediately after imaging, and histological data are obtained with acid fuchsin orange G-stain (AFOG) to identify fibrin clot.3 Note that orange, red, and blue colors indicate muscle, fibrin, and collagen, respectively. A sham is imaged twice, on the first day before- and after open-chest without amputation. The scanning location is adjusted at every frame along the lateral direction to make sure that much of the heart including the aorta and the ventricle are shown on the same image plane. The clot size is measured by ImageJ (ImageJ 1.44p, National Institutes of Health, USA) on both ultrasound images and histological images. The relevance of comparisons between the two data groups is evaluated by the two-sided paired t test, with the level of significance set at p = 0.05.
Echogenicity depends on the types of the clots. Typically, fibrin clots which contain erythrocytes show brighter gray-levels than platelet-rich white clots.11,21 When the hearts are cut, myocardial infarction forms fibrin clots caused by low pressure within zebrafish heart.16 The fibrin clot can be seen as bright areas in the amputated region. Hence it is possible to differentiate the clots from the surrounding heart muscles simply by echo brightness. Longitudinal measurements are performed for five zebrafish. The brightness of echo is measured by ImageJ (ImageJ 1.44p, National Institutes of Health, USA) for the ultrasound heart images acquired on 0 dpa (before the heart amputation), on 1 dpa, on 3 dpa and on 7 dpa without sacrificing the fish. All the brightness data are expressed as mean ± standard deviation of indicated sample sizes, and analyzed by a two-sided paired t test, with the level of significance set at p = 0.05.
RESULTS
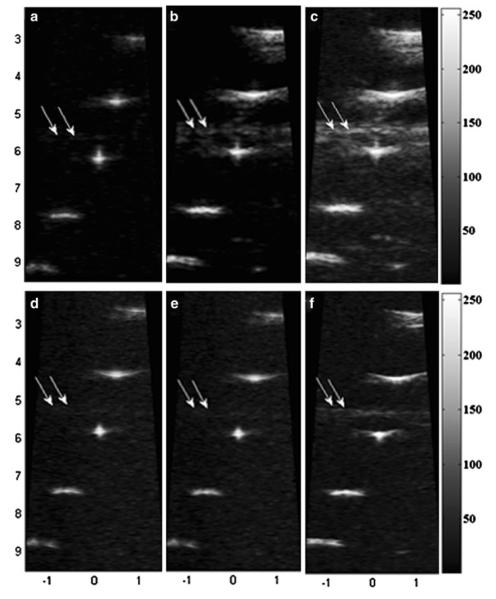
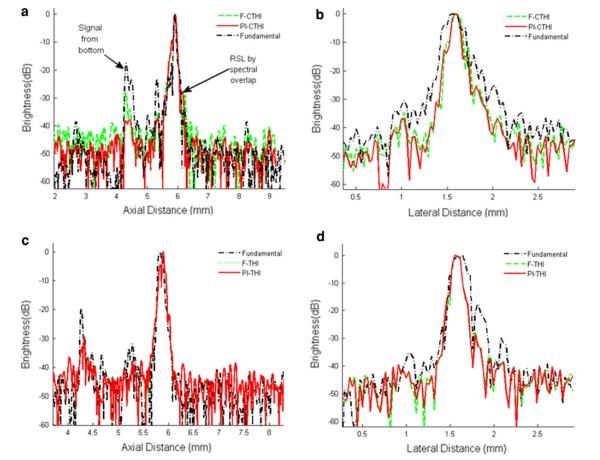
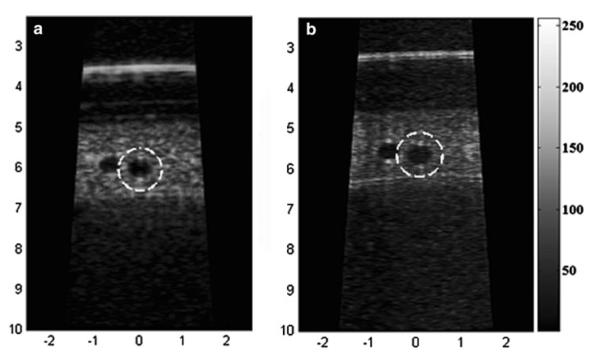
Figures 4a–4c depict the wire phantom images acquired by the high frame rate PI-CTHI, F-CTHI and fundamental imaging (C-Fund) using chirp coded excitation, respectively. The same set of images corresponding to PI-THI, F-THI, and fundamental imaging (B-Fund) are obtained by using short bursts as shown in Figs. 4d–4f, respectively. Each image shows five wires and is compressed into the logarithm scale with 55 dB dynamic range and displayed with an 8-bit gray map. Figure 5 shows the brightness profiles for chirp coded excitation (Figs. 5a and 5b) and short burst methods (Figs. 5c and 5d) along the axial (Figs. 5a and 5c) and the lateral (Figs. 5b and 5d) directions. The eSNR of PI-CTHI (57 dB) is a 4 dB improvement over PI-THI (53 dB). The axial and the lateral resolutions are 88 and 110 μm, respectively for PI-CTHI, while only 88 and 263 μm, respectively for C-Fund. Echo signals from the bottom of the water tank, indicated by white arrows in Fig. 4, are more suppressed with PI-CTHI (–40 dB) than for either F-CTHI (–18 dB) or C-Fund (–28 dB). The RSLL is only –40 dB for PI-CTHI while –29 dB for F-CTHI. The values of spatial resolution and eSNR are listed in Table 2 and the frequency responses of the echo from the center wire are shown in Fig. 6. In the region overlapped by harmonic and fundamental signals (20–30 MHz), the fundamental signal level is suppressed to –38 dB for F-CTHI and –60 dB for PI-CTHI. Therefore the results suggest that eSNR of PI-CTHI is improved from that of PI-THI without loss of spatial resolution, and the application of pulse inversion helps reducing RSLL. Figure 7 shows anechoic void phantom images near the focus. A 530 μm diameter sphere, marked by white circles, is used to calculate the CNRs of PI-CTHI (2.76) and PI-THI (2.05) shown in Figs. 7a and 7b. Figure 8 shows the acquired eSNR distribution as a function of depth using the tissue phantom without spheres, where the surface of the phantom is located at a depth of 4 mm. The peak eSNR of PI-CTHI is 23 dB at the focus while that of PI-THI is 12 dB. The depth of penetration, which is the depth at which the eSNR drops below 6 dB,24 is increased from 6.8 mm in PI-THI to 7.3 mm in PI-CTHI.
FIGURE 4.
Wire phantom images obtained by (a) PI-CTHI, (b) F-CTHI, (c) C-Fund, (d) PI-THI, (e) F-THI, and (f) B-Fund. Five wire targets are visualized with the center wire focused at 6 mm.
FIGURE 5.
Brightness profiles of center wire target images acquired along (a) the axial and (b) the lateral directions using the coded excitation technique; (c) the axial and (d) the lateral directions using the conventional pulse-echo approach.
TABLE 2.
Spatial resolution and eSNR from wire target experiments
| PI-CTHI | F-CTHI | C-Fund | PI-THI | F-THI | Fund | |
|---|---|---|---|---|---|---|
| Axial resolution (μm) |
88.0 | 96.0 | 87.5 | 96.0 | 96.0 | 115.0 |
| Lateral resolution (μm) |
110 | 130 | 263.0 | 130.0 | 130.0 | 200.0 |
| eSNR (dB) | 57 | 57.0 | 62.3 | 53.0 | 52.9 | 52.9 |
FIGURE 6.
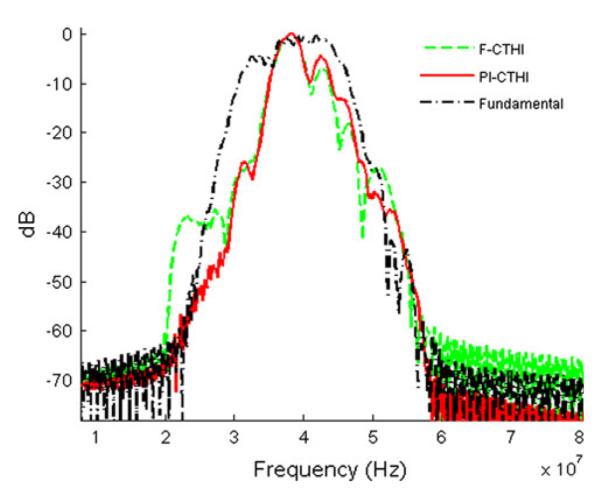
Spectrum analysis of scan lines at the center wire. A green dashed line is acquired from F-CTHI, a red solid line from PI-CTHI, and a black dash-dotted from C-Fund.
FIGURE 7.
Sphere phantom images corresponding to (a) PI-CTHI and (b) PI-THI.
FIGURE 8.
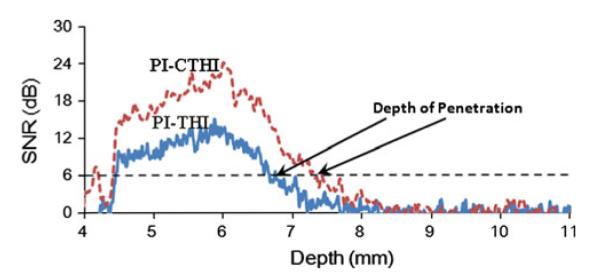
Comparison of eSNR distributions along the depth for PI-CTHI (a red dashed line) and PI-THI (a blue solid line). The depth of penetration for each method is indicated by a solid arrow.
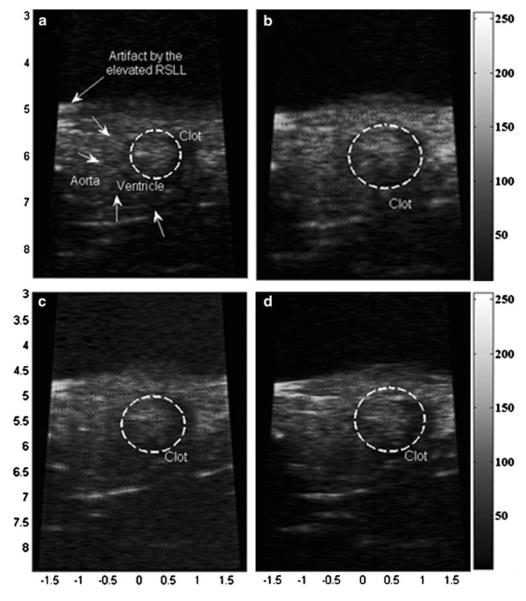
Figure 9 shows zebrafish heart images in the same sagittal view, acquired 1 dpa. PI-CTHI (Fig. 9a), C-Fund (Fig. 9b), PI-THI (Fig. 9c) and B-Fund (Fig. 9d) images are obtained with a dynamic range of 55 dB. In each image, a white dashed circle indicates the generated red clot region. White arrows in Fig. 9a indicate outer boundaries of epicardium, which can hardly be discriminated from muscle regions in other imaging approaches. The brightness contrast between the clot region and the boundary is 18 dB as compared to 6, 5, and 11 dB for C-Fund, PI-THI, and B-Fund respectively. Note that the brightness level has been measured using ImageJ (ImageJ 1.44p, National Institutes of Health, USA). Consequently, the heart boundary in the PI-CTHI image is better distinguished from the surrounding area than those obtained by other imaging modes.
FIGURE 9.
Zebrafish heart images acquired by (a) PI-CTHI, (b) C-Fund, (c) PI-THI, and (d) B-Fund. The clots are indicated by white dashed circles.
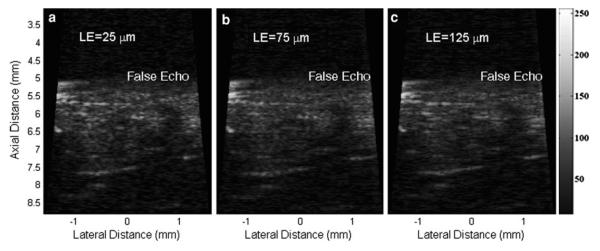
Figure 10 shows how moving artifacts affect the image qualities of PI-CTHI. The image data used for Figs. 10a–10c is processed at the different values of LE: 25 μm (achieved by summing the neighboring pair), 75 μm (achieved by summing the pair which is separated by two beamlines) and 125 μm (achieved by summing the pair which is separated by four beamlines) respectively. As the distance between the pulse inversion pair increases, the level of the false echo caused by the RSLL on fish scales is also elevated by 1.28 dB. Speckle patterns of images acquired at both 75 and 125 μm LE are more blurred on the image at 25 μm LE.
FIGURE 10.
Moving artifact effects on PI-CTHI when the values of LE are (a) 25 μm (b) 75 μm and (c) 125 μm.
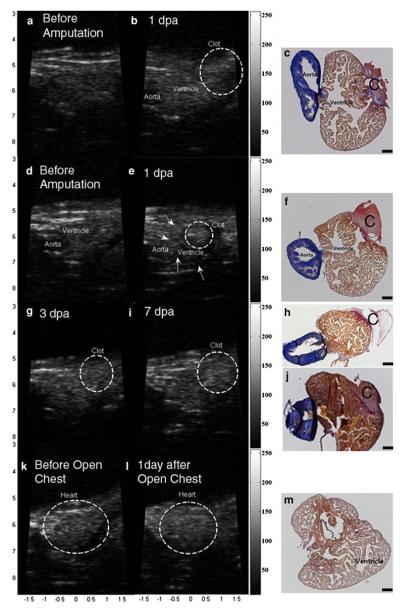
Figure 11 presents the clot images throughout the days after amputation along with its histological images. Figures 11a and 11d are taken before amputation, Figs. 11b and 11e 1 dpa, Fig. 11g 3 dpa and Fig. 11i 7 dpa. Figure 11k is obtained before open-chest without amputation, and Fig. 11l 1 day after opening the chest for sham imaging. Fibrin clots, which are identified by red in the histological data, are clearly visualized 7 dpa as brighter regions than the same regions on 0 dpa while no distinguishable bright echo is found in the sham area. For reference, the movie files for in vivo experiments of PI-CTHI and PI-THI are attached. The clot sizes, measured on ultrasound images, vary from 0.28 to 0.35 mm2 between the six samples, and no significant difference of the clot size between ultrasound images and histological data is found by statistic analysis (p = 0.4782).
FIGURE 11.
PI-CTHI UBM images of zebrafish (a) before amputation, (b) 1 dpa, and (c) the corresponding histology. Images are acquired from another zebrafish (d) before amputation, (e) 1 dpa with (f) its histology. The same set of images is also taken at 3 dpa ((g) and (h)) and 7 dpa ((i) and (j)). Images of sham zebrafish are displayed (k) before open-chest, (l) 1 day after open-chest, and (m) for the histology. In each histology image, clot is marked with ‘C’ and the black scale bar indicates 100 μm.
In the longitudinal study of echo brightness measurement for 7 days, Fig. 12 shows that the average intensity of the clot increases nearly twofold higher after the amputation and subsequently decreases to the original level (1 dpa: p = 0.003, 3 dpa: p = 0.004, 7 dpa: p = 0.114). There are no significant differences in the average intensity values between the five fish after amputation (p = 0.6615).
FIGURE 12.
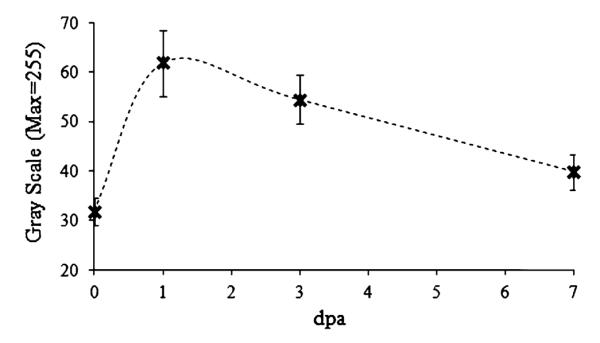
Longitudinal study of changes in mean echo intensity from the clots from 1 to 7 dpa. Error bars indicates standard deviation between 5 fish for the experiment.
DISCUSSION
Previous studies have reported that clots formed during zebrafish heart regeneration disappear at the early stage before 30 dpa. In these studies, histology is typically taken by sacrificing different fish at every day after the amputation. In the present study, it is demonstrated that real time high frequency ultrasound imaging is capable of overcoming such a limitation. A PI-CTHI approach using the chirp coded excitation is implemented in a high frame rate UBM system by optimizing the beam sequence and acquisition timing. This proposed technique outperforms fundamental imaging and F-CTHI in terms of artifact suppression. It is found that the eSNR and the contrast/spatial resolution of the chirp code are better than those of the current PI-THI method as shown in Fig. 7 and Table 2. High frame rate PI-CTHI enables the visualization of fibrin clot formations in amputated zebrafish hearts. The boundaries of hearts and clots can be better discriminated using PI-CTHI versus other approaches as shown in Fig. 9. A comparison of histology with ultrasound images (Fig. 11) confirms that fibrin clots are formed at the tip of ventricles and that the bright echo in the ultrasound images are indeed the fibrin clots.
From the clot region in the PI-CTHI images, echo intensity changes from the clots are measured. As previous studies have demonstrated, fibrin clots containing red blood cells exhibit higher echo intensity than white clots. The fibrin clots 1 dpa are nearly twice as bright as the echoes from the heart boundaries before amputations (Fig. 12), as shown in the PI-CTHI images. From the longitudinal studies, the gradual decrease of echo intensity level for 7 days could be an indication of the heart recovery although the physiological reason for the decrease should be further investigated. These results clearly demonstrate the real-time capability of the proposed PI-CTHI when tissue regeneration process is monitored in fast moving organs of small animals.
Supplementary Material
ACKNOWLEDGMENT
This work has been supported by NIH Grants R01-HL79976 and P41-EB2182 and the National Research Foundation of Korea (NRF) grant funded by the Korea government (MEST) (No. 2012R1A1A1015778).
Footnotes
ELECTRONIC SUPPLEMENTARY MATERIAL
The online version of this article (doi:10.1007/s10439-012-0636-y) contains supplementary material, which is available to authorized users.
REFERENCES
- 1.Arshadi R, Yu ACH, Cobbold RSC. Coded excitation methods for ultrasound harmonic imaging. Can. Acoust. 2007;35:35–46. [Google Scholar]
- 2.Averkiou MA. Tissue harmonic imaging. IEEE Ultrason. Symp. 2000;2:1563–1572. [Google Scholar]
- 3.Bakkers J. Zebrafish as a model to study cardiac development and human cardiac disease. Cardiovascular Res. 2011 doi: 10.1093/cvr/cvr098. doi:10.1093/cvr/cvr098. [DOI] [PMC free article] [PubMed] [Google Scholar]
- 4.Borsboom JMG, Chien TC, Bouakaz A, Versluis M, de Jong N. Harmonic chirp imaging method for ultrasound contrast agent. IEEE Trans. Ultrason. Ferroelectr. Freq. Control. 2005;52:241–249. doi: 10.1109/tuffc.2005.1406550. [DOI] [PubMed] [Google Scholar]
- 5.Cherin EW, Poulsen JK, Van Der Steen AFW, Lum P, Foster FS. Experimental characterization of fundamental and second harmonic beams for a high-frequency ultrasound transducer. Ultrasound Med. Biol. 2002;28:635–646. doi: 10.1016/s0301-5629(02)00498-2. [DOI] [PubMed] [Google Scholar]
- 6.Chiao RY, Hao X. Coded excitation for diagnostic ultrasound: a system developer’s perspective. IEEE Trans. Ultrason. Ferroelectr. Freq. Control. 2005;52:160–170. doi: 10.1109/tuffc.2005.1406543. [DOI] [PubMed] [Google Scholar]
- 7.Frijlink ME, Goertz DE, Bouakaz A, van der Steen AFW. A simulation study on tissue harmonic imaging with a single-element intravascular ultrasound catheter. J. Acoust. Soc. Am. 2006;3:1723–1731. doi: 10.1121/1.2226069. [DOI] [PubMed] [Google Scholar]
- 8.Hauff P. Small Animal Imaging: Basics and Practical Guide. Berlin: Springer. 2006:119–124. [Google Scholar]
- 9.Hauff P. Small Animal Imaging: Basics and Practical Guide. Berlin: Springer. 2006:207–217. [Google Scholar]
- 10.Hohl C, Schmidt T, Haage P, Honnef D, Blaum M, Staatz G, Guenther RW. Phase-inversion tissue harmonic imaging compared with conventional B-mode ultrasound in the evaluation of pancreatic lesions. Eur. Radiol. 2004;14:1109–1117. doi: 10.1007/s00330-003-2191-2. [DOI] [PubMed] [Google Scholar]
- 11.Johnstone E, Friedl SE, Maheshwari A, Abela GS. Distinguishing characteristics of erythrocyte-rich and platelet rich thrombus by intravascular ultrasound catheter system. J. Thromb. Thrombolysis. 2007;24:233–239. doi: 10.1007/s11239-007-0027-7. [DOI] [PubMed] [Google Scholar]
- 12.Jopling C, Sleep E, Raya M, Marti M, Raya A, Belmonte JCI. Zebrafish heart regeneration occurs by cardiomyocyte dedifferentiation and proliferation. Nature. 2010;464:606–609. doi: 10.1038/nature08899. [DOI] [PMC free article] [PubMed] [Google Scholar]
- 13.Kanagaratnam P, Gogineni SP, Ramasami V, Braaten D. A wideband radar for high-resolution mapping of near-surface internal layers in glacial ice. IEEE Trans. Geosci. Remote Sens. 2005;42:483–490. [Google Scholar]
- 14.Karaman M, Li PC, O’Donnell M. Synthetic aperture imaging for small scale systems. IEEE Trans. Ultrason. Ferroelectr. Freq. Control. 1995;42:429–442. [Google Scholar]
- 15.Kim DY, Lee JC, Kwon SJ, Song TK. Ultrasound second harmonic imaging with a weighted chirp signal. IEEE Ultrason. Symp. 2001;2:1477–1480. [Google Scholar]
- 16.Laflamme MA, Murry CE. Heart regeneration. Nature. 2011;473:326–335. doi: 10.1038/nature10147. [DOI] [PMC free article] [PubMed] [Google Scholar]
- 17.Madsen EL, Frank GR, McCormick MM, Deaner ME, Stiles TA. Anechoic sphere phantoms for estimating 3-D resolution of very-high-frequency ultrasound scanners. IEEE Trans. Ultrason. Ferroelectr. Freq. Control. 2010;57:2284–2292. doi: 10.1109/TUFFC.2010.1689. [DOI] [PMC free article] [PubMed] [Google Scholar]
- 18.Misaridis T, Jensen JA. Use of modulated excitation signal in medical ultrasound. Part I: basic concepts and expected benefits. IEEE Trans. Ultrason. Ferroelectr. Freq. Control. 2005;52:177–191. doi: 10.1109/tuffc.2005.1406545. [DOI] [PubMed] [Google Scholar]
- 19.Park J, Hu CH, Shung KK. Stand-alone front-end system for high frequency, high-frame-rate coded excitation ultrasonic imaging. IEEE Trans. Ultrason. Ferroelectr. Freq. Control. 2011;58:2620–2630. doi: 10.1109/TUFFC.2011.2125. [DOI] [PMC free article] [PubMed] [Google Scholar]
- 20.Poss KD, Wilson LG, Keating MT. Heart regeneration in zebrafish. Science. 2002;298:2188–2190. doi: 10.1126/science.1077857. [DOI] [PubMed] [Google Scholar]
- 21.Ramo MP, Spencer T, Kearney PP, Shaw STRD, Starkey IR, McDicken WN, Fox KAA. Characteristics of red and white thrombus by intravascular ultrasound using radiofrequency and videodensitometric data-based texture analysis. Ultrasound Med. Biol. 1997;23:1195–1199. doi: 10.1016/s0301-5629(97)00118-x. [DOI] [PubMed] [Google Scholar]
- 22.Song J, Kim S, Sohn H, Song T, Yoo YM. Coded excitation for ultrasound tissue harmonic imaging. Ultrasonics. 2010;50:613–619. doi: 10.1016/j.ultras.2010.01.001. [DOI] [PubMed] [Google Scholar]
- 23.Sun L, Xu X, Richard WD, Feng C, Johnson JA, Shung KK. A high-frame rate duplex ultrasound biomicroscopy for small animal imaging in vivo. IEEE Trans. Biomed. Eng. 2008;55:2039–2049. doi: 10.1109/TBME.2008.919110. [DOI] [PubMed] [Google Scholar]
- 24.Üstüner KF, Holley GL. Ultrasound imaging system performance assessment; Presented at the 2003 American Association of Physicists in Medicine Annual Meeting; San Diego, CA. August 2003. [Google Scholar]
Associated Data
This section collects any data citations, data availability statements, or supplementary materials included in this article.


