

Abstract
Rationale:
Obstructive sleep apnea (OSA) has been associated with metabolic dysregulation and systemic inflammation. This may be due to pathophysiologic effects of OSA on visceral adipose tissue. We sought to assess the transcriptional consequences of OSA on adipocytes by utilizing pathway-focused analyses.
Methods:
Patients scheduled to undergo ventral hernia repair surgery were recruited to wear a portable home sleep monitor for 2 nights prior to surgery. Visceral fat biopsies were obtained intraoperatively. RNA was extracted and whole-genome expression profiling was performed. Gene Set Enrichment Analysis (GSEA) was used to identify curated gene sets that were differentially enriched in OSA subjects. Network analysis was applied to a select set of highly enriched pathways.
Results:
Ten patients with OSA and 8 control subjects were recruited. There were no differences in age, gender, or body mass index between the 2 groups, but the OSA subjects had a significantly higher respiratory disturbance index (19.2 vs. 0.6, P = 0.05) and worse hypoxemia (minimum oxygen saturation 79.7% vs. 87.8%, P < 0.001). GSEA identified a number of gene sets up-regulated in adipose tissue of OSA patients, including the pro-inflammatory NF-κB pathway and the proteolytic ubiquitin/proteasome module. A critical metabolic pathway, the peroxisome proliferator-activated receptor (PPAR), was down-regulated in subjects with OSA. Network analysis linked members of these modules together and identified regulatory hubs.
Conclusions:
OSA is associated with alterations in visceral fat gene expression. Pathway-based network analysis highlighted perturbations in several key pathways whose coordinated interactions may contribute to the metabolic dysregulation observed in this complex disorder.
Citation:
Gharib SA; Hayes AL; Rosen MJ; Patel SR. A pathway-based analysis on the effects of obstructive sleep apnea in modulating visceral fat transcriptome. SLEEP 2013;36(1):23–30.
Keywords: Adipocyte, metabolism, microarray, network, sleep apnea
INTRODUCTION
Obstructive sleep apnea (OSA) is a common disorder characterized by recurrent episodes of pharyngeal obstruction during sleep and is associated with increased risk of mortality and morbidity.1,2 Excessive body mass is one of the strongest risk factors for sleep apnea and estimated to be responsible for up to 60% of its attributable risk.3 Furthermore, the presence of OSA can worsen obesity and aggravate obesity-related comorbidities such as hypertension,4 diabetes, and dyslipidemia.5 Circulating markers of insulin resistance, inflammation, and oxidative stress are elevated in OSA, and treatment improves these measures independent of weight change.6–10 The tissues affected by OSA in producing these systemic alterations are not known; but because many of the circulating mediators affected by OSA are produced by adipocytes and because of the known importance of adipose tissue in regulating inflammation and insulin resistance,11 it is highly likely that many of the systemic effects of OSA are due to changes in adipocyte biology. Adipose tissue is a major site of production of pro-inflammatory mediators and modulators of insulin resistance such as adiponectin.12,13 In addition, the regulatory role of adipose tissue on free fatty acid levels can importantly affect insulin resistance,14,15 with a recent study demonstrating that treatment of OSA improved glycated hemoglobin and lipid profiles.16 We hypothesized that an unbiased assessment of the transcriptional landscape of adipocytes harvested from visceral fat depots of subjects with OSA will provide novel insights into the molecular perturbations elicited by this complex disorder. Some of the results of these studies have been previously reported in the form of an abstract at the American Thoracic Society meeting. Some of the microarray data from this study were presented in a symposium.17
METHODS
Subjects
Patients scheduled to undergo ventral hernia repair surgery at University Hospitals Case Medical Center in Cleveland, Ohio were recruited. Patients with a previous diagnosis of sleep apnea, current use of supplemental oxygen therapy, or body mass index (BMI) < 20 kg/m2 were excluded. Study procedures were approved by our institutional review board, and informed consent was obtained from each subject.
Sleep Assessment
Subjects wore an ARES Unicorder (Watermark Medical, Boca Raton, FL), a portable sleep monitor, 2 consecutive nights prior to surgery. Respiratory events were defined as a ≥ 50% decrease in airflow ≥ 10 sec as assessed by nasal pressure, associated with a 3% decrease in oxygen saturation. The respiratory disturbance index (RDI) was calculated as the total number of respiratory events divided by total recording time in hours averaged over both nights of recording. Sleep apnea was defined as RDI ≥ 5 events per hour. The minimum oxygen saturation was the lowest oxygen saturation recorded across both nights. The ARES Unicorder system's RDI has been demonstrated to correlate strongly with in-laboratory polysomnographic-based apnea hypopnea index ([AHI] correlation = 0.88), having sensitivity, specificity, positive predictive value, and negative predictive value of 91.5%, 85.7%, 91.5%, and 85.7%, respectively.18
Statistical Analysis
For continuous variables such as demographic and polysomnographic parameters, differences between OSA and control subjects were assessed using a 2-tailed Student t-test. To compare categorical data such as disease prevalence between the 2 groups, the 2-tailed Fisher exact test was utilized.
Adipose Tissue Collection
Visceral fat biopsies were obtained intraoperatively from the omentum. Samples were rinsed with PBS to remove excess blood, minced, immediately frozen in liquid nitrogen, and stored at −80°C.
RNA Isolation
Total RNA was obtained using RNeasy Lipid Tissue Mini Kit with DNase treatment (Qiagen, Valencia, CA) according to the manufacturer's protocol. The integrity of purified total RNA samples was assessed qualitatively on an Agilent 2100 Bioanalyzer (Agilent Technologies, Santa Clara, CA).
Microarray Experiments
Samples were processed using sense target Genechip Human Gene 1.0 ST arrays (Affymetrix, Inc., Santa Clara, CA). The Genechip Human Gene 1.0 ST utilizes a whole-transcript assay to comprehensively cover the entire gene locus and is composed of 33,297 probe sets that map to 20,288 unique genes. For each sample, 100 ng of total RNA was labeled using Affymetrix GeneChip Whole Transcript (WT) Sense Target Labeling Assay, which included cRNA synthesis and generation of amplified and biotinylated sense-strand DNA targets, covering the entire expression genome. After hybridization and scanning, image acquisition was performed using the GeneChip Operating System (GCOS). Gene expression levels from probe intensities were estimated using a robust multiarray analysis (RMA) method with quantile normalization and background correction.19 Detailed microarray information, meeting Minimum Information About a Microarray Experiment (MIAME) requirements, has been deposited at Gene Expression Omnibus (https://www.ncbi.nlm.nih.gov/projects/geo; GSE38792).
Cluster Analysis
Unsupervised 2-dimensional hierarchical clustering was performed on 20,288 unique genes from 18 subjects (10 OSA, 8 control).20 Gene expression values across all subjects were normalized as follows:
 |
where for each gene, Gi is the expression level for subject I, Gmean is its average expression level across all subjects, and SD is the standard deviation. Pearson correlation was used as the distance metric to simultaneously cluster subjects (based on their global expression profile) and genes (based on expression levels across subjects).
Functional Analysis
Enriched pathways, based on transcriptional profiling of visceral adipose tissue from OSA and control subjects, were identified using Gene Set Enrichment Analysis (GSEA).21 Expression values for all 20,288 unique genes across all 18 subjects were used in the analysis. GSEA ranked the correlation of these genome-wide expression profiles with one of 2 phenotypes (OSA, control), and assessed the significance of overrepresentation of independently defined gene sets in these highly correlated or anti-correlated genes. To evaluate the degree of enrichment, GSEA calculated enrichment scores (ES) using a weighted Kolmogorov-Smirnov statistic. The significance of a gene set's ES was estimated by an empirical gene set-based permutation test procedure. GSEA normalizes the ES for each gene set to account for the differences in set sizes. Since the entire database of gene sets is scored, adjustments were made to the resulting P-values to account for multiple hypotheses testing using false discovery rate analysis (FDR). FDR was computed by comparing the tails of the observed and random permutation-computed null distributions of normalized ES (n = 2,000 permutations). For our analysis, gene sets were selected from well-established curated resources, including 186 pathways from Kyoto Encyclopedia of Genes and Genomes (KEGG)22 and 1,454 gene sets from Gene Ontology database.23 Enrichment of a gene set in either OSA or control subjects was deemed significant if it reached an FDR cutoff < 1%. In general, a gene set enriched in a given phenotype (OSA or control) was composed mostly of genes up-regulated in subjects from that group.
Network Analysis
Genes mapped to select, highly enriched gene sets were linked together based on published gene product interaction databases including Ingenuity24 and STRING.25 The interaction networks, or interactomes, were built around genes with the highest connectivity using an iterative algorithm that systematically connects additional nodes to the initial seed.
Quantitative RT-PCR (qPCR)
Expression of 2 genes (PPARγ, ADIPOQ) that were members of an enriched biological module was measured using qPCR. The following exon-spanning Taqman primer probes were purchased from Applied Biosystems (Foster City, CA): 1. Hs01115513_m1 (amplicon length 90 bp) for PPARγ; 2. Hs00605917_m1 (amplicon length 71 bp) for ADIPOQ. Isolated RNA was reverse-transcribed to cDNA with High Capacity RNA-to-cDNA kit (Applied Biosystems, Foster City, CA) according to the manufacturer's instructions. Briefly, one microgram of total RNA from each OSA and control group samples was used to generate cDNA templates for RT-PCR, and a TaqMan Master Mix Reagent Kit (Applied Biosystems, Foster City, CA) was used to amplify and quantify each transcript of interest in 25 μL reactions. Triplicate PCR reactions were performed in 96-well plates for each gene in parallel with the 18S rRNA. The steps involved in the reaction program included: the initial step of 2 min at 50°C; denaturation at 95°C for 10 min, followed by 40 thermal cycles of denaturation (15 s at 95°C) and elongation (1 min at 60°C). The 18S component of rRNA was used as the endogenous control and expression levels of the tested genes were normalized to its expression using the delta-delta approach.26 P-values for relative expression differences were calculated using a 2-tailed Student t-test with unequal variance.
RESULTS
Subject Demographics and Sleep Study Results
We recruited 18 subjects, 10 with OSA and 8 controls. As detailed in Table 1, the subjects were mostly female and obese, but there were no differences between the 2 groups in gender distribution, BMI, or age. Since all participants were undergoing surgical repair of large ventral hernias, waist circumference was not measured because it would not accurately reflect abdominal adiposity. Three of the OSA subjects reported a diagnosis of type 2 diabetes, two of whom were on anti-diabetic medications (Supplementary Table S1). There were no statistical differences in the prevalence of diabetes, coronary artery disease (CAD), hypertension, dyslipidemia, or chronic obstructive pulmonary disease (COPD) between the groups. As expected, the OSA patients had significantly higher RDI and more severe hypoxemia.
Table 1.
Subject demographics and polysomnographic parameters

Presence of OSA is associated with a distinct transcriptomic signature in the visceral fat of subjects with OSA.
Unsupervised 2-dimensional hierarchical clustering of expression profiles from over 22,000 unique genes segregated the majority of OSA patients from controls (Figure 1). In this analysis, we made no a priori designation of a subject's phenotype (OSA, control) when clustering individuals based on their visceral fat gene expression patterns. This observation implies that sleep apnea elicits genome-wide perturbations in the transcriptional response of adipocytes. Note that the discrimination between OSA and control individuals is not perfect, implying significant biological variability among subjects and relatively modest changes in global gene expression.
Figure 1.
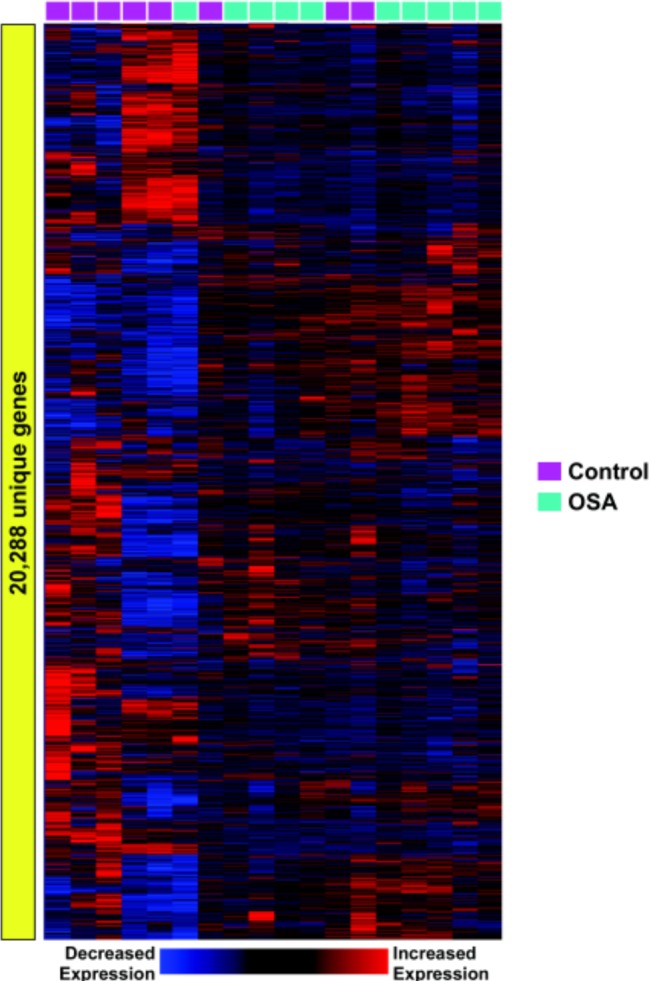
Visceral adipose tissue transcriptome in control and OSA subjects. An unbiased profiling of visceral fat cell gene expression in patients with and without OSA (labeled in green and purple respectively) identified 2 distinct patterns corresponding to the 2 phenotypes. However, note that 4 subjects were incorrectly classified using this unsupervised cluster analysis, implying interindividual variability.
Gene set enrichment analysis identifies overrepresented pathways in adipose tissue of OSA patients.
There is strong evidence that most cellular activities, such as those involved in metabolism, involve coordinated interactions among many gene products.27,28 Therefore, we chose a pathway-centric statistical approach known as GSEA to identify biologic modules activated in visceral adipocytes of subjects with OSA. To reduce spurious findings we: (1) focused on well-described canonical pathways as derived from the KEGG and GO; and (2) chose a restrictive false discovery rate cutoff < 1% for selecting enriched gene sets. Table 2 summarizes our results. Highly enriched modules in subjects with OSA included those involved in nuclear factor κB (NF-κB) and proteasome/ubiquitin pathways. The majority of the genes in these processes were up-regulated in OSA patients relative to the controls. A prominent pathway enriched in the control subjects was peroxisome proliferator-activated receptor (PPAR) signaling as well—with most member genes being down-regulated in OSA patients relative to the controls.
Table 2.
Enriched biologic pathways in visceral adipose tissue of OSA and control subjects

Network analysis reveals complex interactions among enriched pathways in OSA.
To further characterize the relationships among members enriched gene sets identified by GSEA (Table 2), we performed network analysis based on previously published gene product interaction information from the most comprehensive public and proprietary resources available.24,25 Figure 2A depicts the NF-κB signaling pathway centered on this transcription factor and is composed of nodes that were overwhelmingly up-regulated in the visceral fat tissue of OSA subjects (Figure 2B), implying the activation of this pro-inflammatory module in sleep apnea. In Figure 3, a similarly constructed network is shown for the PPAR signaling cascade; however, in this case, most of the genes were down-regulated in OSA, consistent with suppression of this key metabolic pathway. We confirmed reduced expression levels for 2 members of this module, adiponectin (ADIPOQ) and peroxisome proliferator-activated receptor gamma (PPARγ) using qPCR (Figure 4). Processes involved in ubiquitin and proteasome activity were highly enriched in visceral fat cells of OSA patients as displayed in Figure 5. The topology of this complex network is characterized by subgroups of highly interconnected nodes known as motifs (or cliques) that map to functionally coherent processes (e.g., proteasome activity). Furthermore, critical regulators of NF-κB and PPAR signaling modules (e.g., NF-κB and PPARγ) were intricately connected to this network (Figure 5), confirming inter-modular links among the enriched pathways.
Figure 2.

(A) Gene product interaction network of the NF-κB signaling pathway identified as being enriched in OSA subjects by GSEA. Members of this pro-inflammatory network are linked together based on previously published molecular interactions. Note the central role assumed by the densely connected hub, NF-κB, a critical transcriptional regulator of inflammation. (B) Heatmap of expression patterns of network nodes depicting the up-regulation of these genes in visceral adipose tissue of OSA patients.
Figure 3.

(A) Gene product interaction network of the PPAR metabolic pathway identified as being enriched in the controls compared to patients with OSA. Note the highly interconnected hubs including several PPARs and RXRs that are known master regulators of metabolism. Adiponectin (ADIPOQ) is also highlighted in this network. (B) Heatmap of expression patterns of network nodes depicting the down-regulation of these genes in visceral adipose tissue of OSA patients.
Figure 4.

Quantitative RT-PCR confirmation of 2 down-regulated members of the PPAR network. (A) ADIPOQ expression. (B) PPARγ expression. P-values were calculated using a 2-tailed Student t-test with unequal variance.
Figure 5.
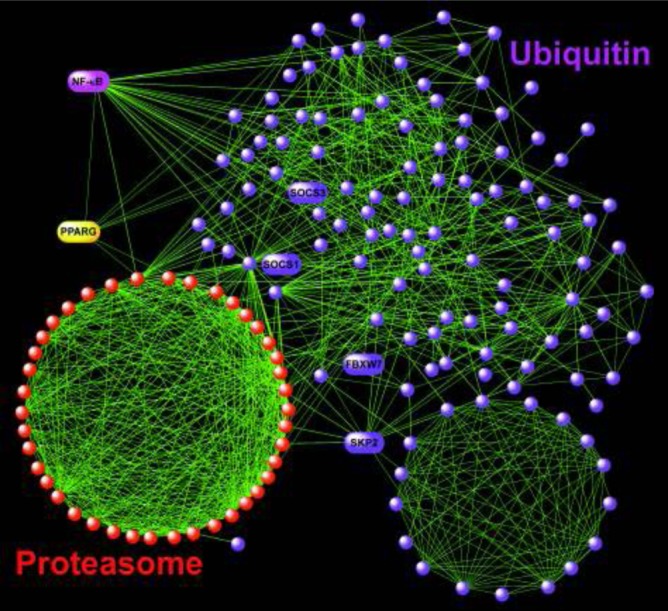
Gene product interactome of the enriched proteasome and ubiquitin pathways. This network was characterized by functionally coherent motifs, such as the proteasome clique. Several other nodes of potential interest in adipocyte biology are labeled (see Discussion). Note that this complex network was highly interlinked with the NF-κB and PPAR modules as represented by their key hubs, suggesting functional coordination among these pathways.
DISCUSSION
OSA is a complex disorder associated with an increased risk of mortality,2 development of hypertension,4 coronary artery disease,29 stroke,30 and metabolic dysfunction.5,31 Since adipose tissue is a critical regulator of metabolism, we postulated that sleep disordered breathing perturbs distinct functional pathways in visceral fat cells. Using an unbiased approach based on genome-wide transcriptional profiling, we found that OSA elicits modest yet global changes in adipocyte gene expression. We implemented a pathway-centric methodology to identify specific biological modules altered in patients with OSA and fine-mapped their components using network analysis.
Pathways enriched in visceral adipose tissue of OSA subjects included those involved in inflammation, metabolism, and ubiquitin/proteasome. Identification of these biologic networks provides new insights into the complex pathophysiology of obstructive sleep apnea. Pro-inflammatory pathways were highlighted by the nuclear factor κB (NF-κB) signaling module—a master regulator of cellular responses to stress.32 There is mounting evidence that obesity represents an inflammatory condition mediated, in part, by activation of the NF-κB cascade in adipocytes.33,34 Previous studies have reported that OSA is associated with elevated levels of circulating pro-inflammatory mediators, many of which are regulated by NF-κB.35,36 Our findings highlight, for the first time, a role for NF-κB signaling in visceral adipose tissue as an important molecular link between sleep apnea, obesity, and inflammation. Targeting the NF-κB pathway may represent a novel approach in ameliorating the metabolic dysregulation associated with OSA—a premise supported by recent clinical trials reporting improvement of glucose homeostasis in subjects with type 2 diabetes treated with salicylates,37 which are known inhibitors of NF-κB activation.38
We identified a number of metabolic pathways, including the peroxisome proliferator-activated receptor (PPAR) signaling cascade as highly enriched modules. The PPAR family is a key orchestrator of cellular metabolism. Interestingly, most members of the PPAR module were down-regulated in patients with OSA, including the expressions of PPARγ and adiponectin (ADIPOQ), which were confirmed with qPCR (Figures 3 and 4). Previous studies have reported that obesity39 and dysregulated metabolism (e.g., hepatic steatosis,40 insulin resistance,41 type 2 diabetes,42 dyslipidemia43) are associated with reduced levels of these genes. Our results are consistent with the above reports, but importantly, extend these observations to patients with OSA. Since there was no difference between the BMI of OSA subjects and controls in this study (Table 1), our findings imply that OSA, independent of excessive body mass, influences pathways known to be perturbed in metabolic disorders. Targeted activation of several densely connected hubs in this network (PPARγ, PPARα) by specific ligands (thiazolidinediones, fibrates) is used in the treatment of type 2 diabetes and dyslipidemia, and may represent a therapeutic strategy for managing OSA-induced metabolic dysfunction.
Unexpectedly, the ubiquitin-proteasome module was among the most enriched pathways in our study, with the majority of its members being up-regulated in visceral fat tissue of patients with OSA (Figure 5). The ubiquitin-proteasome system is a highly conserved, fundamental mechanism for regulating protein degradation in cells and is essential for many processes including cell cycle, apoptosis, and responses to inflammatory and oxidative stresses.44 An emerging role for activation of the ubiquitin-proteasome machinery in obesity and metabolic syndromes is being recognized.45 Recent studies have implicated this pathway in degrading critical components of the PPAR signaling module including retinoid X receptor α (RXRA, see Figure 3) and modulating the PPARγ-directed transcriptional network in visceral adipose tissue of obese mice and humans.46 Members of the ubiquitin-proteosome module have been shown to regulate adipocyte differentiation (via F-box and WD repeat domain containing 7, FBXW7)47 and block insulin signaling and induce fasting hyperglycemia (via suppressor of cytokine signaling 1, SOCS1, and suppressor of cytokine signaling 3, SOCS3) in mice (Figure 5).48 Up-regulation of another node in this network, SKP2 (S-phase kinase-associated protein 2) in visceral fat cells promoted adipocyte proliferation and insulin resistance in mice, whereas targeted deletion of this gene protected the animals from high fat diet-induced obesity.49 Our study is the first report detailing activation of the ubiquitin-proteasome network in visceral fat tissue of OSA patients. Since this pathway is a high-priority target for pharmacologic therapeutics,50,51 our findings suggest a potentially novel application for such interventions in treating metabolic disturbances associated with sleep apnea.
We have recently reported on the transcriptional effects of intermittent hypoxia52 (IH) and sleep fragmentation53 (SF) in visceral adipose tissue of mice. Despite the obvious limitations in capturing the pathophysiologic complexity of OSA in humans by employing animal models that expose lean mice to IH or SF, we noted significant overlaps among enriched processes across these studies. Most prominently, the present study in obese human subjects and the animal models (IH, SF) identified profound perturbations in metabolic pathways of visceral adipocytes. Future research is needed to assess the clinical relevance of animal findings to human OSA, and importantly, the effects of targeting candidate pathways discovered from human studies using animal models of sleep apnea.
Collectively, our results demonstrate that the presence of OSA is associated with distinct alterations in the transcriptional circuitry of visceral fat cells—with activation of the pro-inflammatory NF-κB pathway and proteolytic ubiquitin-proteasome system, and concomitant suppression of the metabolically important PPAR signaling network. It is important to note that these enriched biological modules do not operate in isolation, but form coordinated functional units characterized by densely connected hubs (e.g., NF-κB, PPARγ) that facilitate robust inter-modular interactions (Figure 5).27,46,54 Further work is required to elucidate mechanisms and consequences of OSA-induced perturbations in regulatory networks of adipocytes.
Our study has a number of limitations. First, the sample size was modest and our findings need to be confirmed in larger cohorts. Furthermore, most of the subjects were women; therefore, our results may not be generalizable to men. In addition, three OSA subjects were being treated for diabetes—a potential confounder affecting gene expression. Although the ARES Unicorder sleep monitor has been validated,18 portable monitoring devices may not be sensitive in capturing subtle OSA or other forms of sleep disordered breathing such as hypoventilation. We limited our investigation to visceral fat tissue depots, whereas OSA has system-wide effects—including in metabolically active organs such as the liver. Importantly, non-adipocyte cells such as adipose tissue resident macrophages likely contributed to the gene expression profiles measured in this study, and may be responsible for activation of pro-inflammatory pathways. Since we only measured gene expression, protein levels of candidates or circulating markers of metabolism were not assessed. Subsequent studies will be required to investigate the pathophysiologic roles played by these network hubs in regulating metabolic parameters. Finally, our computational approach was based on the current state of knowledge—future iterations of the same data may yield different results.
In conclusion, we report on the first study in humans to systematically interrogate the effects of sleep apnea on visceral fat gene expression. We identified several pathways intricately involved in the regulation of adipocyte metabolism and inflammation that may be important modulators of metabolic disturbances associated with OSA.
DISCLOSURE STATEMENT
This was not an industry supported study. Dr. Patel has received research funding from Philips Respironics, a manufacturer of an OSA therapy, and in addition, has received income doing consulting on research topics for SleepHealth Centers, a for-profit company that evaluates and treats sleep disorders. The other authors have indicated no financial conflicts of interest.
ACKNOWLEDGMENTS
This work was supported by NIH HL081385 (SRP), CA116867 (SRP), NIH UL1RR025014 Institute of Translational Health Sciences and Center for Research on the Management of Sleep Disorders award (SAG) and an unrestricted ResMed Foundation Clinical Research Grant (SAG).
SUPPLEMENTAL MATERIAL
REFERENCES
- 1.Punjabi NM. The epidemiology of adult obstructive sleep apnea. Proc Am Thorac Soc. 2008;5:136–43. doi: 10.1513/pats.200709-155MG. [DOI] [PMC free article] [PubMed] [Google Scholar]
- 2.Punjabi NM, Caffo BS, Goodwin JL, et al. Sleep-disordered breathing and mortality: a prospective cohort study. PLoS Med. 2009;6:e1000132. doi: 10.1371/journal.pmed.1000132. [DOI] [PMC free article] [PubMed] [Google Scholar]
- 3.Young T, Peppard PE, Taheri S. Excess weight and sleep-disordered breathing. J Appl Physiol. 2005;99:1592–9. doi: 10.1152/japplphysiol.00587.2005. [DOI] [PubMed] [Google Scholar]
- 4.Peppard PE, Young T, Palta M, Skatrud J. Prospective study of the association between sleep-disordered breathing and hypertension. N Engl J Med. 2000;342:1378–84. doi: 10.1056/NEJM200005113421901. [DOI] [PubMed] [Google Scholar]
- 5.Punjabi NM, Sorkin JD, Katzel LI, Goldberg AP, Schwartz AR, Smith PL. Sleep-disordered breathing and insulin resistance in middle-aged and overweight men. Am J Respir Crit Care Med. 2002;165:677–82. doi: 10.1164/ajrccm.165.5.2104087. [DOI] [PubMed] [Google Scholar]
- 6.Ip MS, Lam KS, Ho C, Tsang KW, Lam W. Serum leptin and vascular risk factors in obstructive sleep apnea. Chest. 2000;118:580–6. doi: 10.1378/chest.118.3.580. [DOI] [PubMed] [Google Scholar]
- 7.Vgontzas AN, Papanicolaou DA, Bixler EO, et al. Sleep apnea and daytime sleepiness and fatigue: relation to visceral obesity, insulin resistance, and hypercytokinemia. J Clin Endocrinol Metab. 2000;85:1151–8. doi: 10.1210/jcem.85.3.6484. [DOI] [PubMed] [Google Scholar]
- 8.Phillips BG, Kato M, Narkiewicz K, Choe I, Somers VK. Increases in leptin levels, sympathetic drive, and weight gain in obstructive sleep apnea. Am J Physiol Heart Circ Physiol. 2000;279:H234–7. doi: 10.1152/ajpheart.2000.279.1.H234. [DOI] [PubMed] [Google Scholar]
- 9.Harsch IA, Schahin SP, Radespiel-Troger M, et al. Continuous positive airway pressure treatment rapidly improves insulin sensitivity in patients with obstructive sleep apnea syndrome. Am J Respir Crit Care Med. 2004;169:156–62. doi: 10.1164/rccm.200302-206OC. [DOI] [PubMed] [Google Scholar]
- 10.Yokoe T, Minoguchi K, Matsuo H, et al. Elevated levels of C-reactive protein and interleukin-6 in patients with obstructive sleep apnea syndrome are decreased by nasal continuous positive airway pressure. Circulation. 2003;107:1129–34. doi: 10.1161/01.cir.0000052627.99976.18. [DOI] [PubMed] [Google Scholar]
- 11.Tilg H, Moschen AR. Adipocytokines: mediators linking adipose tissue, inflammation and immunity. Nat Rev Immunol. 2006;6:772–83. doi: 10.1038/nri1937. [DOI] [PubMed] [Google Scholar]
- 12.Hotamisligil GS, Shargill NS, Spiegelman BM. Adipose expression of tumor necrosis factor-alpha: direct role in obesity-linked insulin resistance. Science. 1993;259:87–91. doi: 10.1126/science.7678183. [DOI] [PubMed] [Google Scholar]
- 13.Hu E, Liang P, Spiegelman BM. AdipoQ is a novel adipose-specific gene dysregulated in obesity. J Biol Chem. 1996;271:10697–703. doi: 10.1074/jbc.271.18.10697. [DOI] [PubMed] [Google Scholar]
- 14.Randle PJ, Garland PB, Hales CN, Newsholme EA. The glucose fatty-acid cycle. Its role in insulin sensitivity and the metabolic disturbances of diabetes mellitus. Lancet. 1963;1:785–9. doi: 10.1016/s0140-6736(63)91500-9. [DOI] [PubMed] [Google Scholar]
- 15.Ferrannini E, Barrett EJ, Bevilacqua S, DeFronzo RA. Effect of fatty acids on glucose production and utilization in man. J Clin Invest. 1983;72:1737–47. doi: 10.1172/JCI111133. [DOI] [PMC free article] [PubMed] [Google Scholar]
- 16.Sharma SK, Agrawal S, Damodaran D, et al. CPAP for the metabolic syndrome in patients with obstructive sleep apnea. N Engl J Med. 2011;365:2277–86. doi: 10.1056/NEJMoa1103944. [DOI] [PubMed] [Google Scholar]
- 17.Liu Y, Patel S, Nibbe R, et al. Systems biology analyses of gene expression and genome wide association study data in obstructive sleep apnea. Pac Symp Biocomput. :14–25. doi: 10.1142/9789814335058_0003. [DOI] [PMC free article] [PubMed] [Google Scholar]
- 18.Westbrook PR, Levendowski DJ, Cvetinovic M, et al. Description and validation of the apnea risk evaluation system: a novel method to diagnose sleep apnea-hypopnea in the home. Chest. 2005;128:2166–75. doi: 10.1378/chest.128.4.2166. [DOI] [PubMed] [Google Scholar]
- 19.Bolstad BM, Irizarry RA, Astrand M, Speed TP. A comparison of normalization methods for high density oligonucleotide array data based on variance and bias. Bioinformatics. 2003;19:185–93. doi: 10.1093/bioinformatics/19.2.185. [DOI] [PubMed] [Google Scholar]
- 20.Saeed AI, Sharov V, White J, et al. TM4: a free, open-source system for microarray data management and analysis. Biotechniques. 2003;34:374–8. doi: 10.2144/03342mt01. [DOI] [PubMed] [Google Scholar]
- 21.Subramanian A, Tamayo P, Mootha VK, et al. Gene set enrichment analysis: a knowledge-based approach for interpreting genome-wide expression profiles. Proc Natl Acad Sci U S A. 2005;102:15545–50. doi: 10.1073/pnas.0506580102. [DOI] [PMC free article] [PubMed] [Google Scholar]
- 22.Kanehisa M, Goto S, Furumichi M, Tanabe M, Hirakawa M. KEGG for representation and analysis of molecular networks involving diseases and drugs. Nucleic Acids Res. 2010;38(Database issue):D355–60. doi: 10.1093/nar/gkp896. [DOI] [PMC free article] [PubMed] [Google Scholar]
- 23.Ashburner M, Ball CA, Blake JA, et al. Gene ontology: tool for the unification of biology. The Gene Ontology Consortium. Nat Genet. 2000;25:25–9. doi: 10.1038/75556. [DOI] [PMC free article] [PubMed] [Google Scholar]
- 24.Calvano SE, Xiao W, Richards DR, et al. A network-based analysis of systemic inflammation in humans. Nature. 2005;437:1032–7. doi: 10.1038/nature03985. [DOI] [PubMed] [Google Scholar]
- 25.Jensen LJ, Kuhn M, Stark M, et al. STRING 8—a global view on proteins and their functional interactions in 630 organisms. Nucleic Acids Res. 2009;37(Database issue):D412–6. doi: 10.1093/nar/gkn760. [DOI] [PMC free article] [PubMed] [Google Scholar]
- 26.Schmittgen TD, Livak KJ. Analyzing real-time PCR data by the comparative C(T) method. Nat Protoc. 2008;3:1101–8. doi: 10.1038/nprot.2008.73. [DOI] [PubMed] [Google Scholar]
- 27.Hartwell LH, Hopfield JJ, Leibler S, Murray AW. From molecular to modular cell biology. Nature. 1999;402(6761 Suppl):C47–52. doi: 10.1038/35011540. [DOI] [PubMed] [Google Scholar]
- 28.Vidal M, Cusick ME, Barabasi AL. Interactome networks and human disease. Cell. 2011;144:986–98. doi: 10.1016/j.cell.2011.02.016. [DOI] [PMC free article] [PubMed] [Google Scholar]
- 29.Gottlieb DJ, Yenokyan G, Newman AB, et al. Prospective study of obstructive sleep apnea and incident coronary heart disease and heart failure: the sleep heart health study. Circulation. 2010;122:352–60. doi: 10.1161/CIRCULATIONAHA.109.901801. [DOI] [PMC free article] [PubMed] [Google Scholar]
- 30.Redline S, Yenokyan G, Gottlieb DJ, et al. Obstructive sleep apnea-hypopnea and incident stroke: the sleep heart health study. Am J Respir Crit Care Med. 2010;182:269–77. doi: 10.1164/rccm.200911-1746OC. [DOI] [PMC free article] [PubMed] [Google Scholar]
- 31.Botros N, Concato J, Mohsenin V, Selim B, Doctor K, Yaggi HK. Obstructive sleep apnea as a risk factor for type 2 diabetes. Am J Med. 2009;122:1122–7. doi: 10.1016/j.amjmed.2009.04.026. [DOI] [PMC free article] [PubMed] [Google Scholar]
- 32.Hoffmann A, Natoli G, Ghosh G. Transcriptional regulation via the NF-kappaB signaling module. Oncogene. 2006;25:6706–16. doi: 10.1038/sj.onc.1209933. [DOI] [PubMed] [Google Scholar]
- 33.Lumeng CN, Saltiel AR. Inflammatory links between obesity and metabolic disease. J Clin Invest. 2011;121:2111–7. doi: 10.1172/JCI57132. [DOI] [PMC free article] [PubMed] [Google Scholar]
- 34.Baker RG, Hayden MS, Ghosh S. NF-kappaB, inflammation, and metabolic disease. Cell Metab. 2011;13:11–22. doi: 10.1016/j.cmet.2010.12.008. [DOI] [PMC free article] [PubMed] [Google Scholar]
- 35.Htoo AK, Greenberg H, Tongia S, et al. Activation of nuclear factor kappaB in obstructive sleep apnea: a pathway leading to systemic inflammation. Sleep Breath. 2006;10:43–50. doi: 10.1007/s11325-005-0046-6. [DOI] [PubMed] [Google Scholar]
- 36.Ryan S, Taylor CT, McNicholas WT. Selective activation of inflammatory pathways by intermittent hypoxia in obstructive sleep apnea syndrome. Circulation. 2005;112:2660–7. doi: 10.1161/CIRCULATIONAHA.105.556746. [DOI] [PubMed] [Google Scholar]
- 37.Goldfine AB, Fonseca V, Jablonski KA, Pyle L, Staten MA, Shoelson SE. The effects of salsalate on glycemic control in patients with type 2 diabetes: a randomized trial. Ann Intern Med. 2010;152:346–57. doi: 10.1059/0003-4819-152-6-201003160-00004. [DOI] [PMC free article] [PubMed] [Google Scholar]
- 38.Kopp E, Ghosh S. Inhibition of NF-kappa B by sodium salicylate and aspirin. Science. 1994;265:956–9. doi: 10.1126/science.8052854. [DOI] [PubMed] [Google Scholar]
- 39.Lihn AS, Bruun JM, He G, Pedersen SB, Jensen PF, Richelsen B. Lower expression of adiponectin mRNA in visceral adipose tissue in lean and obese subjects. Mol Cell Endocrinol. 2004;219:9–15. doi: 10.1016/j.mce.2004.03.002. [DOI] [PubMed] [Google Scholar]
- 40.Kursawe R, Narayan D, Cali AM, et al. Downregulation of ADIPOQ and PPARgamma2 gene expression in subcutaneous adipose tissue of obese adolescents with hepatic steatosis. Obesity (Silver Spring) 2010;18:1911–7. doi: 10.1038/oby.2010.23. [DOI] [PMC free article] [PubMed] [Google Scholar]
- 41.Weyer C, Funahashi T, Tanaka S, et al. Hypoadiponectinemia in obesity and type 2 diabetes: close association with insulin resistance and hyperinsulinemia. J Clin Endocrinol Metab. 2001;86:1930–5. doi: 10.1210/jcem.86.5.7463. [DOI] [PubMed] [Google Scholar]
- 42.Hotta K, Funahashi T, Arita Y, et al. Plasma concentrations of a novel, adipose-specific protein, adiponectin, in type 2 diabetic patients. Arterioscler Thromb Vasc Biol. 2000;20:1595–9. doi: 10.1161/01.atv.20.6.1595. [DOI] [PubMed] [Google Scholar]
- 43.Matsubara M, Maruoka S, Katayose S. Decreased plasma adiponectin concentrations in women with dyslipidemia. J Clin Endocrinol Metab. 2002;87:2764–9. doi: 10.1210/jcem.87.6.8550. [DOI] [PubMed] [Google Scholar]
- 44.Finley D. Recognition and processing of ubiquitin-protein conjugates by the proteasome. Annu Rev Biochem. 2009;78:477–513. doi: 10.1146/annurev.biochem.78.081507.101607. [DOI] [PMC free article] [PubMed] [Google Scholar]
- 45.Wing SS. The UPS in diabetes and obesity. BMC biochemistry. 2008;9(Suppl 1):S6. doi: 10.1186/1471-2091-9-S1-S6. [DOI] [PMC free article] [PubMed] [Google Scholar]
- 46.Lefebvre B, Benomar Y, Guedin A, et al. Proteasomal degradation of retinoid X receptor alpha reprograms transcriptional activity of PPARgamma in obese mice and humans. J Clin Invest. 2010;120:1454–68. doi: 10.1172/JCI38606. [DOI] [PMC free article] [PubMed] [Google Scholar]
- 47.Bengoechea-Alonso MT, Ericsson J. The ubiquitin ligase Fbxw7 controls adipocyte differentiation by targeting C/EBPalpha for degradation. Proc Natl Acad Sci U S A. 2010;107:11817–22. doi: 10.1073/pnas.0913367107. [DOI] [PMC free article] [PubMed] [Google Scholar]
- 48.Rui L, Yuan M, Frantz D, Shoelson S, White MF. SOCS-1 and SOCS-3 block insulin signaling by ubiquitin-mediated degradation of IRS1 and IRS2. J Biol Chem. 2002;277:42394–8. doi: 10.1074/jbc.C200444200. [DOI] [PubMed] [Google Scholar]
- 49.Sakai T, Sakaue H, Nakamura T, et al. Skp2 controls adipocyte proliferation during the development of obesity. J Biol Chem. 2007;282:2038–46. doi: 10.1074/jbc.M608144200. [DOI] [PubMed] [Google Scholar]
- 50.Hoeller D, Dikic I. Targeting the ubiquitin system in cancer therapy. Nature. 2009;458:438–44. doi: 10.1038/nature07960. [DOI] [PubMed] [Google Scholar]
- 51.Ernst R, Claessen JH, Mueller B, et al. Enzymatic blockade of the ubiquitin-proteasome pathway. PLoS Biol. 2011;8:e1000605. doi: 10.1371/journal.pbio.1000605. [DOI] [PMC free article] [PubMed] [Google Scholar]
- 52.Gharib SA, Khalyfa A, Abdelkarim A, et al. Intermittent hypoxia activates temporally coordinated transcriptional programs in visceral adipose tissue. J Mol Med (Berl) 2012;90:435–45. doi: 10.1007/s00109-011-0830-7. [DOI] [PubMed] [Google Scholar]
- 53.Gharib SA, Khalyfa A, Abdelkarim A, Bhushan B, Gozal D. Integrative miRNA-mRNA profiling of adipose tissue unravels transcriptional circuits induced by sleep fragmentation. PLoS One. 2012;7:e37669. doi: 10.1371/journal.pone.0037669. [DOI] [PMC free article] [PubMed] [Google Scholar]
- 54.Chen ZJ. Ubiquitin signalling in the NF-kappaB pathway. Nat Cell Biol. 2005;7:758–65. doi: 10.1038/ncb0805-758. [DOI] [PMC free article] [PubMed] [Google Scholar]
Associated Data
This section collects any data citations, data availability statements, or supplementary materials included in this article.