

Abstract
Study Objectives:
Obstructive sleep apnea (OSA) is often observed in patients with metabolic syndrome (MetS). In addition, the association of MetS and OSA substantially increases sympathetic nerve activity. However, the mechanisms involved in sympathetic hyperactivation in patients with MetS + OSA remain to be clarified. We tested the hypothesis that chemoreflex sensitivity is heightened in patients with MetS and OSA.
Design:
Prospective clinical study.
Participants:
Forty-six patients in whom MetS was newly diagnosed (ATP-III) were allocated into: (1) MetS + OSA (n = 24, 48 ± 1.8 yr); and (2) MetS – OSA (n = 22, 44 ± 1.7 yr). Eleven normal control subjects were also studied (C, 47 ± 2.3 yr).
Measurements:
OSA was defined as an apnea-hypopnea index ≥ 15 events/hr (polysomnography). Muscle sympathetic nerve activity (MSNA) was measured by microneurography technique. Peripheral chemoreflex sensitivity was assessed by inhalation of 10% oxygen and 90% nitrogen (carbon dioxide titrated), and central chemoreflex sensitivity by 7% carbon dioxide and 93% oxygen.
Results:
Physical characteristics and MetS measures were similar between MetS + OSA and MetS – OSA. MSNA was higher in MetS + OSA patients compared with MetS – OSA and C (33 ± 1.3 versus 28 ± 1.2 and 18 ± 2.2 bursts/min, P < 0.05). Isocapnic hypoxia caused a greater increase in MSNA in MetS + OSA than MetS – OSA and C (P = 0.03). MSNA in response to hyperoxic hypercapnia was greater in MetS + OSA compared with C (P = 0.005). Further analysis showed a significant association between baseline MSNA and peripheral (P < 0.01) and central (P < 0.01) chemoreflex sensitivity. Min ventilation in response to hyperoxic hypercapnia was greater in MetS + OSA compared with C (P = 0.001).
Conclusion:
OSA increases sympathetic peripheral and central chemoreflex response in patients with MetS, which seems to explain, at least in part, the increase in sympathetic nerve activity in these patients. In addition, OSA increases ventilatory central chemoreflex response in patients with MetS.
Citation:
Trombetta IC; Maki-Nunes C; Toschi-Dias E; Alves MJNN; Rondon MUPB; Cepeda FX; Drager LF; Braga AMFW; Lorenzi-Filho G; Negrao CE. Obstructive sleep apnea is associated with increased chemoreflex sensitivity in patients with metabolic syndrome. SLEEP 2013;36(1):41-49.
Keywords: Autonomic control, cardiovascular risk factors, sleep disordered breathing, sympathetic activation
INTRODUCTION
Obstructive sleep apnea (OSA) is a condition commonly present in patients with metabolic syndrome (MetS).1 Recent findings show that more than 60% of patients with MetS also experience OSA.2,3 Observational studies provide information that OSA and MetS exhibit similar pathophysiologic substrates for cardiovascular disease. Increased blood pressure is a common consequence of OSA and MetS.3–6 This knowledge raises another problematic issue. Both MetS and OSA may have an additive effect on cardiovascular risk.
OSA is characterized by repetitive inspiratory obstruction of the upper airway during sleep. This sleep disorder causes recurrent hypoxia, hypercapnia, and sleep fragmentation,7 which may have several implications. Patients with OSA have excessive daytime sleepiness. Of course, this physiologic behavior has an effect on the quality of life of patients with sleep disorder. One important pathophysiologic mechanism in patients with OSA is a well-established elevated sympathetic nerve activity that occurs not only during sleeping, but also during awake periods.8,9 Increased sympathetic outflow is a marker of poor prognosis in humans.10
Despite convincing evidence that OSA exacerbates sympathetic outflow in patients with MetS,3,6 the mechanisms underlying this autonomic dysfunction are not completely understood. Because muscle sympathetic nerve activity (MSNA) varies inversely with lung volume,11 one possibility is the reflexive inhibition of central sympathetic discharge from the pulmonary stretch receptors during apnea, contributing to the increased sympathetic outflow in patients with OSA. The inverse association between MSNA and baroreflex sensitivity recently reported suggests that the arterial baroreflex control is involved in the increased sympathetic nerve activity in patients with MetS and OSA.3 However, the sympathetic hyperactivation associated with MetS and OSA is a complex issue and may surpass arterial baroreflex control. In this study, we investigated whether the chemoreceptor control contributes to the increased MSNA in patients with MetS and OSA. Our suspicion was based on the fact that hypoxia and hypercapnia during sleep apnea are substrates for stimulation of peripheral and central chemoreceptors. Thus, it is reasonable to expect that the chemoreflex sensitivity is upregulated in patients with MetS and OSA and, hence, contributes to the increased sympathetic outflow. Because the chemoreceptors are the primary controller of ventilation during sleep, we raised a second question. Would the peripheral and central chemoreflex control of ventilation be also altered in patients with MetS and OSA? Finally, we investigated whether there was an association between both sympathetic nerve activity and pulmonary ventilation with chemoreflex sensitivity in patients with MetS and OSA.
Our hypotheses were that: (1) patients with MetS and OSA would have greater peripheral and central chemoreflex sensitivities compared with patients with MetS without OSA and healthy individuals and (2) there is an association between sympathetic nerve activity and pulmonary ventilation with chemoreflex sensitivity in patients with MetS and OSA.
METHODS
Study Population
Consecutive outpatients from the Unit of Cardiac Rehabilitation and Exercise Physiology of the Heart Institute (InCor), University of S̃ao Paulo Medical School, were invited to participate in the study. They subsequently were submitted to measurement of blood pressure, clinical/physical examination, and blood tests to determine if they fulfilled the requirements to take part in the study. Blood samples were collected from venous blood after 12 hours of overnight fasting to determine total serum cholesterol, triglycerides, high-density lipoprotein (HDL) cholesterol (enzymatic method), and plasma glucose (standard glucose oxidase method) concentrations. The patients in whom MetS was diagnosed were selected to participate in the study. Those patients who agreed to participate in the study underwent a nocturnal polysomnography. Finally, they were submitted to the chemoreflex study. These studies were conducted a week a part.
Patients were enrolled if they had at least three of the five diagnostic criteria for MetS, as proposed by the Adult Treatment Panel III Report12: (1) waist circumference ≥ 102 cm in men and ≥ 88 cm in women; (2) fasting triglyceride level ≥ 150 mg/dL (1.7 mmol/L); (3) HDL cholesterol < 40 mg/dL (1.03 mmol/L) in men and < 50 mg/dL (1.3 mmol/L) in women; (4) blood pressure (BP) ≥ 130/85 mm Hg; and (5) fasting glucose level ≥ 100 mg/dL (≥ 6.1 mmol/L). In addition, the enrolled patients were taking no medications, were sedentary, were nonsmokers, had no history of excessive alcohol consumption, and had no evidence of overt cardiovascular disease at the time of the study. All women who still have a menstrual cycle were studied between the first and the fifth day after the onset of menstruation. The study was approved by the Scientific Commission of the Heart Institute (InCor) and by the Ethics in Research Commission of the Clinical Hospital at the University of S̃ao Paulo (#1222/05), and written consent was given by each participant.
Procedures and Measures
All studies were performed in the morning (7:00-9:00), after a light, caffeine-free breakfast, with the patients lying supine in a quiet, air-conditioned room (22°C). The patient’s leg was positioned for microneurography, and a microelectrode was placed in the peroneal nerve. After instrumentation and a rest period of 15 min, heart rate (HR), BP, MSNA, min ventilation (VE), oxygen saturation, end-tidal carbon dioxide, and respiratory rate (RR) were recorded for 3 min at baseline followed by 3 min of exposure to isocapnic hypoxia and hyperoxic hypercapnia to assess peripheral and central chemoreflex controls, respectively13,14 (Figure 1). Baseline values represent the average of the entire 3-min period prior to hypoxia/hypercapnia administration. During each min of exposure to isocapnic hypoxia or hyperoxic hypercapnia, the last three measures of HR, oxygen saturation, and end-tidal carbon dioxide values were averaged. BP was recorded on a per-min basis. MSNA indicates the number of bursts during the entire min period. VE indicates the integration of all tidal volume areas during the entire min period. RR indicates the number of breaths during the entire min period.
Figure 1.
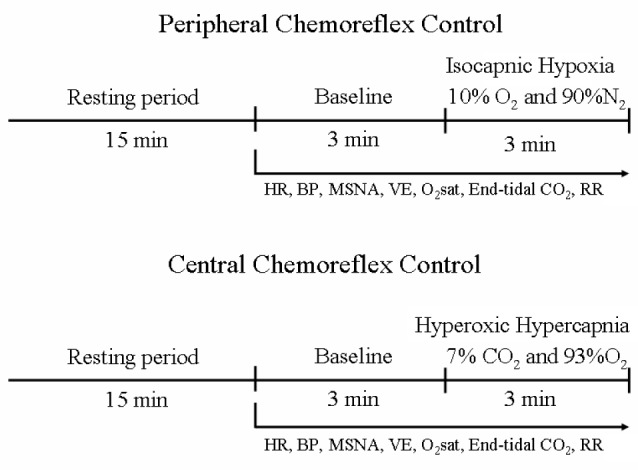
Timeline of experimental protocols for evaluation of peripheral and central chemoreflex controls. BP, blood pressure; end-tidal CO2, carbon dioxide exhaled; HR, heart rate; MSNA, muscle sympathetic nerve activity; O2Sat, oxygen saturation; RR, respiratory rate; VE, min ventilation.
At least 15 min were given between each gas mixture exposures to allow a return to basal conditions.
Sleep Study
Overnight polysomnography was performed using an EMBLA digital system (17 channels, EMBLA, Flaga hf. Medical Devices, Reykjavik, Iceland). The apnea-hypopnea index (AHI) was calculated as the total number of respiratory events (apneas plus hypopneas) per hour of sleep. OSA was defined by an AHI ≥ 15 events/hr by polysomnography, as previously described.15,16 Apnea was defined as a decrease in the peak thermal oronasal sensor excursion by ≥ 90% of baseline for at least 10 sec. Hypopnea was defined as a drop by ≥ 50% of baseline in the amplitude of the nasal pressure signal excursions for at least 10 sec, accompanied by ≥ 3% oxygen desaturation from pre-event baseline or terminated by arousal from sleep.15–17 Apneas were classified as obstructive if they were associated with inspiratory efforts throughout the entire period of absent airflow.17
Muscle Sympathetic Nerve Activity
MSNA was recorded directly through a multiunit recording of the postganglionic efferent nerve from the muscle fascicle, on the posterior side of the peroneal nerve, immediately inferior to the fibular head, using the technique of microneurography.18 This technique has been validated and used in numerous laboratory studies in humans. Nerve recordings were made using a tungsten microelectrode and grounded by a reference microelectrode placed 1-2 cm away. The electrodes were connected to a preamplifier, and the nerve signal was fed through a band-pass filter and led to an amplitude discriminator to be stored in an oscilloscope. Signals were amplified by a factor of 100,000 and band-pass filtered (700-2,000 Hz). For recording and analysis, the neurogram was fed through a resistance-capacitance integrator, and nerve activity was rectified and integrated (time constant, 0.1 s) with acquisition sampling frequency of 500 Hz to obtain a mean voltage display of sympathetic nerve activity that was recorded through a software program (WinDaq Software, Dataq Instruments Inc, Akron, OH, USA). The nerve signal was evaluated by measuring bursts per min.
Peripheral and Central Chemoreflex Evaluation
Sympathetic peripheral chemoreflex control and ventilatory peripheral chemoreflex control were evaluated through the inhaling of an isocapnic hypoxic mixture (10% oxygen and 90% nitrogen with titrated carbon dioxide) for 3 min.13,14 During the hypoxic maneuver, isocapnia was maintained by means of carbon dioxide delivery into a gas bag for few seconds every time that end-tidal carbon dioxide levels decreased 1-2 mm Hg. This procedure maintained end-tidal carbon dioxide levels throughout experimental protocol close to those levels obtained at baseline. Sympathetic central chemoreflex control and ventilatory central chemoreflex control were evaluated through the inhaling of a hyperoxic hypercapnic gas mixture (7% carbon dioxide and 93% oxygen) for 3 min.13,14 The patients breathed through a mouthpiece, connected to a nonrebreathing two-way valve (Hans-Rudolph 2730 Series, Shawnee, KS, USA), open to room air for 3 min and then switched to a gas-reservoir (a 30-L bag) for 3 min. The gas in the bag was constantly replenished using cylinders with different gas mixtures according to the experimental protocol. A nasal clip was placed to ensure exclusive mouth breathing. The Y-valve was connected to a pneumotachograph (Hans Rudolph), from which inspired flow was obtained. A precalibrated electronic device (Gould Integrator Plug In Module 13-4615-70 Model A, Gould Instrument System. Inc, Valley View, OH, USA) was used to perform integration of all tidal volume areas per min. Thus, the VE was the summation of all expired volumes measured during each min. The pneumotachograph was calibrated using a 3-L syringe. RR was monitored using a piezoelectric thoracic belt (model 1132 Pneumotrace II, UFI, Morro Bay, CA, USA). During this time, arterial oxygen saturation was assessed by pulse oximetry (Dixtal DX 2405 Oxypleth, Dixtal Biomédica, Manaus, AM, Brazil) of the fingertip and end-tidal carbon dioxide by capnograph (Dixtal DX 1265 ETCO2 – Capnogard, Dixtal Biomédica, Manaus, AM, Brazil). The oxygen saturation and end-tidal carbon dioxide levels were displayed in real time on the oximetry and capnograph screen, respectively. Steady-state ventilatory chemosensitivity was taken as the delta VE/delta O2 or CO2 during 3 min of isocapnic hypoxic gas mixture or hyperoxic hypercapnic gas mixture, respectively. Likewise, sympathetic chemosensitivity was taken as the delta MSNA/delta O2 or CO2 during 3 min of isocapnic hypoxic gas mixture or hyperoxic hypercapnic gas mixture, respectively.
Other Measurements
HR was monitored continuously through lead II of the electrocardiogram. BP was noninvasively measured on the leg on a per-min basis (Dixtal DX 2010TM, Dixtal Biomédica, Manaus, AM, Brazil).
Statistical Analysis
The data are presented as the mean ± standard error. Physical characteristics, polysomnography data, and neural and hemodynamic measurements at baseline were subjected to a one-way analysis of variance (ANOVA). A two-way ANOVA with repeated measures was performed to test differences of MSNA response within and between groups during peripheral and central chemoreflex stimulation. One-way ANOVA was performed to test differences of VE response between groups (delta VE/delta O2 and CO2) at the third min of peripheral and central chemoreflex stimulation by isocapnic hypoxia and hyperoxic hypercapnia, respectively. When significance was found, a Scheffe post hoc comparison was performed. Probability values ≤ 0.05 were considered to be statistically significant. Sympathetic and ventilatory chemoreflex sensitivity was defined as the area under the curve (AUC) of the change in MSNA and VE in response to a progressive reduction of oxygen saturation or progressive increase in end-tidal carbon dioxide.19 Univariate correlation (Pearson correlation) between baseline MSNA and physical characteristics, MetS risk factors, OSA markers, sympathetic chemoreflex sensitivity, and baroreflex sensitivity was conducted to test the association between parameters. In addition, multiple linear regression analysis was conducted to assess which factors independently predicted the increase in MSNA activity. For multivariate linear regression, we included the variables with P ≤ 0.05 in previous univariate analysis.
RESULTS
Basal Measurements
Forty-six patients (21 women) with MetS were involved in the current study. Some patients involved in the current study were also investigated in our previous study.3 They were allocated into two groups according to the AHI obtained by the nocturnal polysomnography: (1) with OSA (MetS + OSA; n = 24), and (2) without OSA (MetS – OSA; n = 22). Eleven age-matched healthy control subjects were also studied.
Baseline measures are shown in Table 1. There are more males in the MetS + OSA (70.8%) and control groups (72.7%) than in the MetS – OSA group (36.4%). Age was similar among groups. Body weight and body mass index were similar between MetS – OSA and MetS + OSA patients. These physical characteristics were higher in MetS patients than in normal control subjects (Table 1). The nocturnal polysomnography data showed no differences in total sleep time, sleep efficiency, stage 2, stage 3 and 4, or rapid eye movement stage of sleep among groups. As expected, AHI and arousal index were higher and minimum oxygen saturation was lower in the MetS + OSA group when compared with MetS – OSA and control groups (Table 1). Waist circumference, plasma glucose, triglycerides, HDL-cholesterol, systolic BP, and diastolic BP were similar between MetS – OSA patients and MetS + OSA patients. Waist circumference, triglycerides, systolic BP, and diastolic BP were higher in MetS patients than in normal control subjects, whereas glucose levels were higher and HDL-cholesterol levels were lower in MetS + OSA when compared with control subjects (Table 1). Basal measurements stratified by sex are shown in the Supplemental Results.
Table 1.
Physical characteristics, metabolic profile, and polysomnography data at baseline in metabolic syndrome patients with or without obstructive sleep apnea and normal control subjects
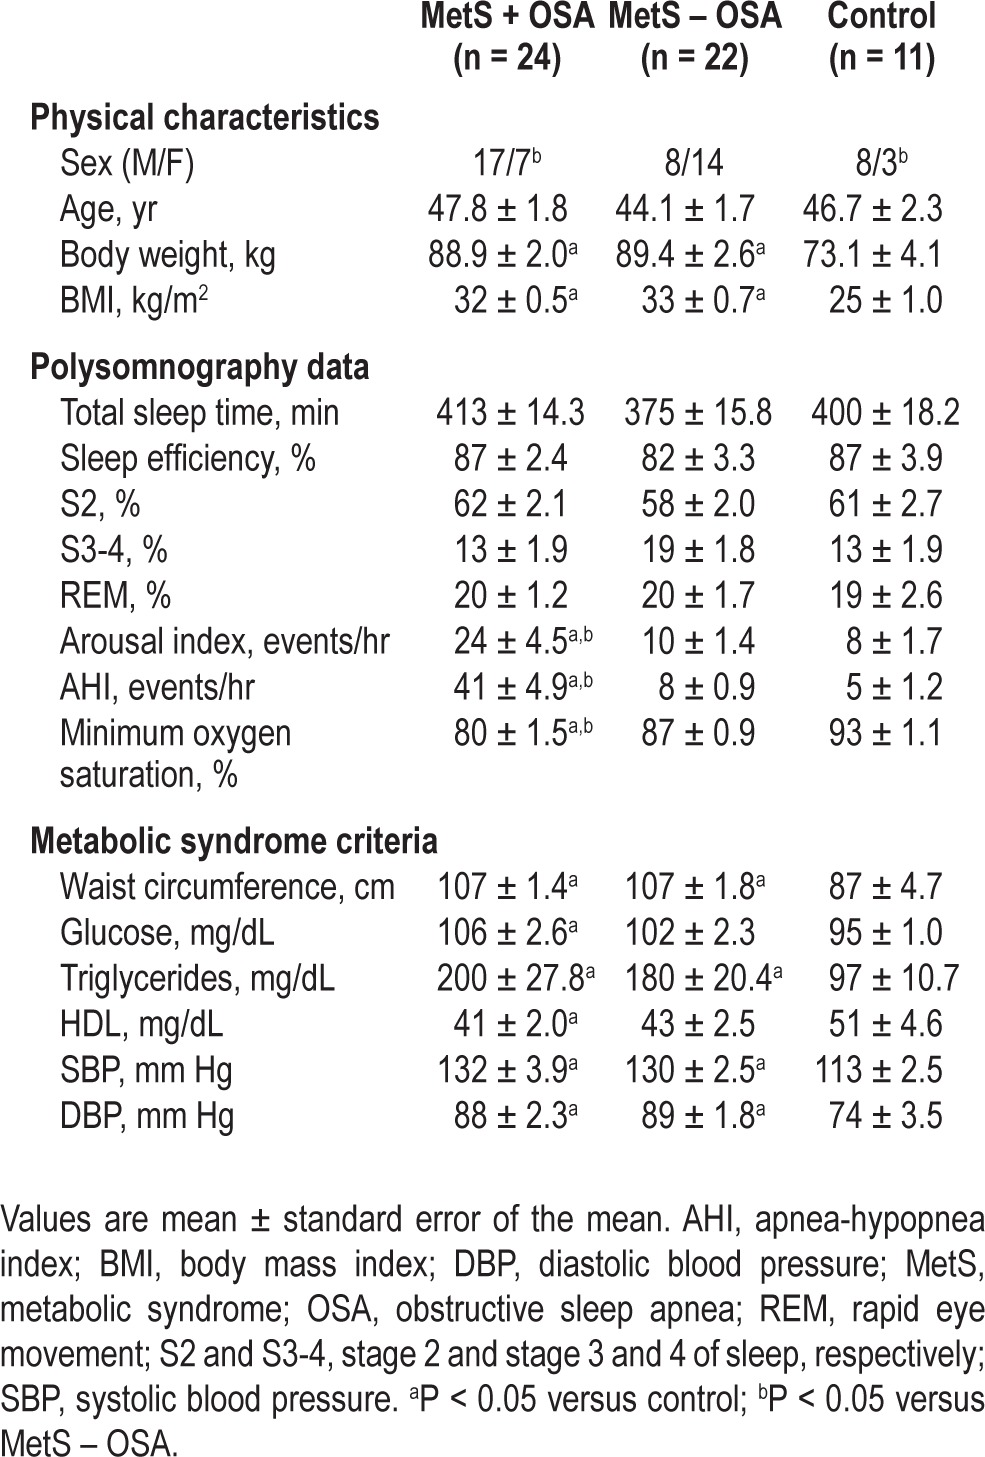
Baseline hemodynamic and ventilatory measures are shown in Table 2. HR, mean BP, VE, RR, oxygen saturation, and end-tidal carbon dioxide were similar among all groups studied. Baseline MSNA levels were higher in MetS patients than in normal control subjects. In addition, MSNA levels were higher in MetS + OSA than MetS – OSA patients (Table 2). Basal hemodynamic and ventilatory measures stratified by sex are shown in the Supplemental Results.
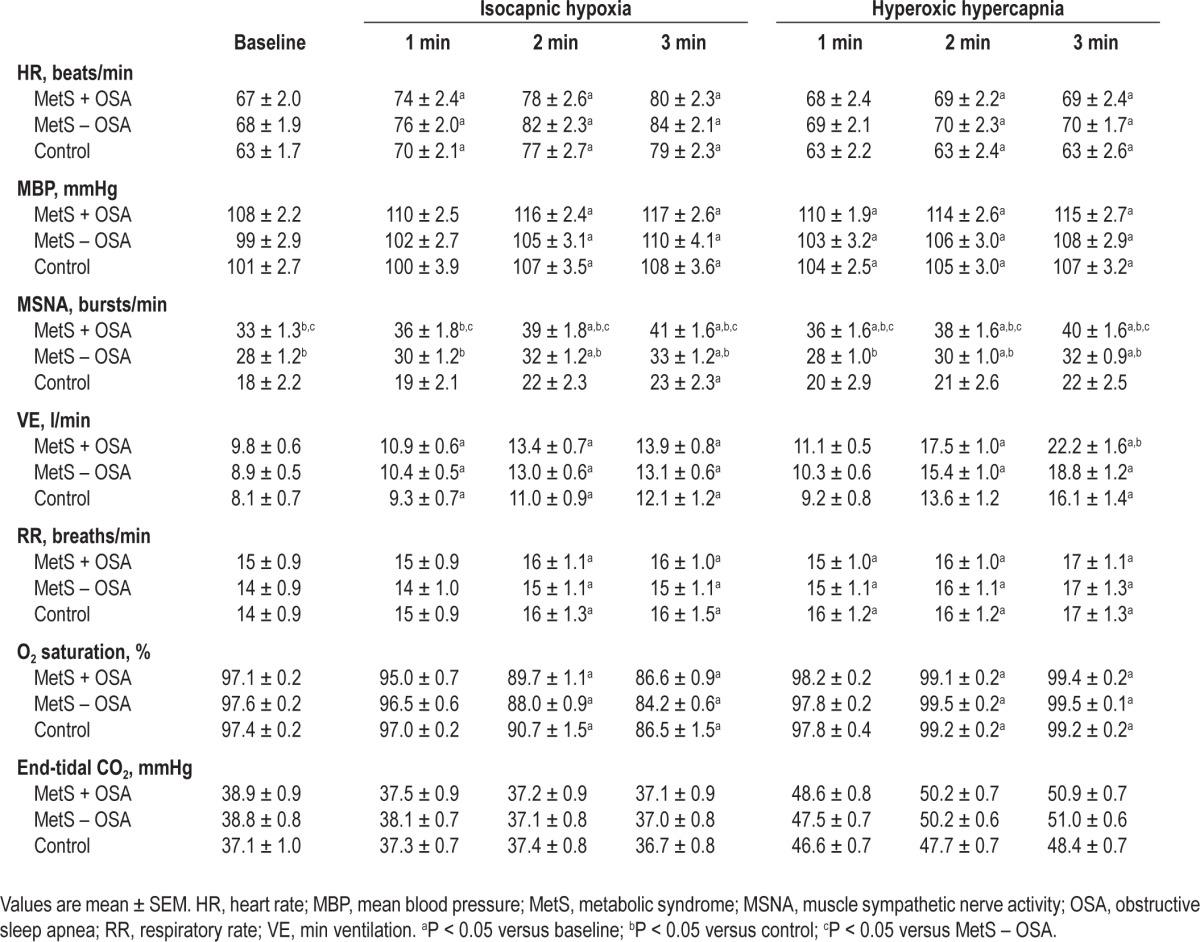
Table 2.
Hemodynamic, neural, and ventilatory measurements at baseline and during isocapnic hypoxia and hyperoxic hypercapnia in metabolic syndrome patients with or without obstructive sleep apnea and normal control subjects
Peripheral Chemoreflex Sensitivity
The data obtained during isocapnic hypoxia are shown in Table 2. During isocapnic hypoxia, HR, mean BP, and RR increased similarly and oxygen saturation decreased similarly in MetS + OSA, MetS – OSA, and normal control subjects. The end-tidal carbon dioxide did not significantly change throughout experimental protocol in all three groups studied.
Sympathetic Peripheral Chemoreflex Sensitivity
The absolute levels of MSNA significantly increased during isocapnic hypoxia in the MetS + OSA and MetS – OSA patients (second and third min) and in the normal control subjects (third min, interaction, P = 0.03, Table 2). Regarding the response of MSNA, determined by the absolute changes in MSNA, we found that isocapnic hypoxia caused a significant increase in MSNA in the MetS + OSA patients (first, second, and third min), MetS – OSA patients (second and third min) and normal control subjects (third min) (Figure 2A). The comparisons among groups showed that, despite a similar reduction in oxygen saturation (Figure 2B), the responses in MSNA were significantly greater in patients with MetS + OSA compared with patients with MetS – OSA and normal control subjects (interaction, P = 0.02, Figure 2A). There were no differences between MetS – OSA patients and normal control subjects. Examples of sympathetic neurogram during isocapnic hypoxia in one patient representative from each group are shown in Figure 3. Further analyses showed that there was a significant correlation between baseline MSNA and sympathetic peripheral chemosensitivity, defined as AUC of change in MSNA per change in oxygen saturation (Figure 4A).
Figure 2.

(A) Absolute change of muscle sympathetic nerve activity (MSNA) and (B) oxygen saturation (O2 saturation) during isocapnic hypoxia and (C) absolute change of MSNA and (D) carbon dioxide exhaled (End-tidal CO2) during hyperoxic hypercapnia in patients with metabolic syndrome plus obstructive sleep apnea (MetS + OSA), patients with metabolic syndrome without obstructive sleep apnea (MetS – OSA) and normal control subjects. Note that, either during isocapnic hypoxia or during hyperoxic hypercapnia, MetS + OSA group had higher MSNA responses than control subjects. In addition, during isocapnic hypoxia MetS + OSA patients have higher MSNA responses compared with MetS – OSA patients. *P < 0.05 versus control; †P < 0.05 versus MetS – OSA.
Figure 3.

Sympathetic neurograms at baseline, during isocapnic hypoxia and during hyperoxic hypercapnia in one patient representative from each group: metabolic syndrome and obstructive sleep apnea (MetS + OSA), metabolic syndrome without obstructive sleep apnea (MetS – OSA), and control.
Figure 4.

Correlation coefficient between area under the curve (AUC) of change in muscle sympathetic nerve activity (MSNA) per change in oxygen saturation during isocapnic hypoxia with baseline of MSNA - Peripheral chemoreflex sensitivity (A), correlation coefficient between AUC of change in MSNA per change in end-tidal carbon dioxide during hyperoxic hypercapnia with baseline of MSNA - Central chemoreflex sensitivity (B), correlation coefficient between AUC of change in min ventilation (VE) per change in oxygen saturation during isocapnic hypoxia with baseline of VE (C) and correlation coefficient between AUC of change in VE per change in end-tidal carbon dioxide during hyperoxic hypercapnia with baseline of VE (D).
Ventilatory Peripheral Chemoreflex Sensitivity
Min ventilation during isocapnic hypoxia increased significantly and similarly in all groups studied (Table 2). In addition, there were no differences among groups in delta change of VE per delta change of oxygen saturation at third min of isocapnic hypoxia (interaction, P = 0.32, Figure 5A). Further analyses showed that there was a significant correlation between baseline VE and ventilatory peripheral chemosensitivity, defined as AUC of change in VE per change in oxygen saturation (Figure 4C).
Figure 5.
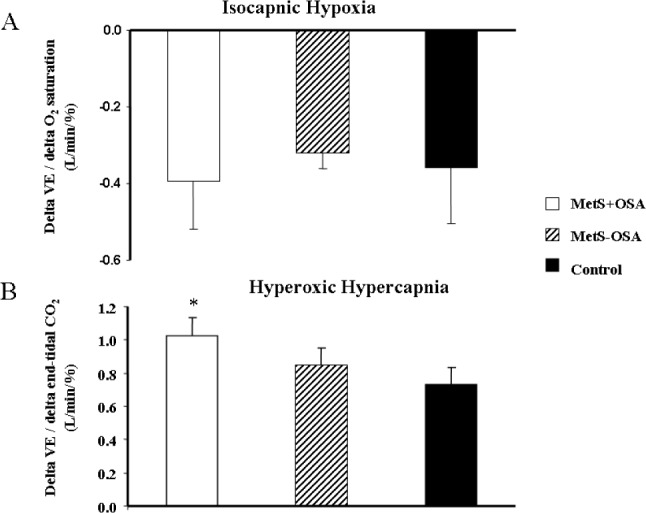
(A) Change in min ventilation (VE) per change in oxygen saturation at the peak of isocapnic hypoxia, and (B) change in VE per change in end-tidal carbon dioxide at the peak of hyperoxic hypercapnia, in patients with metabolic syndrome plus obstructive sleep apnea (MetS + OSA), patients with metabolic syndrome without obstructive sleep apnea (MetS – OSA), and normal control subjects. *P < 0.05 versus control.
Data of isocapnic hypoxia stratified by sex are shown in Supplemental Results.
Central Chemoreflex Sensitivity
The data obtained during hyperoxic hypercapnia are shown in Table 2. HR, mean BP, RR, and oxygen saturation increased similarly in the MetS + OSA, MetS – OSA, and control groups.
Sympathetic Central Chemoreflex Sensitivity
The absolute levels of MSNA significantly increased during hyperoxic hypercapnia in MetS + OSA patients (first, second, and third min) and MetS – OSA patients (second and third min, interaction, P = 0.005, Table 2). In contrast, MSNA values did not change in normal control subjects. Regarding the responses of MSNA to hyperoxic hypercapnia (Figure 2C), determined by the absolute changes in MSNA, we found that hyperoxic hypercapnia caused a significant increase in MSNA in MetS + OSA patients (first, second, and third min) and in MetS – OSA patients (second and third min). No significant change was found in normal control subjects. The comparisons among groups showed that, despite similar increases in end-tidal carbon dioxide, the responses in MSNA were greater in patients with MetS + OSA compared with normal control subjects (interaction, P = 0.02, Figure 2C). No differences were found between MetS + OSA patients and MetS – OSA patients. Examples of sympathetic neurogram during hyperoxic hypercapnia in one patient representative from each group are shown in Figure 3. Further analyses showed that there was a significant correlation between baseline MSNA and sympathetic central chemosensitivity, defined as AUC of change in MSNA per change in end-tidal carbon dioxide (Figure 4B).
Ventilatory Central Chemoreflex Sensitivity
Min ventilation during hyperoxic hypercapnia increased in both MetS + OSA and MetS – OSA (second and third min). In normal control subjects, VE increased at the third min (Table 2). The comparison among groups showed that the levels of VE at the third min of hyperoxic hypercapnia were higher in MetS + OSA compared with normal control subjects. No significant differences were found between MetS + OSA and MetS – OSA patients. Additionally, the delta change of VE per delta change of end-tidal carbon dioxide at the third min of hyperoxic hypercapnia was higher in the MetS + OSA compared with the control group (interaction, P = 0.03 and MetS + OSA versus control, P = 0.045, Figure 5B), whereas MetS – OSA did not differ from MetS + OSA or from control subjects (Figure 5B). Further analyses showed that there was a significant correlation between baseline VE and ventilatory central chemosensitivity, defined as AUC of change in VE per change in end-tidal carbon dioxide (Figure 4D).
Data of hyperoxic hypercapnia stratified by sex are shown in Supplemental Results.
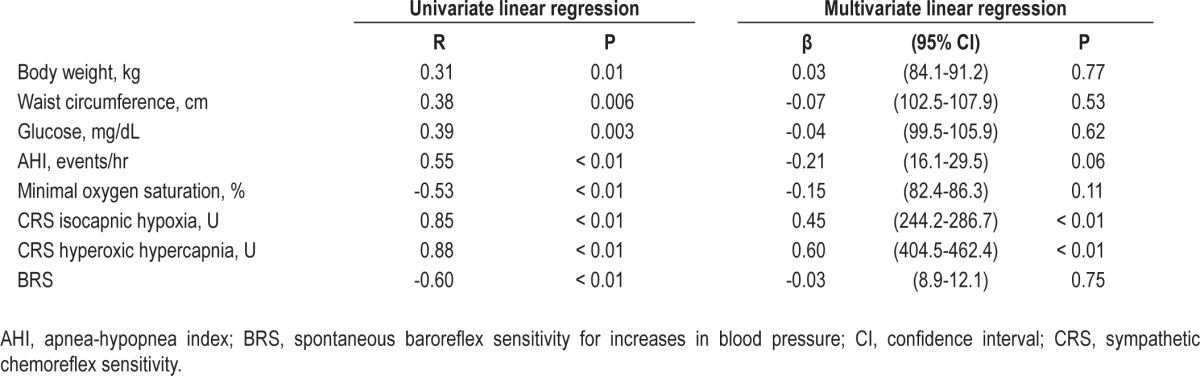
Univariate linear regression analysis showed significant correlations between baseline MSNA and body weight, waist circumference, glucose levels, AHI, minimal oxygen saturation, sympathetic chemosensitivity during isocapnic hypoxia, and sympathetic chemosensitivity during hyperoxic hypercapnia (Table 3). We also found significant correlation between baseline MSNA and baroreflex sensitivity using the data from our previous study,3 because some of the patients included in the current study were also involved in that study. MSNA did not significantly correlate with age (R = 0.08, P = 0.55), HDL (R = −0.01, P = 0.92), triglycerides (R = 0.07, P = 0.63), systolic BP (R = 0.20, P = 0.17) and diastolic BP (R = 0.27, P = 0.06). For multivariate linear regression, we included the variables with P ≤ 0.05 in prior univariate analysis (Table 3). In the multiple linear regression analysis, we found that baseline MSNA levels were significantly associated with sympathetic peripheral chemosensitivity (isocapnic hypoxia, P < 0.01) and sympathetic central chemosensitivity (hyperoxic hypercapnia, P < 0.01). In addition, AHI tended to remain associated with MSNA (P = 0.06, Table 3).
Table 3.
Univariate and multivariate linear regression
DISCUSSION
The current study provides new and important information regarding the effect of OSA on autonomic control in humans with MetS. Patients with MetS and OSA have increased sympathetic peripheral and central chemoreflex responses. In addition, these patients have increased ventilatory central chemoreflex response, but preserved ventilatory peripheral chemoreflex response. Finally, MSNA and pulmonary ventilation are associated with peripheral and central chemoreflex sensitivity responses.
Accumulated findings show that the peripheral and central chemoreflexes trigger both ventilation and sympathetic nerve activity.20 Our study corroborates this concept. Hypoxia and hypercapnia provoked both an increase in MSNA and in pulmonary ventilation. The novelty of the current study is that sympathetic and ventilatory chemoreflex responses are markedly altered in humans with MetS and OSA. Patients with MetS and OSA have increased MSNA responses during exposure to low oxygen levels and increased carbon dioxide levels. In addition, patients with MetS and OSA have increased ventilatory responses during hypercapnia, but preserved ventilatory responses during hypoxia. This selective ventilatory chemoreflex response in patients with MetS and OSA is unclear and beyond the scope of our study. One explanation is the high set point for triggering ventilation during exposure to hypoxia. Thus, someone could argue that the hypoxic stimuli used in the current study were insufficient to stratify differences in patients with MetS and OSA. The similar ventilatory chemoreflex responses not only between MetS patients with and without OSA but also between MetS patients and normal control subjects support this idea. Of course, we cannot rule out the possibility of ventilatory peripheral chemoreflex preservation in patients with MetS and OSA. Selective ventilatory chemoreflex control has been found in other groups of patients. Some investigators reported selective ventilatory peripheral activation during exposure to hypoxia in obese patients.21 Others described selective central activation of ventilation in patients with OSA.22
The mechanisms involved in the sympathetic chemoreflex hypersensitivity in patients with MetS and OSA are beyond the scope of the current study. However, we see some attractive reasons to explain the increased sympathetic chemoreflex sensitivity in these patients. First, the compensatory mechanisms stimulated by hypoxemia due to frequent nocturnal apneas may cause chronic sympathetic peripheral and central chemoreflex hypersensitization. Second, the impaired baroreflex control in patients with MetS plus OSA3 may contribute to sympathetic chemoreflex upregulation. Interaction between baroreceptor and chemoreceptor reflexes have been described in animals23 and humans.24 Somers et al.24 showed that baroreceptor activation elicited by systemic blood pressure elevation with intravenous phenylephrine infusions inhibits sympathetic response to isocapnic hypoxia. This selective interaction may occur because the carotid baroreceptor and chemoreceptor neurons are distributed in close proximity in the solitary and paramedian reticular nuclei in the medulla.24 Third, the increased sympathetic chemoreflex sensitivity in patients with MetS and OSA may be due to the overlap of these two syndromes.
Increased sympathetic nerve activity in patients with MetS has been reported.4 Moreover, other investigators, taking into consideration the presence of occult sleep disorders, showed that OSA causes a further neural burden in patients with MetS.3,6 Our study confirms these findings. Patients with MetS and OSA have greater MSNA than patients with MetS. Why is sympathetic nerve activity further increased in patients with MetS and OSA? Our study provides no definitive answer for this question, but raises important points regarding to this matter. The sympathetic chemoreflex sensitivity as an independent predictor of MSNA strengthens the concept that the chemoreflex control is involved in the sympathetic nerve activation in patients with MetS and OSA. In a recent study, we found that MSNA was inversely associated with arterial baroreflex sensitivity in patients with MetS and OSA,3 even though the arterial baroreflex sensitivity has not been typified as an independent predictor of MSNA in the current study. Taken together, these findings suggest that the sympathetic chemoreflex sensitivity plays an important role in the increased sympathetic nerve activity in patients with MetS and OSA. However, we cannot rule out that the reduction in arterial baroreflex sensitivity may contribute to the chemoreflex-mediated sympathetic outflow in patients with MetS and OSA.
Another interesting piece of information in our study is the association between pulmonary ventilation and ventilatory chemoreflex sensitivity. Both ventilatory peripheral and central chemoreflex responses were significantly correlated with baseline pulmonary ventilation. The implication of such a finding is uncertain. Although this association does not necessarily mean a cause/effect relationship, it may lead to the suspicion that the ventilatory chemoreflex sensitivity modulates the pulmonary ventilatory pattern. Thus, the ventilatory central chemoreflex hypersensitivity should contribute to an increase in baseline pulmonary ventilation in patients with MetS and OSA. Surprisingly, this was not the case. In contrast to MSNA, baseline pulmonary ventilation was not altered in patients with MetS and OSA. This apparent mismatch is an interesting topic for future investigations.
Limitations
We see several limitations in our study. Someone could raise the question that the inclusion of patients with OSA alone in the current study would be more direct evidence for the influence of OSA in all chemoreflex sensitivity deregulation. On the other hand, the similarity between MetS patients and normal control subjects strengthens the interpretation that OSA is, in fact, responsible for sympathetic and ventilatory chemoreflex hypersensitivity in patients with MetS. Of course, we cannot exclude the lack of power to detect differences between these two groups. We recognize that the examination of patients with MetS and OSA after 1 mo of compliant continuous positive airway pressure (CPAP) use would support the role of OSA in the ventilatory chemoreflex sensitivity, because this intervention normalizes ventilatory chemosensitivity in OSA patients.25 It seems unlikely that sex influences our findings. A further analysis for sex stratification suggests that the imbalance in sex among groups does not change our interpretation (Supplemental Results and Supplemental Figure S1 and S2). Finally, someone could argue that the lack of randomization in the order of the experimental protocols limited our study. There are at least two arguments against this criticism. A 15-min interval between experimental protocols was sufficient to bring all parameters studied to the baseline in the three groups. A possible cumulative effect on hyperoxic hypercapnia responses was insufficient to restrain the differences among groups.
Perspectives
OSA is becoming increasingly evident in patients with MetS. In the current study, we found that 24 of 46 consecutive outpatients had OSA. This sleep disorder increases peripheral and central chemoreflex sensitivity, which seems to contribute to the augmentation in sympathetic nerve activity in patients with MetS. These findings have clinical implications because a previous study showed that sympathetic exacerbation is associated with poor prognosis in humans.10 Thus, the diagnosis and treatment of OSA in patients with MetS should be highly recommended in clinical practice. In this regard, CPAP emerges as suitable strategy. A recent study showed a remarkable improvement in chemoreflex sensitivity after CPAP use in patients with metabolic syndrome.25 Other nonpharmacologic treatments such as hypocaloric diet and exercise training may have similar effects in patients with MetS.
In conclusion, OSA causes sympathetic peripheral and central chemoreflex hypersensitivity in patients with MetS, which seems to contribute to the increase in sympathetic nerve activity in these patients. In addition, OSA causes ventilatory central chemoreflex hypersensitivity in patients with MetS.
DISCLOSURE STATEMENT
This was not an industry supported study. The authors have indicated no financial conflicts of interest.
ACKNOWLEDGMENTS
All work was performed at the Heart Institute (InCor), University of S̃ao Paulo Medical School, S̃ao Paulo, Brazil. This study was supported by Funda̦c̃ao de Amparo a Pesquisa do Estado de S̃ao Paulo (FAPESP #2011/17533-6), Conselho Nacional de Pesquisa (CNPq # 476385/2006-7), and, in part, by Funda̦c̃ao Zerbini.
SUPPLEMENTAL MATERIAL
SUPPLEMENTAL RESULTS
Basal Measurements Stratified by Sex
Baseline data in men are shown in Table S1. Age was similar among groups. Body weight, body mass index, and waist cir-cumference were similar between MetS — OSA and MetS + OSA patients. However, these parameters were greater in MetS pa-tients when compared with normal control subjectscontrol subjects. There were no differences among groups in total sleep time, sleep efficiency, stage 2, stage 3 and 4, rapid eye movement stage of sleep, and arousal index. Similarly, there were no differences among groups in glucose, HDL-cholesterol levels and in systolic and diastolic BP. AHI was higher in MetS + OSA when compared with MetS — OSA patients and normal control subjectscontrol subjects. Minimum oxygen saturation and triglycerides levels were similar between MetS groups. However, minimum oxygen saturation was lower and triglyceride levels were higher in MetS + OSA when compared with control subjectscontrol subjects (Table S1).
Physical characteristics, metabolic profile, and polysomnography data in men with metabolic syndrome with or without obstructive sleep apnea and normal control subjects
Baseline data in women are shown in Table S2. Age was similar among groups. Body weight, body mass index, and waist cir-cumference were similar between MetS — OSA and MetS + OSA patients. However, these parameters were greater in MetS patients when compared with normal control subjectscontrol subjects. There were no differences among groups in total sleep time, sleep efficiency, stage 2, stage 3 and 4, rapid eye movement stage of sleep and arousal index. Similarly, there were no differences in glucose, triglycerides, and HDL-cholesterol levels among groups. Diastolic BP was greater in MetS patients than in normal control subjectscontrol subjects, whereas systolic BP was greater in MetS + OSA than in normal control subjectscontrol subjects. Minimum oxygen saturation was higher in MetS + OSA patients when compared with MetS — OSA patients and normal control subjectscontrol subjects and AHI was higher in the MetS + OSA group when compared with the control group (Table S2).
Physical characteristics, metabolic profile, and polysomnography data in women with metabolic syndrome with or without obstructive sleep apnea and normal control subjects
Peripheral Chemoreflex Sensitivity
The comparisons among male groups showed that the responses in MSNA were significantly greater in patients with MetS + OSA (n = 17) compared with patients with MetS — OSA (n = 8) and normal control subjectscontrol subjects (n = 8) (interaction, P = 0.05, Figure S1A). There were no differences between MetS — OSA patients and normal control subjectscontrol subjects. Similarly, the comparisons among female groups showed that the responses in MSNA were significantly greater in patients with MetS + OSA (n = 7) compared with patients with MetS — OSA (n = 14) and normal control subjects (n = 3) (interaction, P = 0.02, Figure S1B). There were no differences between MetS — OSA patients and normal control subjects.
Absolute change of muscle sympathetic nerve activity (MSNA) during isocapnic hypoxia in patients with metabolic syndrome plus obstructive sleep apnea (MetS + OSA), patients with metabolic syndrome without obstructive sleep apnea (MetS – OSA), and normal control subjects, stratified by men (A) and women (B). Note that during isocapnic hypoxia, either men or women in MetS + OSA groups had higher MSNA responses than control subjects. In addition, during isocapnic hypoxia, MetS + OSA patients have higher MSNA responses compared with MetS – OSA patients. *P < 0.05 versus control; †P < 0.05 versus MetS – OSA.
Central Chemoreflex Sensitivity
The comparisons among male groups showed that the responses in MSNA were significantly greater in MetS + OSA (n = 17) when compared with MetS — OSA patients (n = 8) and normal control subjects (n = 8) (group comparison, P = 0.001, Figure S2A). No differences were found between MetS — OSA patients and normal control subjects. The comparisons among female groups showed that the responses in MSNA tended to be greater in MetS + OSA patients (n = 7) when compared with MetS — OSA patients (P = 0.08, n = 14) and normal control subjects (P = 0.09, n = 3; group comparison, P = 0.03, Figure S2B). No differences were found between MetS — OSA patients and normal control subjects.
Absolute change of muscle sympathetic nerve activity (MSNA) during hyperoxic hypercapnia in patients with metabolic syndrome plus obstructive sleep apnea (MetS + OSA), patients with metabolic syndrome without obstructive sleep apnea (MetS – OSA) and normal control subjects, stratified by men (A) and women (B). Note that during hyperoxic hypercapnia, either men or women in MetS + OSA groups had higher MSNA responses than control subjects. In addition, during hyperoxic hypercapnia, MetS + OSA patients have higher MSNA responses compared with MetS – OSA patients. *P < 0.05 versus control; †P < 0.05 versus MetS – OSA.
REFERENCES
- 1.Vgontzas AN, Bixler EO, Chrousos GP. Sleep apnea is a manifestation of the metabolic syndrome. Sleep Med Rev. 2005;9:211–24. doi: 10.1016/j.smrv.2005.01.006. [DOI] [PubMed] [Google Scholar]
- 2.Drager LF, Lopes HF, Maki-Nunes C, et al. The impact of obstructive sleep apnea on metabolic and inflammatory markers in consecutive patients with metabolic syndrome. PLoS One. 2010;5:e12065. doi: 10.1371/journal.pone.0012065. [DOI] [PMC free article] [PubMed] [Google Scholar]
- 3.Trombetta IC, Somers VK, Maki-Nunes C, et al. Consequences of comorbid sleep apnea in the metabolic syndrome--implications for cardiovascular risk. Sleep. 2010;3:1193–9. doi: 10.1093/sleep/33.9.1193. [DOI] [PMC free article] [PubMed] [Google Scholar]
- 4.Grassi G, Dell’Oro R, Quarti-Trevano F, et al. Neuroadrenergic and reflex abnormalities in patients with metabolic syndrome. Diabetologia. 2005;48:1359–65. doi: 10.1007/s00125-005-1798-z. [DOI] [PubMed] [Google Scholar]
- 5.Narkiewicz K, Pesek CA, Kato M, Phillips BG, Davison DE, Somers VK. Baroreflex control of sympathetic nerve activity and heart rate in obstructive sleep apnea. Hypertension. 1998;32:1039–43. doi: 10.1161/01.hyp.32.6.1039. [DOI] [PubMed] [Google Scholar]
- 6.Grassi G, Seravalle G, Quarti-Trevano F, et al. Reinforcement of the adrenergic overdrive in the metabolic syndrome complicated by obstructive sleep apnea. J Hypertens. 2010;28:1313–20. doi: 10.1097/HJH.0b013e328337a9fd. [DOI] [PubMed] [Google Scholar]
- 7.Bradley TD, Floras JS. Sleep apnea and heart failure Part I: Obstructive sleep apnea. Circulation. 2003;107:1671–8. doi: 10.1161/01.CIR.0000061757.12581.15. [DOI] [PubMed] [Google Scholar]
- 8.Somers VK, Dyken ME, Clary MP, Abboud FM. Sympathetic neural mechanisms in obstructive sleep apnea. J Clin Invest. 1995;96:1897–1904. doi: 10.1172/JCI118235. [DOI] [PMC free article] [PubMed] [Google Scholar]
- 9.Xie A, Skatrud JB, Puleo DS, Morgan BJ. Exposure to hypoxia produces long-lasting sympathetic activation in humans. J Appl Physiol. 2001;91:1555–62. doi: 10.1152/jappl.2001.91.4.1555. [DOI] [PubMed] [Google Scholar]
- 10.Barretto AC, Santos AC, Munhoz R, et al. Increased muscle sympathetic nerve activity predicts mortality in heart failure patients. Int J Cardiol. 2009;135:302–7. doi: 10.1016/j.ijcard.2008.03.056. [DOI] [PubMed] [Google Scholar]
- 11.St Croix CM, Satoh M, Morgan BJ, Skatrud JB, Dempsey JA. Role of respiratory motor output in within-breath modulation of muscle sympathetic nerve activity in humans. Circ Res. 1999;85:457–69. doi: 10.1161/01.res.85.5.457. [DOI] [PubMed] [Google Scholar]
- 12.Grundy SM, Cleeman JI, Daniels SR, et al. American Heart Association; National Heart, Lung, and Blood Institute. Diagnosis and management of the metabolic syndrome: an American Heart Association/National Heart, Lung, and Blood Institute Scientific Statement. Circulation. 2005;112:2735–52. doi: 10.1161/CIRCULATIONAHA.105.169404. [DOI] [PubMed] [Google Scholar]
- 13.Somers VK, Mark AL, Zavala DC, Abboud FM. Contrasting effects of hypoxia and hyperoxic hypercapnia on ventilation and sympathetic activity in humans. J Appl Physiol. 1989;67:2101–6. doi: 10.1152/jappl.1989.67.5.2101. [DOI] [PubMed] [Google Scholar]
- 14.Somers VK, Mark AL, Zavala DC, Abboud FM. Influence of ventilation and hypocapnia on sympathetic nerve responses to hypoxia in normal humans. J Appl Physiol. 1989;67:2095–2100. doi: 10.1152/jappl.1989.67.5.2095. [DOI] [PubMed] [Google Scholar]
- 15.Drager LF, Bortolotto LA, Lorenzi MC, Figueiredo AC, Krieger EM, Lorenzi-Filho G. Early signs of atherosclerosis in obstructive sleep apnea. Am J Respir Crit Care Med. 2005;172:613–8. doi: 10.1164/rccm.200503-340OC. [DOI] [PubMed] [Google Scholar]
- 16.Drager LF, Bortolotto LA, Krieger EM, Lorenzi-Filho G. Additive effects of obstructive sleep apnea and hypertension on early markers of carotid atherosclerosis. Hypertension. 2009;53:64–9. doi: 10.1161/HYPERTENSIONAHA.108.119420. [DOI] [PubMed] [Google Scholar]
- 17.American Academy of Sleep Medicine. Westchester, IL: American Academy of Sleep Medicine; 2007. The AASM manual for the scoring of sleep and associated events. [Google Scholar]
- 18.Fagius J, Wallin BG. Long-term variability and reproducibility of human muscle nerve activity at rest, as reassessed after a decade. Clin Auton Res. 1993;3:201–5. doi: 10.1007/BF01826234. [DOI] [PubMed] [Google Scholar]
- 19.Tai MM. A mathematical model for the determination of total area under glucose tolerance and other metabolic curves. Diabetes Care. 1994;17:152–4. doi: 10.2337/diacare.17.2.152. [DOI] [PubMed] [Google Scholar]
- 20.Kara T, Narkiewicz K, Somers VK. Chemoreflexes — physiology and clinical implications. Acta Physiol Scand. 2003;177:377–84. doi: 10.1046/j.1365-201X.2003.01083.x. [DOI] [PubMed] [Google Scholar]
- 21.Narkiewicz K, Kato M, Pesek CA, Somers VK. Human obesity is characterized by a selective potentiation of central chemoreflex sensitivity. Hypertension. 1999;33:1153–8. doi: 10.1161/01.hyp.33.5.1153. [DOI] [PubMed] [Google Scholar]
- 22.Narkiewicz K, van de Borne PJ, Pesek CA, Dyken ME, Montano N, Somers VK. Selective potentiation of peripheral chemoreflex sensitivity in obstructive sleep apnea. Circulation. 1999;99:1183–9. doi: 10.1161/01.cir.99.9.1183. [DOI] [PubMed] [Google Scholar]
- 23.Heistad DD, Abboud FM, Mark AL, Schmid PG. Interaction of baroreceptor and chemoreceptor reflexes. Modulation of the chemoreceptor reflex by changes in baroreceptor activity. J Clin Invest. 1974;53:1226–36. doi: 10.1172/JCI107669. [DOI] [PMC free article] [PubMed] [Google Scholar]
- 24.Somers VK, Mark AL, Abboud FM. Interaction of baroreceptor and chemoreceptor reflex control of sympathetic nerve activity in normal humans. J Clin Invest. 1991;87:1953–7. doi: 10.1172/JCI115221. [DOI] [PMC free article] [PubMed] [Google Scholar]
- 25.Loewen A, Ostrowski M, Laprairie J, et al. Determinants of ventilatory instability in obstructive sleep apnea: inherent or acquired? Sleep. 2009;32:1355–65. doi: 10.1093/sleep/32.10.1355. [DOI] [PMC free article] [PubMed] [Google Scholar]
Associated Data
This section collects any data citations, data availability statements, or supplementary materials included in this article.
Supplementary Materials
Physical characteristics, metabolic profile, and polysomnography data in men with metabolic syndrome with or without obstructive sleep apnea and normal control subjects
Physical characteristics, metabolic profile, and polysomnography data in women with metabolic syndrome with or without obstructive sleep apnea and normal control subjects
Absolute change of muscle sympathetic nerve activity (MSNA) during isocapnic hypoxia in patients with metabolic syndrome plus obstructive sleep apnea (MetS + OSA), patients with metabolic syndrome without obstructive sleep apnea (MetS – OSA), and normal control subjects, stratified by men (A) and women (B). Note that during isocapnic hypoxia, either men or women in MetS + OSA groups had higher MSNA responses than control subjects. In addition, during isocapnic hypoxia, MetS + OSA patients have higher MSNA responses compared with MetS – OSA patients. *P < 0.05 versus control; †P < 0.05 versus MetS – OSA.
Absolute change of muscle sympathetic nerve activity (MSNA) during hyperoxic hypercapnia in patients with metabolic syndrome plus obstructive sleep apnea (MetS + OSA), patients with metabolic syndrome without obstructive sleep apnea (MetS – OSA) and normal control subjects, stratified by men (A) and women (B). Note that during hyperoxic hypercapnia, either men or women in MetS + OSA groups had higher MSNA responses than control subjects. In addition, during hyperoxic hypercapnia, MetS + OSA patients have higher MSNA responses compared with MetS – OSA patients. *P < 0.05 versus control; †P < 0.05 versus MetS – OSA.