Abstract
Carbonic anhydrases (CAs) catalyze the hydration of CO2 forming HCO3− and a proton, an important reaction for many physiological processes including respiration, fluid secretion, and pH regulation. As such, CA isoforms are prominent clinical targets for treating various diseases. The clinically used acetazolamide (AZM) is a sulfonamide that binds with high affinity to human CA isoform II (HCA II). There are several X-ray structures available of AZM bound to various CA isoforms, but these complexes do not show the charged state of AZM, or hydrogen (H) atom positions of the protein and solvent. Neutron diffraction is a useful technique for directly observing H atoms and the mapping of H-bonding networks that can greatly contribute to rational drug design. To this end the neutron structure of H/D exchanged HCA II crystals in complex with AZM was determined. The structure reveals the molecular details of AZM binding and the charged state of the bound drug. This represents the first determined neutron structure of a clinically used drug bound to its target.
Carbonic anhydrase (CA) is a ubiquitous metalloenzyme found in all the kingdoms of life, from plants to humans, catalyzing CO2 hydration (and bicarbonate dehydration). Humans have 15 isoforms that are expressed in diverse tissues. These isoforms can be cytosolic, trans-membrane, or membrane-bound.1 Human CAII (HCA II) is a monomeric~29 kDa soluble cytosolic isoform that contains zinc in the active site. HCA II is found predominantly in red blood cells and has the fastest catalytic turnover (106 s−1) among all the CAs characterized to date. Most CAs use a zinc-hydroxide (Zn-OH−) mechanism to reversibly convert CO2 to HCO3− and a proton as illustrated in the reactions below2:
| reaction 1 |
| reaction 2 |
CA inhibitors (CAIs) have been used for decades as diuretics and anti-glaucoma drugs. CAIs can be broadly classified into two groups based on their binding mechanism: (a) binding to the tetrahedral configuration of the Zn metal center, thus displacing the Zn-bound solvent (e.g. sulfonamides), or (b) by forming a trigonal-bipyramidal species through expansion of the metal coordination geometry without displacing the Zn-bound solvent (e.g. cyanates). The use of CAIs has now been expanded to include treatments for convulsions, obesity, cancer, as well as being developed for use as diagnostic tools.3,4 In cancer, CA IX is believed to be responsible for the acidification of the extracellular matrix (ECM) when tumors become hypoxic.5
Due to the sequence conservation among CA isoforms in humans, clinically used CAIs target many isoforms. It should be noted that HCA II inhibition dominates as its expression is widespread and HCA II has one of the highest catalytic rates. Most structure-based CAI designs have focused on HCA II X-ray crystallographic studies. There are numerous crystal structures in the Protein Data Bank (www.rcsb.pdb.org) of CAs bound to a variety of CAIs: the sulfonamides, their bioisosteres, small molecule anions, phenols, coumarins, and polyamines.6, 7 Sulfonamides are still of significant interest with more than 30 derivatives being used clinically.8
The primary sequence conservation among CA isoforms causes cross-reactivity of CAIs and this necessitates the development of isoform-specific drugs.4 A detailed understanding of the water patterns and H-bonding in the active site provided by this neutron diffraction study gives a new avenue for the rational structure-based drug design effort.
AZM dissolved in water has three possible protonation states with two associated pKa values (7.2 and 8.7) that are relevant to physiological pH (Figure 1). It is thought that any of these forms can bind to HCA II.9, 10 There have been no crystallographic studies to definitively observe the charged state of AZM bound to HCA II and it is unknown which form dominates in the crystalline state. This is despite the availability of very high resolution (1.1 Å resolution) X-ray data.11 However, results from past 15N NMR studies have shown that it is the sulfonamido anion (Form 3 in Figure 1) that binds to HCA II in solution.12
Figure 1.
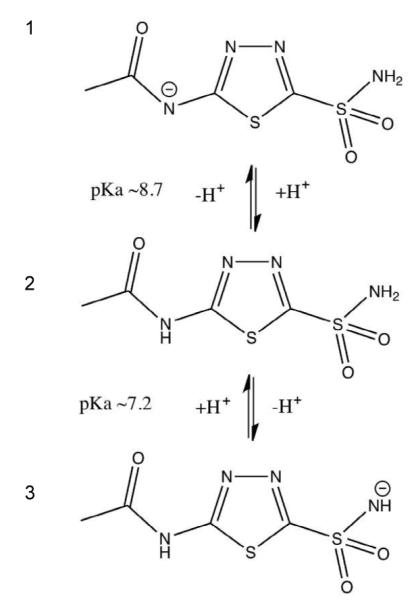
Ionization and pKa of acetazolamide (AZM) in water. These different charged states represent the relevant forms that may bind HCA II under physiological conditions. Figure was drawn with ChemDraw (Perkin Elmer) and adapted from Supuran & Winum, 2009.10
There is limited explicit information available about the H-bonding interactions between enzymes and inhibitors/drugs and the role of solvent orientations. Besides the current neutron study of HCA II:AZM, there are only two other reports of a similar nature: E. coli Dihydrofolate reductase (DHFR) : metho-trexate and HIV protease:KNI-272.13, 14 While metho-trexate is a widely used chemotherapy agent, the reported neutron structure is in complex with a bacterial DHFR homologue. Similarly, the inhibitor KNI-272 bound to HIV protease has no clinical significance as it is not a drug currently in use. To determine the charged state and binding mode of AZM, a single H/D exchanged crystal of HCA II, co-crystallized with AZM was prepared.
The room temperature (RT) time-of-flight neutron diffraction data set was collected on a large crystal (volume ~2 mm3) at the neutron Protein Crystallography Station at Los Alamos National Laboratory. Neutron and X-ray diffraction data extended to a resolution of 2.0 Å and 1.6 Å, respectively. Details of sample preparation, data collection, and joint X-ray and neutron structure refinement are described in the Supplementary Information. All data collection and model refinement statistics are given in Table S1.
The AZM molecule was clearly observed in omit Fo-Fc electron density maps and after placement and refinement was found to bind in the same overall configuration as reported previously.11 A series of omit Fo-Fc and 2Fo-Fc nuclear density maps reveal the positions of the two exchangeable D atoms of AZM (Figure 2), information not obtainable from the X-ray data alone.
Figure 2.
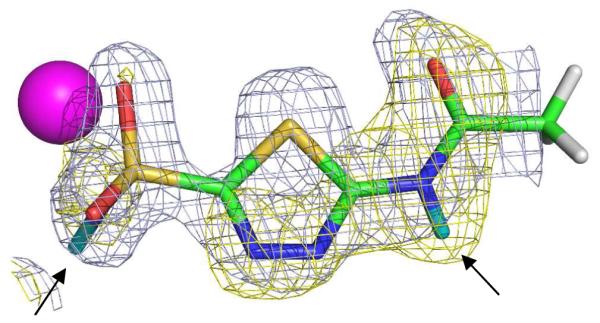
Stick representation of AZM bound to HCA II. Zinc is shown as a magenta sphere, D atoms are in cyan (indicated by arrows), H atoms in white (positions calculated). The nuclear density map is shown in yellow and is contoured at 1.5 σ, the electron density map is shown in blue and is contoured at 2.0 σ.
Neutron diffraction gives an advantage over conventional X-ray diffraction techniques in that even at medium resolution (1.5 – 2.0 Å) it is the only direct method available for unambiguously visualizing H (or D) atomic positions. Neutrons scattering off atomic nuclei lead to H/D atoms being as visible as heavier N, C, or O atoms. In contrast, X-ray diffraction occurs from the electron cloud making it very challenging to observe light H/D atoms with any confidence. A systematic study by Gardberg et al. carried out on a limited set of X-ray and neutron structures revealed a trend that at sub-atomic resolution (~ 1 Å) only a fraction of H atoms are observed in electron density maps. This is in dramatic contrast to the case for nuclear density maps where almost all H/D atoms are observed at medium resolution.15
The joint X-ray and neutron structure refinement approach exploits the strengths of each technique: the use of X-ray data to refine “heavy” (non-H) atoms in proteins and complementing this with neutron data to refine “light” (H/D) atoms (Figure 2).16 Highly complementary joint X-ray and neutron studies give very accurate and elusive details regarding H-bonding, solvent molecule orientation, and the protonation states of residues.17, 18
The neutron structure reported here clearly shows the charged state of AZM as well as H-bonding between HCA II and AZM, information not obtainable from numerous high-resolution X-ray studies (Figure 2).11, 19
Omit Fo-Fc nuclear density maps calculated without the two exchanged D atoms – one each on the acetoamido and sulfonamido groups – clearly revealed that AZM was in the anionic form, with the negatively charged sulfonamido group coordinated to the zinc (Form 3 in Figure 1; Figure 2 and 3).
Figure 3.
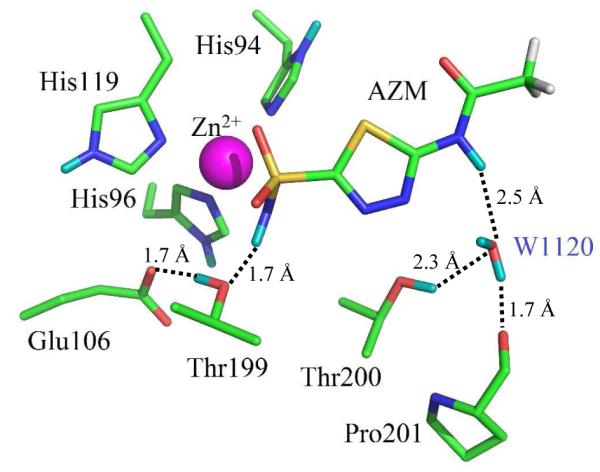
Stick representation of the neutron structure of the active site of HCA II:AZM (PDB ID 4g0c). Amino acid residues and waters are as labeled, Zinc is shown as a magenta sphere, exchanged D atoms are shown in cyan and unexchanged H atoms in white. Hydrogen bonds as observed in the nuclear maps are indicated by dashed lines with distances as indicated.
Four H-bonded waters are displaced upon AZM binding (waters S1-4; Figure S1).17 It was noted that these waters serve as a chemical template for where the AZM binds, in that the O of the waters superimpose with the N and S atoms of AZM.
The lone pair of sulfonamide N is involved in a coordinating bond with the zinc of ~2.4 Å distance (Figure 3 and 4). This leads to a H-bonding scheme where the single D atom on the sulfonamide group acts as a H-bond donor to Thr199, which in turn acts as a H-bond donor to Glu106.
Figure 4.
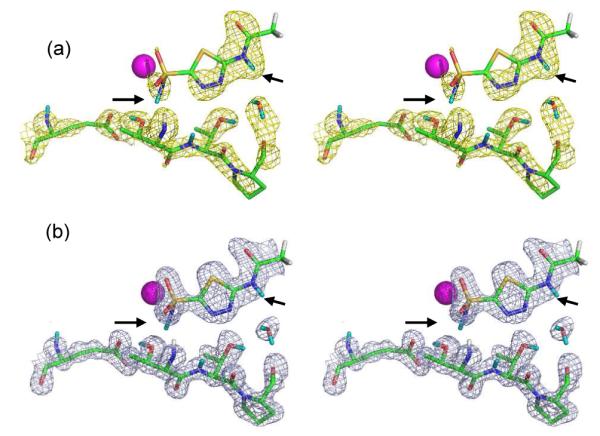
Complementarity of electron and nuclear density maps. Stereo stick representation of the active site of HCA II with AZM bound (PDB ID 4g0c). D atoms on AZM are indicated by black arrows. (a) Nuclear density map is shown in yellow and is contoured at 1.5 σ; (b) Electron density map is shown in blue and is contoured at 2.0 σ. Residue labeling is as shown in Figure 3.
The –OD of Thr200 participates as a bifurcated H-bond donor to both W1120 and the carbonyl of Pro201. W1120 forms an H-bond bridge between AZM and HCA II, acting as H-bond acceptor from the protonated acetoamido group and as a donor to the backbone carbonyl of Pro201 (Figure 3 and 4).
Figure 4 illustrates the complementarity between electron and nuclear density maps. The neutron scattering length for S is quite small at only 2.7 fm. This is evident in the nuclear density maps where there is no nuclear density for the two S atoms of AZM at a 1.5 σ contour level (Figure 4a). In contrast to this and as expected, there is very strong density for S in the electron density maps (Figure 4b). The neutron scattering magnitude for D is comparatively large at 6.7 fm and this is evident by the excellent density observed for both D atoms.
As expected, the terminal –CH3 group was not visible in the neutron densities as there is significant signal cancellation at 2.0 Å resolution due to the presence of non-exchangeable H atoms (negative 3.7 fm scattering length) in such groups. However, it is not visible in the electron density map either. Although, electron density for the terminal –CH3 is seen in the highest resolution structure (PDB ID: 3hs4)11 of HCA II bound to AZM. In this case, the higher resolution X-ray data was not more informative for a heavy atom C compared to the neutron data.
Combining the previous X-ray11, 19 and current neutron structures a full picture emerges of AZM binding to HCA II (Figure 3 and 5). Besides coordination to the zinc and H-bonding to HCA II, AZM also interacts through two very weak hydrophobic interactions. The first is a type of –CH…π interaction (~ 3.5 Å distance) between Leu198 and the thiadiazole ring of AZM. The other is a somewhat distorted –CH…π interaction between the terminal –CH3 of AZM and Phe131. As weak as these interactions are, they contribute to the overall binding of AZM to HCA II. The KIs for AZM inhibition of HCA II and HCA IX are 12 and 25 nM, respectively.20
Figure 5.
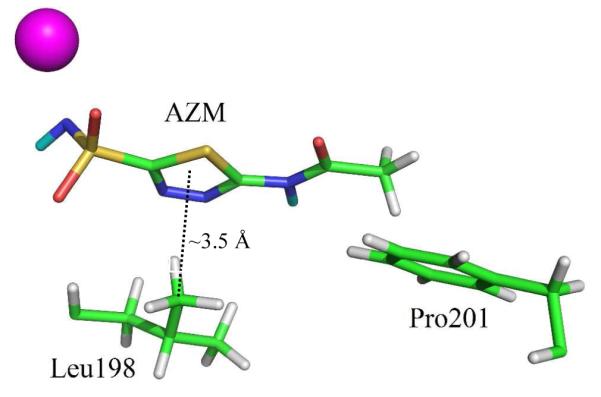
Ball-and-stick representation of the AZM weak hydrophobic interactions within the active site of HCA II. D (cyan) and H (white - positions calculated) atoms. Zinc is shown as a magenta sphere.
A direct comparison of the HCA II and HCA IX active sites shows that the only differences are at residues Phe131 and Val135, with Val and Leu at these positions in HCA IX, respectively (Figure S2). Phe131 (in HCA II) is involved in very weak hydrophobic interactions with AZM and its absence in HCA IX could, in part, explain the small 2-fold difference in binding constants for AZM between HCA II and IX.4
Conclusion
We have solved the first neutron structure of HCA II in complex with a sulfonamide inhibitor. This is the first example of a clinically used inhibitor bound to a human enzyme target to be studied with neutron diffraction. This study adds explicit details about the charged form of the drug that binds to HCA II, H-bonding to the target, and water displacement when AZM binds. A comparison of the current neutron structure with AZM bound to another neutron structure of unbound HCA II (PDB ID: 3tmj)17 reveals that four water molecules in the active site (S1-4, Figure S1) that were bound to either the zinc or H-bonded to other water molecules in the active site are displaced by the binding of AZM (Figure 3). This structure provides insightful observations regarding H-bonds and hydrophobic interactions that play a key role in binding of AZM to HCA II. Neutron diffraction is the only technique that can directly reveal these details and is expected to contribute greatly to structure-based drug design in the future.
Supplementary Material
Acknowledgements
The Protein Crystallography Station is funded by Department of Energy’s Office of Science Biological and Environmental Research. SZF is partially funded by LDRD Early Career award #20110535ER. AYK is partially funded by LDRD ER #20120256ER. RM and DNS are partially funded by National Institutes of Health grant GM25154. All the figures were made using PyMOL (Delano Scientific).
Footnotes
Supporting Information. Experimental data and coordinates were deposited with PDB ID 4g0c. Additional figures and experimental details of crystallization, data collection, and structure refinement. Table S1 contains crystallographic data collection and refinement statistics. This material is available free of charge via the Internet at http://pubs.acs.org.
REFERENCES
- 1.Gilmour K. Comp. Biochem. Physiol. A Mol integr. Physiol. 2010;157:193–197. doi: 10.1016/j.cbpa.2010.06.161. [DOI] [PubMed] [Google Scholar]
- 2.Silverman DN, McKenna R. Solvent-mediated proton transfer in catalysis by carbonic anhydrase. Acc. Chem. Res. 2007;40:669–675. doi: 10.1021/ar7000588. [DOI] [PubMed] [Google Scholar]
- 3.Hynninen P, Parkkila S, Huhtala H, Pastorekova S, Pastorek J, Waheed A, Sly W, Tomas E. APMIS. 2012;120:117–129. doi: 10.1111/j.1600-0463.2011.02820.x. [DOI] [PubMed] [Google Scholar]
- 4.Supuran CT, Scozzafava A, Conway J, editors. Vol. 1. CRC Press; Boca Raton, FL: 2004. [Google Scholar]
- 5.Ditte P, Dequiedt F, Svastova E, Hulikova A, Ohradanova-Repic A, Zatovicova M, Csaderova L, Kopacek J, Supuran CT, Pastorekova S, Pastorek J. Cancer Res. 2011;71:7558–7567. doi: 10.1158/0008-5472.CAN-11-2520. [DOI] [PubMed] [Google Scholar]
- 6.Di Fiore A, Maresca A, Alterio V, Supuran CT, De Simone G. Chem. Commun. (Camb.) 2011;47:11636–11638. doi: 10.1039/c1cc14575d. [DOI] [PubMed] [Google Scholar]
- 7.Alterio V, Monti SM, Truppo E, Pedone C, Supuran CT, De Simone G. Org. Biomol. Chem. 2010;8:3528–3533. doi: 10.1039/b926832d. [DOI] [PubMed] [Google Scholar]
- 8.Supuran CT. Nat. Rev. Drug Discov. 2008;7:168–181. doi: 10.1038/nrd2467. [DOI] [PubMed] [Google Scholar]
- 9.Coleman JE. Ann. Rev. Pharmacol. 1975;15:221–242. doi: 10.1146/annurev.pa.15.040175.001253. [DOI] [PubMed] [Google Scholar]
- 10.Supuran CT, Winum J-Y. John Wiley & Sons; New Jersey USA: 2009. pp. 439–446. [Google Scholar]
- 11.Sippel K, Robbins AH, Domsic J, Genis C, Agbandje-McKenna M, McKenna R. Acta Crystallogr. 2009;F65:992–995. doi: 10.1107/S1744309109036665. [DOI] [PMC free article] [PubMed] [Google Scholar]
- 12.Kanamori K, Roberts JD. Biochemistry. 1983;22:2658–2664. doi: 10.1021/bi00280a011. [DOI] [PubMed] [Google Scholar]
- 13.Bennett B, Langan P, Coates L, Mustyakimov M, Schoenborn B, Howell EE, Dealwis C. Proc. Natl. Acad. Sci. USA. 2006;103:18493–18498. doi: 10.1073/pnas.0604977103. [DOI] [PMC free article] [PubMed] [Google Scholar]
- 14.Adachi M, Ohhara T, Kurihara K, Tamada T, Honjo E, Okazaki N, Arai S, Shoyama Y, Kimura K, Matsumura H, Sugyiama S, Adachi H, Takano K, Mori Y, Hidaka K, Kimura T, Hayashi Y, Kiso Y, Kuroki R. Proc. Natl. Acad. Sci. USA. 2009;106:4641–4646. doi: 10.1073/pnas.0809400106. [DOI] [PMC free article] [PubMed] [Google Scholar]
- 15.Gardberg AS, Del Castillo AR, Weiss KL, Meilleur F, Blakeley MP, Myles DA. Acta Cryst. 2010;D66:558–567. doi: 10.1107/S0907444910005494. [DOI] [PubMed] [Google Scholar]
- 16.Adams PD, Mustyakimov M, Afonine PV, Langan P. Acta Cryst. 2009;D65:567–573. doi: 10.1107/S0907444909011548. [DOI] [PMC free article] [PubMed] [Google Scholar]
- 17.Fisher SZ, Kovalevsky AY, Mustyakimov M, Silverman DN, McKenna R, Langan P. Biochem. 2011;50:9421–9423. doi: 10.1021/bi201487b. [DOI] [PMC free article] [PubMed] [Google Scholar]
- 18.Kovalevsky AY, Hanson BL, Mason SA, Yoshida T, Fisher SZ, Mustyakimov M, Forsyth VT, Blakeley MP, Keen DA, Langan P. Angew. Chem. Int. Ed. 2011;50:7520–7523. doi: 10.1002/anie.201101753. [DOI] [PubMed] [Google Scholar]
- 19.Lesburg CA, Huang C, Christianson DW, Fierke CA. Biochemistry. 1997;36:15780–15791. doi: 10.1021/bi971296x. [DOI] [PubMed] [Google Scholar]
- 20.Vullo D, Franchi M, Gallori E, Pastorek J, Scozzafava A, Pastorekova S, Supuran CT. Bioorg. Med. Chem. Lett. 2003;13:1005–1009. doi: 10.1016/s0960-894x(03)00091-x. [DOI] [PubMed] [Google Scholar]
Associated Data
This section collects any data citations, data availability statements, or supplementary materials included in this article.


